2560
MR Elastography and PDFF as Imaging Biomarkers for Diabetic Kidney Disease: Correlating MR Measurements with Histopathology1Mayo Clinic Arizona, Scottsdale, AZ, United States, 2National Institutes of Health, Bethesda, MD, United States
Synopsis
The purpose of this pilot study is to determine technical feasibility and correlate MR Elastography (MRE) and Proton Density Fat Fraction (PDFF) with gold standard assessments of glomerular function and histopathology markers.
Introduction
An estimated 30 million American adults have chronic kidney disease (CKD), with many more at risk. As early detection can help prevent progression to kidney failure, and current relevant clinical assessments are relatively deficient and/or have attendant risks/complications, there is need for identification of improved noninvasive biomarkers for end-organ damage. The purpose of this pilot study is to determine technical feasibility and correlate advanced MR imaging techniques MR Elastography (MRE) and Proton Density Fat Fraction (PDFF) with gold standard assessments of glomerular function and histopathology markers.Method
Eleven patients were scanned with a 1.5T MRI (General Electric, Waukesha, Wisconsin) with 8-channel body coil. Axial and coronal MRE and PDFF scans were performed. For PDFF, whole kidney acquisitions were be performed using a complex-based, six-echo 3D chemical shift-encoded method (ref 1, 2). Kidney MRE was performed in the same session with a modified 3D EPI phase-contrast sequence which were then processed with an inversion algorithm to generate a quantitative image of shear stiffness (ref 3, 4, 5). The MRE scans were performed in axial and coronal-oblique planes. The MRE and PDFF measurements were performed by manually by drawing ROI on left and right kidney medulla. The biopsy samples were analyzed on a paraffin media. The following histopathology markers were evaluated for correlation with MRE and PDFF: GBM (glomerular basement membrane width), P_FPW (foot process width in peripheral glomerular basement membrane), INTACT (percent of intact foot processes on both the peripheral and mesangial glomerular basement membrane), P_FEN (percent of endothelial fenestration falling on the peripheral glomerular basement membrane), and VVINT (cortical interstitial fractional volume).Results
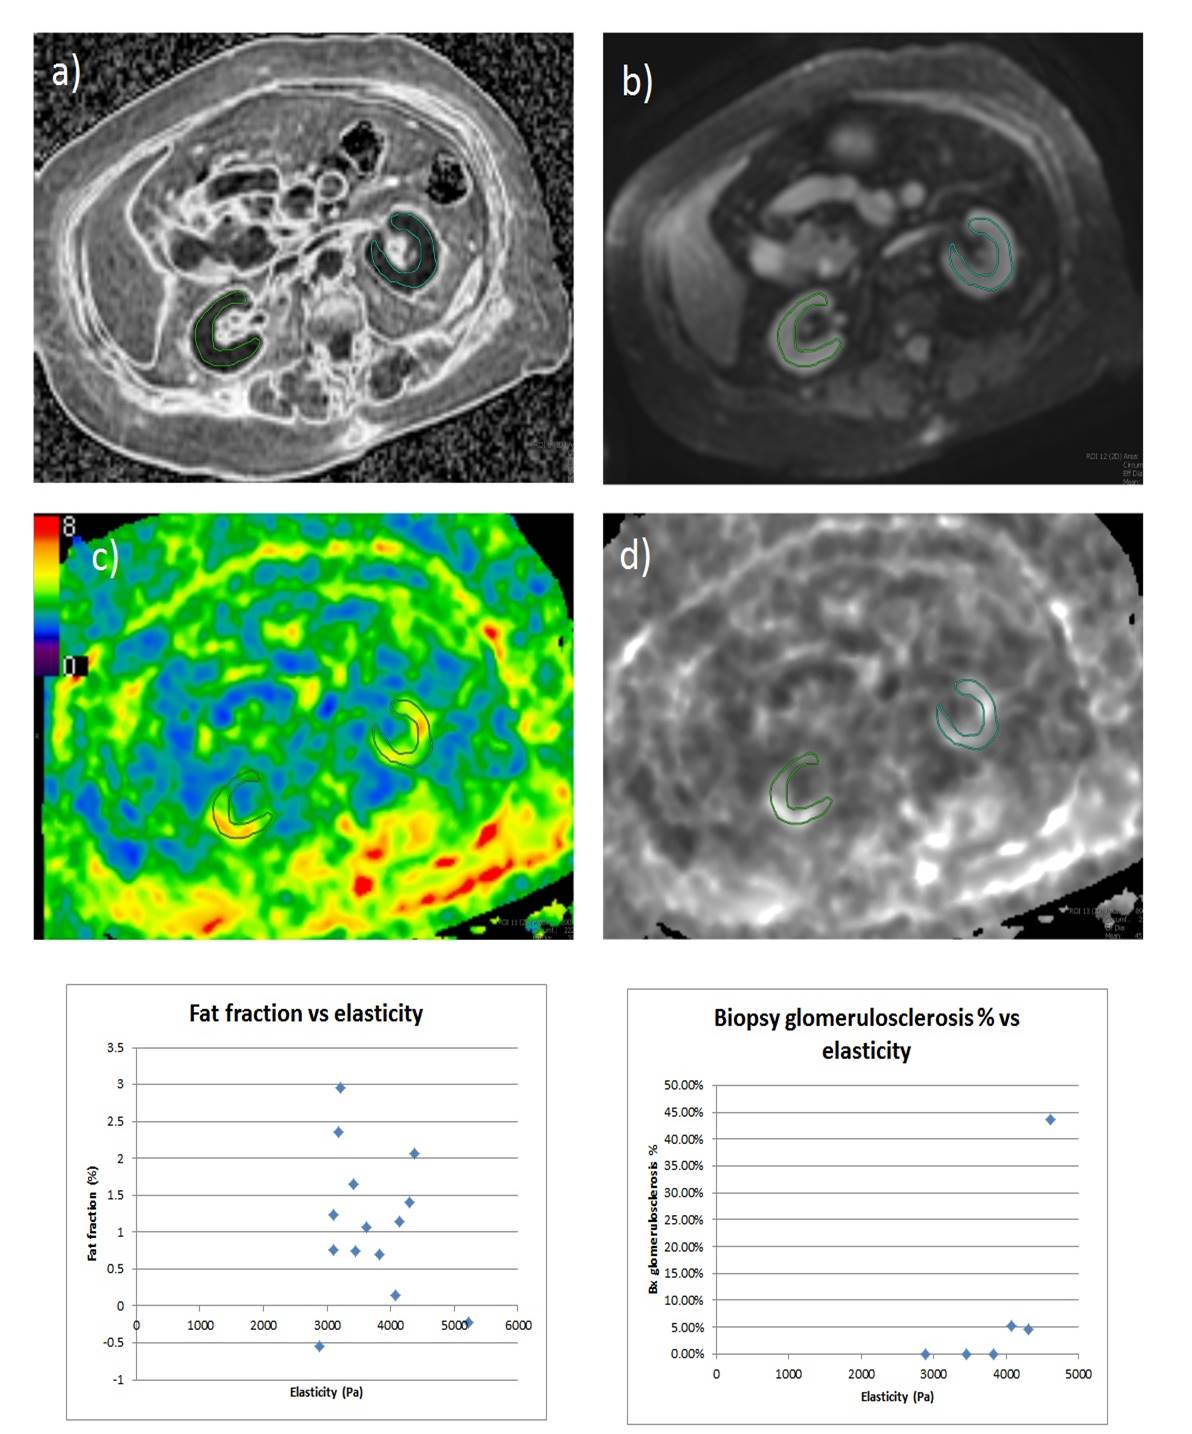
Biopsy glomerulosclerosis percent varied from 0% to patient with normal kidney to 45% for patients with low GFR. The PDFF measurements ranged from 0-3% and elasticity measurements ranged from 2.8 kPa to 5.4 kPa.Discussion
Patients with biopsy glomerulosclerosis percent greater than 0% showed higher kidney stiffness measuring greater than 4.0 kPa on MRE. No significant correlation was observed between biopsy glomerulosclerosis percent and PDFF. Further no correlation was observed between MRE and PDFF measurements.Conclusion
To our knowledge this is the first study correlating MRE/PDFF and several key histopathology markers (GBM, P_FPW, INTACT, P_FEN, and VVINT) in patients with diabetic kidney disease. MR Elastography of kidney could be a viable imaging biomarker for correlating MR measurements with histopathology.Acknowledgements
No acknowledgement found.References
1. Idilman IS, Tuzun A, Savas B, Elhan AH, Celik A, Idilman R, Karcaaltincaba M. Quantification of liver, pancreas, kidney, and vertebral body MRI-PDFF in non-alcoholic fatty liver disease. Abdom Imaging. 2015 Aug;40(6):1512-9. doi: 10.1007/s00261-015-0385-0.
2. Idilman İS, Gümrük F, Haliloğlu M, Karçaaltıncaba M. The Feasibility of Magnetic Resonance Imaging for Quantification of Liver, Pancreas, Spleen, Vertebral Bone Marrow, and Renal Cortex R2* and Proton Density Fat Fraction in Transfusion-Related Iron Overload. Turk J Haematol. 2016 Mar 5;33(1):21-7. doi: 10.4274/tjh.2015.0142. Epub 2015 Aug 6.
3. Silva AM, Grimm RC, Glaser KJ, Fu Y, Wu T, Ehman RL, Silva AC. Magnetic resonance elastography: evaluation of new inversion algorithm and quantitative analysis method. Abdom Imaging. 2015 Apr;40(4):810-7. doi: 10.1007/s00261-015-0372-5.
4. Bensamoun SF, Robert L, Leclerc GE, Debernard L, Charleux F. Stiffness imaging of the kidney and adjacent abdominal tissues measured simultaneously using magnetic resonance elastography.Clin Imaging. 2011 Jul-Aug;35(4):284-7. doi: 10.1016/j.clinimag.2010.07.009.
5. Korsmo MJ, Ebrahimi B, Eirin A, Woollard JR, Krier JD, Crane JA, Warner L, Glaser K, Grimm R, Ehman RL, Lerman LO. Magnetic resonance elastography noninvasively detects in vivo renal medullary fibrosis secondary to swine renal artery stenosis. Invest Radiol. 2013 Feb;48(2):61-8. doi: 10.1097/RLI.0b013e31827a4990.
Figures