2559
Studying the effect of ambient temperatures on heat production of activated BAT in rats using magnetic resonance thermometry1Shenzhen Institutes of Advanced Technology,Chinese Academy of Sciences, Shenzhen, China, 2Shenzhen Hospital of Guangzhou University of Chinese Medicine, Shenzhen, China
Synopsis
Cold exposure is the commonly used method in evaluating the brown adipose tissue (BAT) activation. In this study, the heat production capacity of BAT in rats housed at different ambient temperatures were evaluated using magnetic resonance thermometry after injecting norepinephrine (NE). The results show that the rats housed at lower ambient temperature (15°C) for 2 weeks have surprisingly lower temperature rise after NE injection, implying that long-term cold exposed rats have lower heat production capacity after drug activation.
Introduction
Brown adipose tissue (BAT) burns fat and dissipates energy in heat after cold exposure or injecting β3-agonist1. Cold exposure is the most commonly used method in evaluating the BAT activation, especially for human study. In the present study, we aimed to assess the effect of different ambient temperatures on heat production of BAT in rats using magnetic resonance thermometry after activated by Norepinephrine. A proposed fat-referenced dual-step iterative temperature estimation (DITE) PRFS method is adopted to measure the temperature change in activated BAT2. The results show that the rats housed at lower ambient temperature (15°C) for 2 weeks have surprisingly lower temperature rise after NE injection, implying that rats with long-term cold exposure is less sensitive to drug activation.Methods
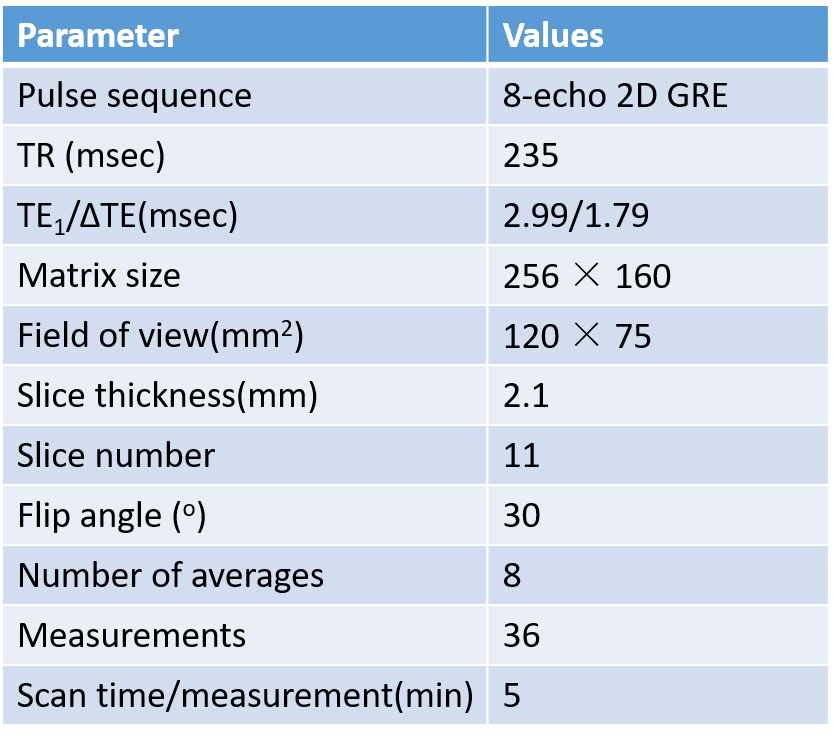
In this study, eight SD rats (aged 7-8 weeks, weights 280–300g) were divided randomly into two groups housed at 30°C and 15°C ambient temperatures for 2 weeks in a temperature-controlled incubator (LP-80LED-6CTAR, NK systems, Tokyo, Japan). The study was approved by Animal Care and Use Committee of Shenzhen Institutes of Advanced Technology, CAS. During the experiment, the rats were anesthetized by isoflurane and the rectal temperatures were monitored by an MR-compatible fluorescent optic-fiber thermometer. The MRI scans were completed using a 3.0T scanner (uMR 790, Shanghai United Imaging healthcare, Shanghai, China) using an 8-echo gradient-echo sequence. A 12-channel rat/mouse coil was used to acquire images. MRI parameters are summarized in Table 1. The imaging slices were located in the interscapular BAT (iBAT) area. The scan time of each measurement was 5 minutes and a total of 36 successive measurements were acquired. The total acquisition time was 180 minutes. BAT was further activated by injecting NE in a dose of 1 mg/kg through intraperitoneal injection immediately after 6th measurement (30 minutes).The proposed fat-referenced DITE proton resonance frequency shift (PRFS) method was adopted to measure the temperature change of iBAT area for all eight rats. For each measurement, the dynamic fat fraction (FF) maps could be also generated by DITE method from the separated water and fat images, which were used to monitor the change of fat content in BAT.
Results
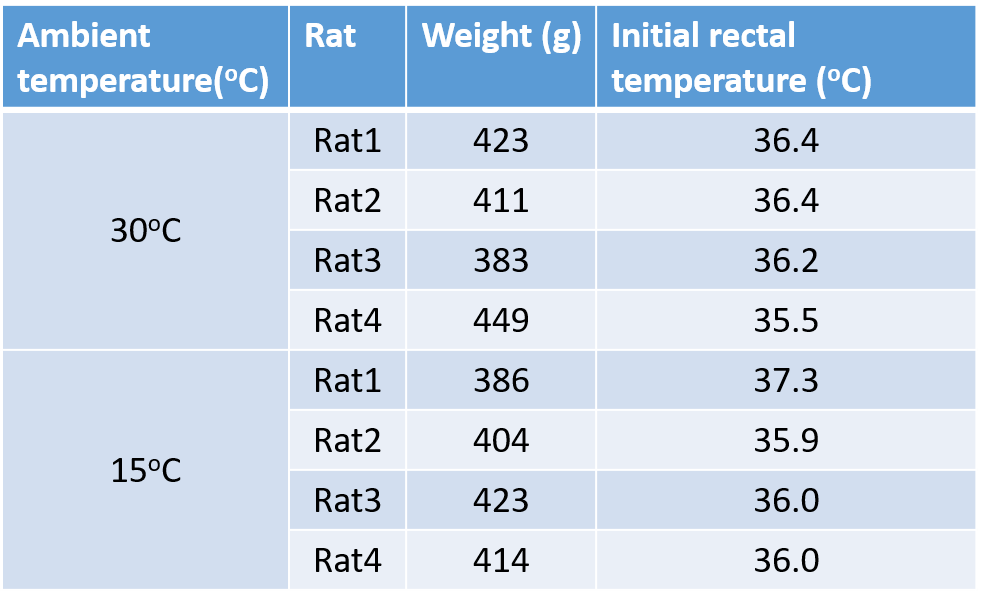
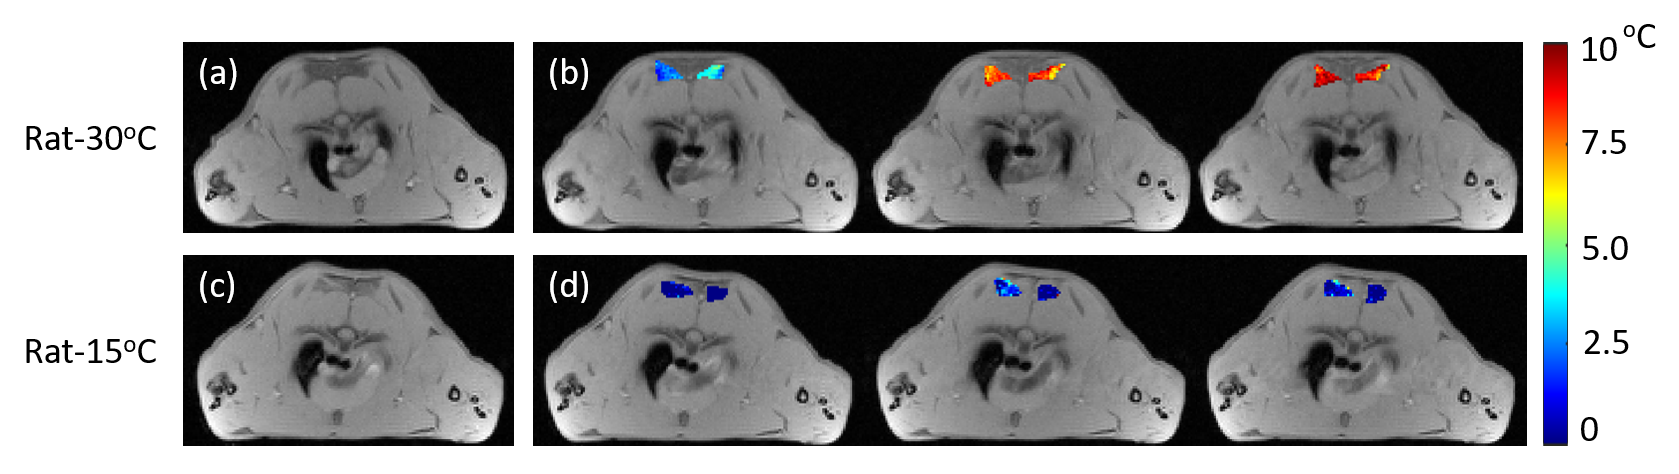
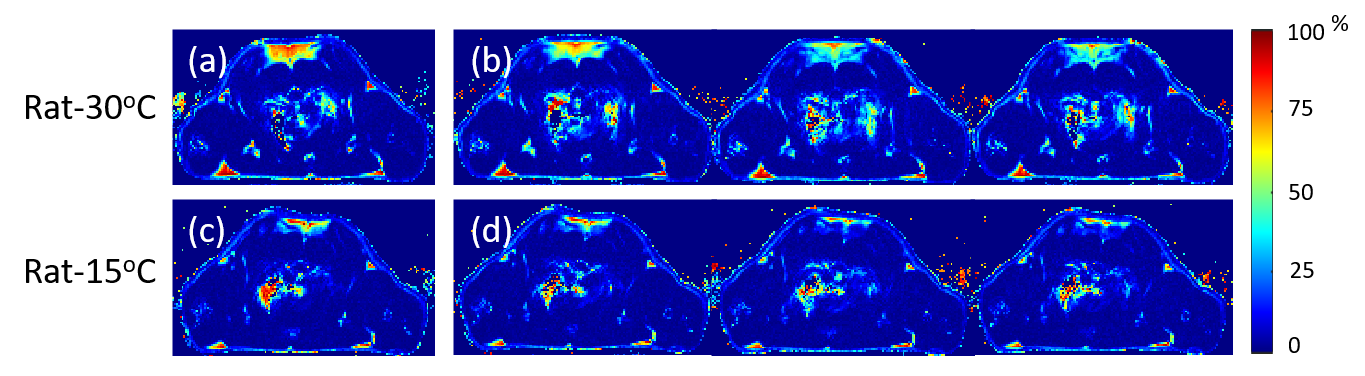
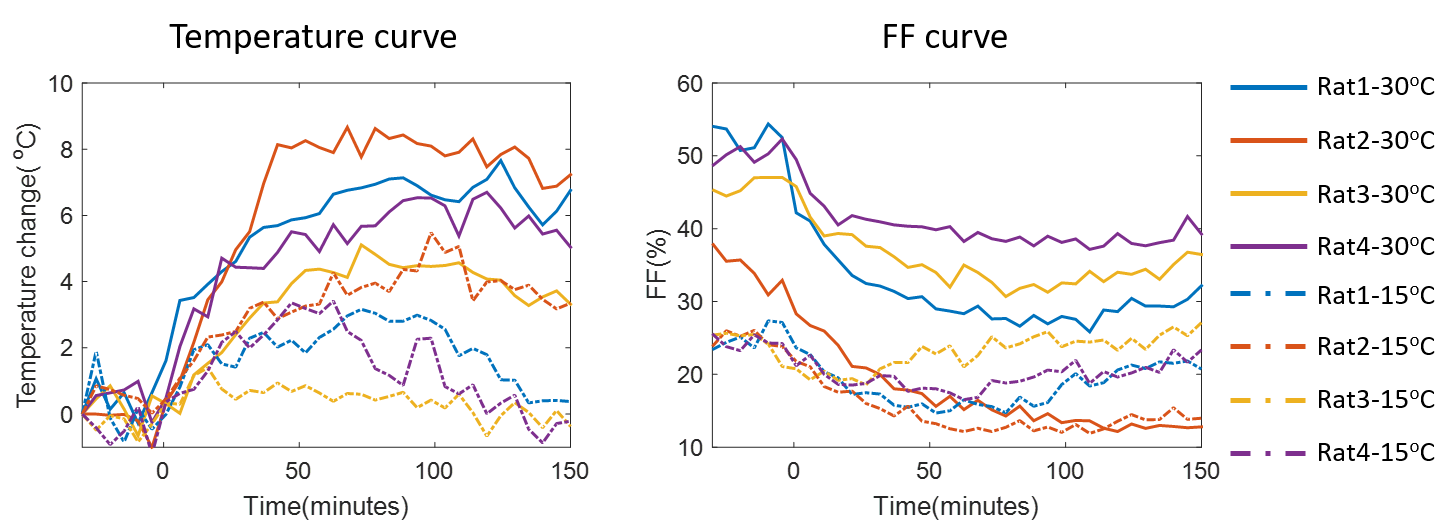
Table 2 shows the weights and initial rectal temperatures before MR scanning for all eight rats. We can see that there are no significant differences of weights or initial rectal temperatures between two groups. The temperature change maps of two rats from two ambient temperatures are shown in Figure 1. The first echo magnitude images of the first measurement for two rats are shown in Figure 1(a,c). The ROIs are drawn in the iBAT area. The distributions of the relative temperature change at the 5, 65 and 125 minutes after NE injection in the ROIs are overlapped in the magnitude images and are shown in Figure 1(b,d). The Fat fraction (FF) images for these two rats before and after NE injection (5, 65 and 125 minutes) are shown in Figure 2. Figure 3 shows the mean temperature change curve and FF curve in the ROIs over all of the measurements for eight rats. As shown in FIG. 1-3, the rats housed at 15°C have lower FF before MR scanning and are less sensitive to NE activation with lower temperature rise in comparison with rats at 30°C. The maximal temperature rise for the two groups were: ~5/3/3/1 °C for 15°C group, and~8/7/6/5 °C for 30°C group (see FIG. 3).Discussion and conclusions
In this study, we assessed the BAT heat generation capability of rats housed at different ambient temperatures for 2 weeks by injecting NE using MR fat-referenced PRFS method. Surprisingly, we found that the rats housed below thermoneutrality had lower temperature rise after NE injection. We assumed that the thermogenic gene UCP1 in these rats is expressed at a high level due to long-term cold exposure. The up-regulation capacity of UCP1 expression to the further NE activation is saturated in comparison with the rats at thermoneutrality. Besides, as shown in FIG.3, the initial FFs in the rats at 15°C were below 25%. The low fat content in BAT location may also limit the heat production due to the insufficient substrate supply. On the other hand, rats housed at thermoneutrality were more sensitive to the NE activation. The hypothesis will be further investigated by biological analysis in our next work.Acknowledgements
This research was supported by the Natural Science Foundation of China, No.61901462, and the China Postdoctoral ScienceFoundation, No.2019M650220References
1. Villarroya F, Cereijo R, Villarroya J, et al. Brown adipose tissue as a secretory organ[J]. Nature Reviews Endocrinology, 2017, 13(1): 26.
2. Cheng C, Zou C, Wan Q, et al. Dual‐step iterative temperature estimation method for accurate and precise fat‐referenced PRFS temperature imaging[J]. Magnetic resonance in medicine, 2019, 81(2): 1322-1334.
Figures