2558
Estimation of the triglyceride fatty acid composition in human adipose tissue using multi-TE and SHORTIE STEAM: in vitro validation using GC-MS1Department of Diagnostic and Interventional Radiology, School of Medicine, Technical University of Munich, Munich, Germany, 2Else Kröner Fresenius Center for Nutritional Medicine, Technical University of Munich, Freising, Germany, 3ZIEL Institute for Food & Health, Research Group Lipid Metabolism, Technical University of Munich, Freising, Germany, 4Department of Surgery, Klinikum rechts der Isar, School of Medicine, Technical University of Munich, Munich, Germany
Synopsis
There is a growing interest in utilizing single-voxel $$$^1$$$H MR spectroscopy (MRS) for probing the triglyceride fatty acid composition by means of the number of double bounds (ndb) and number of methylene interrupted double bounds (nmidb) per triglyceride as well as the mean fatty acid carbon chain length (CL). The present study investigates the in vitro measurement agreement of fatty acid composition parameters between single-voxel multi-TE and short-TR multi-TI multi-TE (SHORTIE) STEAM spectroscopy and the gold standard gas chromatography-mass spectrometry (GC-MS) in human subcutaneous and visceral adipose tissue samples.
Introduction / Purpose
Overweight or obesity increase the individual’s risk to develop type 2 diabetes and cardiovascular-related disease.[1,2] Central obesity is a key component in metabolic syndrome where e.g. the accumulation of visceral adipose tissue (VAT) and subcutaneous adipose tissue (SAT) is differently affecting the development of type 2 diabetes.[3] Besides energy storage in adipose tissue in the form of triglycerides, fatty acids may serve – depending on their properties – multiple different purposes in e.g. biological cell structures, processes and signal pathways. A better understanding of the impact of triglyceride fatty acid composition and their expressed patterns under physiological and pathophysiological conditions may therefore help to better understand and identify underlying process mechanisms.[4] Previous spectroscopic studies of adipose tissue including validation against gas chromatography-mass spectrometry (GC-MS) were performed in healthy overfeed volunteers[5] and lymphedema patients[6]. Traditionally, single-voxel multi-TE STEAM[5,6,7] was used together with a T2 correction scheme and constrained peak fitting strategies which are required due to overlapping signal peaks. Recently, short-TR multi-TE multi-TE (SHORTIE) STEAM[8] was proposed for simultaneous T1, T2 and PDFF estimation in brown adipose tissue. When compared to multi-TE STEAM, SHORTIE STEAM exhibits the advantage of an improved readout efficiency in combination with sensitivity to T1 which may by utilized to further improve the quantification performance of the triglyceride fatty acid composition.Therefore, the purpose of this study is to evaluate the in vitro measurement agreement between multi-TE STEAM and SHORTIE STEAM Min conjunction with selected constrained fitting strategies and GC-MS, respectively, for the estimation of characteristic triglyceride parameters in human subcutaneous and visceral adipose tissue samples.
Methods
Sample extraction and GC-MSIn total 12 formaldehyde-fixated adipose tissue samples were obtained from abdominoplasty (9 SAT samples from 6 individuals (maximum 2 samples per subject) and omental abdominal surgery (3 VAT samples from 3 individuals). Phenotypic information is summarized in Table 1 (Fig. 5). GC-MS was performed as described previously in [9]. The study was approved by the ethics committee of the Technical University of Munich.
Pulse sequences
A single-voxel multi-TE STEAM sequence was used assuming the following simplified signal model (neglecting T1 effects):
$$S\left(\mathit{TE}\right)=\rho{e^{-\frac{\mathit{TE}}{T_2}}},$$
where $$$\rho$$$ denotes the proton density signal.
Furthermore, a single-voxel SHORTIE STEAM sequence[8] (Fig. 1) was utilized with the following signal model:
$$S\left(\mathit{TI},\mathit{TE},\mathit{TM},\tau\right)=\rho\left(1-2 e^{-\frac{\mathit{TI}}{T_1}}+e^{-\frac{\tau+\mathit{TI}}{T_1}}\right)e^{-\frac{\mathit{TM}}{T_1}}e^{-\frac{\mathit{TE}}{T_2}},$$
where the signal is additionally modeled as a function of the sequence parameters TI, TM and the recovery delay $$$\tau$$$.
In vitro measurements
The two experiments were performed with matched scan times: i) multi-TE STEAM: TE=12/15/20/25/50/75ms, TR=5000ms, number of samples=4096, 4 phase cycles in 4 averages, scan time=02:30min; and ii) SHORTIE STEAM: TI=8/83/233/458/833/1133ms, TE=10/15/20/25/70ms, TR(min)=801ms, $$$\tau$$$=774ms, number of samples=2048, scan time=02:32min. Both sequences shared the following parameters: voxel-size of 12x12x12mm$$$^3$$$, 4 phase cycles in 4 averages, TM=16ms, spectral bandwidth=3000Hz.
All measurements were performed on a 3T scanner (Ingenia Elition X, Philips Healthcare, The Netherlands) using the 8-channel small extremity coil and 8-channel wrist coil for the SAT and VAT samples, respectively.
Quantification
A joint-series time domain-based model fitting was implemented using MATLAB's Levenberg-Marquardt algorithm. The following general signal equation was used and adapted to the needs of the respective sequence:
$$S\left(t\right)=e^{j\phi}\sum_i\rho_{i}e^{(j2\pi\omega_i-d_i-g_i t)t}\left(1-2e^{-\frac{\mathit{TI}}{T_{1,i}}}+e^{-\frac{\tau+\mathit{TI}}{T_{1,i}}}\right)e^{-\frac{\mathit{TM}}{T_{1,i}}}e^{-\frac{\mathit{TE}}{T_{2,i}}},$$
where $$$\rho_i$$$ is the proton density, $$$d_i$$$ and $$$g_i$$$ are the Lorentzian and Gaussian damping factors, respectively, and $$$\omega_i$$$ is the precession frequency of the $$$i$$$th frequency component, respectively, and $$$\phi$$$ represents a common additional phase term.
Three fitting strategies were applied per sequence: a) Q1: a relaxation-constrained fitting, b) Q2: a 10-peak-triglyceride model[10]-constrained fitting and c) Q3: a relaxation-constrained plus triglyceride model-constrained fitting. An overview of the degrees of freedom is given in Table 2 (Fig. 5). The 10-peak-triglyceride model [10] was used to determine the triglyceride parameters ndb, nmidb and CL and thereof the fractional fatty acid parameters saturated and unsaturated fatty acids (SFA,UFA) and mono-unsaturated and poly-unsaturated fatty acids(MUFA,PUFA).[11]
Results
The spectral appearance (Fig. 2) of the multi-TE STEAM and SHORTIE STEAM is showing the expected triglyceride features. Correlations with GC-MS-derived triglyceride and fatty acid parameters are given in Fig. 3 and Fig. 4, respectively. Fitting strategy Q3 yielded the following correlations for the triglyceride parameters ndb (multi-TE: slope=0.29,intercept=1.48,r=0.57,p=0.053, SHORTIE: slope=0.30,intercept=1.36,r=0.72,p=0.008), nmidb (multi-TE: slope=0.20,intercept=0.28,r=0.625,p=0.030, SHORTIE: slope=0.42,intercept=0.16,r=0.68,p=0.015).Discussion
SHORTIE STEAM achieved higher measurement agreement with GC-MS compared to multi-TE STEAM in the assessment of triglyceride fatty acid composition. Especially low abundant proton frequencies such as protons associated with the diallylic peak could be more reliable quantified using the T1-weighting-inducing inversion in the SHORTIE STEAM compared to only using the T2 weighting in the multi-TE STEAM and therefore yielded better correlations for the nmidb parameter. A fitting strategy (neither described nor shown) with a constraint CL value of 17.3 resulted in a bias in ndb and nmidb and did not improve the measurement agreement with GC-MS. The present study has some limitations. First, only a small sample size was available for the assessment of the measurement agreement. Second, the employed sampling scheme was not optimized for optimal estimation performance and third, J-modulations were not considered.Conclusion
In conclusion, SHORTIE STEAM in conjunction with a relaxation- and triglyceride model-constrained fitting strategy yielded the highest measurement agreement with GC-MS when compared to selected less constrained fitting strategies or multi-TE STEAM.Acknowledgements
The authors would like to thank Mark Zamskiy, Lisa Patzelt and Cora Held for their help with the samples scanning and Dr. Ursula Schulze-Eilfing and Dr. Charlotte Kleeberger for sample preparation. The present work was supported by Philips Healthcare. The present work was supported by the European Research Council (grant agreement No 677661, ProFatMRI). The present work reflects only the authors view and the EU is not responsible for any use that may be made of the information it contains.References
[1] Steven B Heymsfield and Thomas A Wadden. “ Mechanisms, pathophysiology, and management of obesity”. In: New England Journal of Medicine 376.3 (Jan. 2017), pp. 254–266.
[2] Maud Alligier et al. “Visceral fat accumulation during lipid overfeeding is elated to subcutaneous adipose tissue characteristics in healthy men”. In: Journal of Clinical Endocrinology & Metabolism 98.2 (Feb. 2013), pp. 802–810.
[3] Angeline Nemeth et al. “3D Chemical Shift- Encoded MRI for Volume and Composition Quantification of Abdominal Adipose Tissue During an Overfeeding Protocol in Healthy Volunteers”. In: Journal of Magnetic Resonance Imaging 376 (Oct. 2018), p. 254.
[4] Lena Trinh, Pernilla Peterson, and Sven Månsson. “In vivo validation of MRI-and MRS- based quantification of fatty acid composi- tionagainst gas chromatography”. In: ISMRM Workshop on MRI of Obesity & Metabolic Disorders. Singapore: https://cds.ismrm.org/protected/ObMet19/program/abstracts/Trinh.pdf, 2019.
[5] Angeline Nemeth et al. “Comparison of MRI- derived vs. traditional estimations of fatty acid composition from MR spectroscopy signals.” In: NMR in Biomedicine 31.9 (Sept. 2018), e3991.
[6] Gavin Hamilton et al. “ In vivo breath-hold1 H MRS simultaneous estimation of liver proton density fat fraction, and T1 and T2of water and fat, with a multi-TR, multi-TE sequence”. In: Journal of Magnetic Resonance Imaging 42.6 (Dec. 2015), pp. 1538–1543. 4
[7] Stefan Ruschke et al. “ Single-voxel short-TR multi-TI multi-TE (SHORTIE) STEAM for water–fat magnetic resonance spectroscopy”. In: Proceedings 27. Annual Meeting International Society for Magnetic Resonance in Medicine. Vol. 27. Montreal, Canada: http://archive.ismrm.org/2019/4230.html, 2019, p. 4230.
[8] Josef Ecker et al. “A rapid GC-MS method for quantification of positional and geometric isomers of fatty acid methyl esters.” In: Journal of Chromatography B 897 (May 2012), pp. 98– 104. [9] Gavin Hamilton et al. “In vivo characterization of the liver fat 1H MR spectrum.” In: NMR in Biomedicine 24.7 (Aug. 2011), pp. 784–790.
Figures
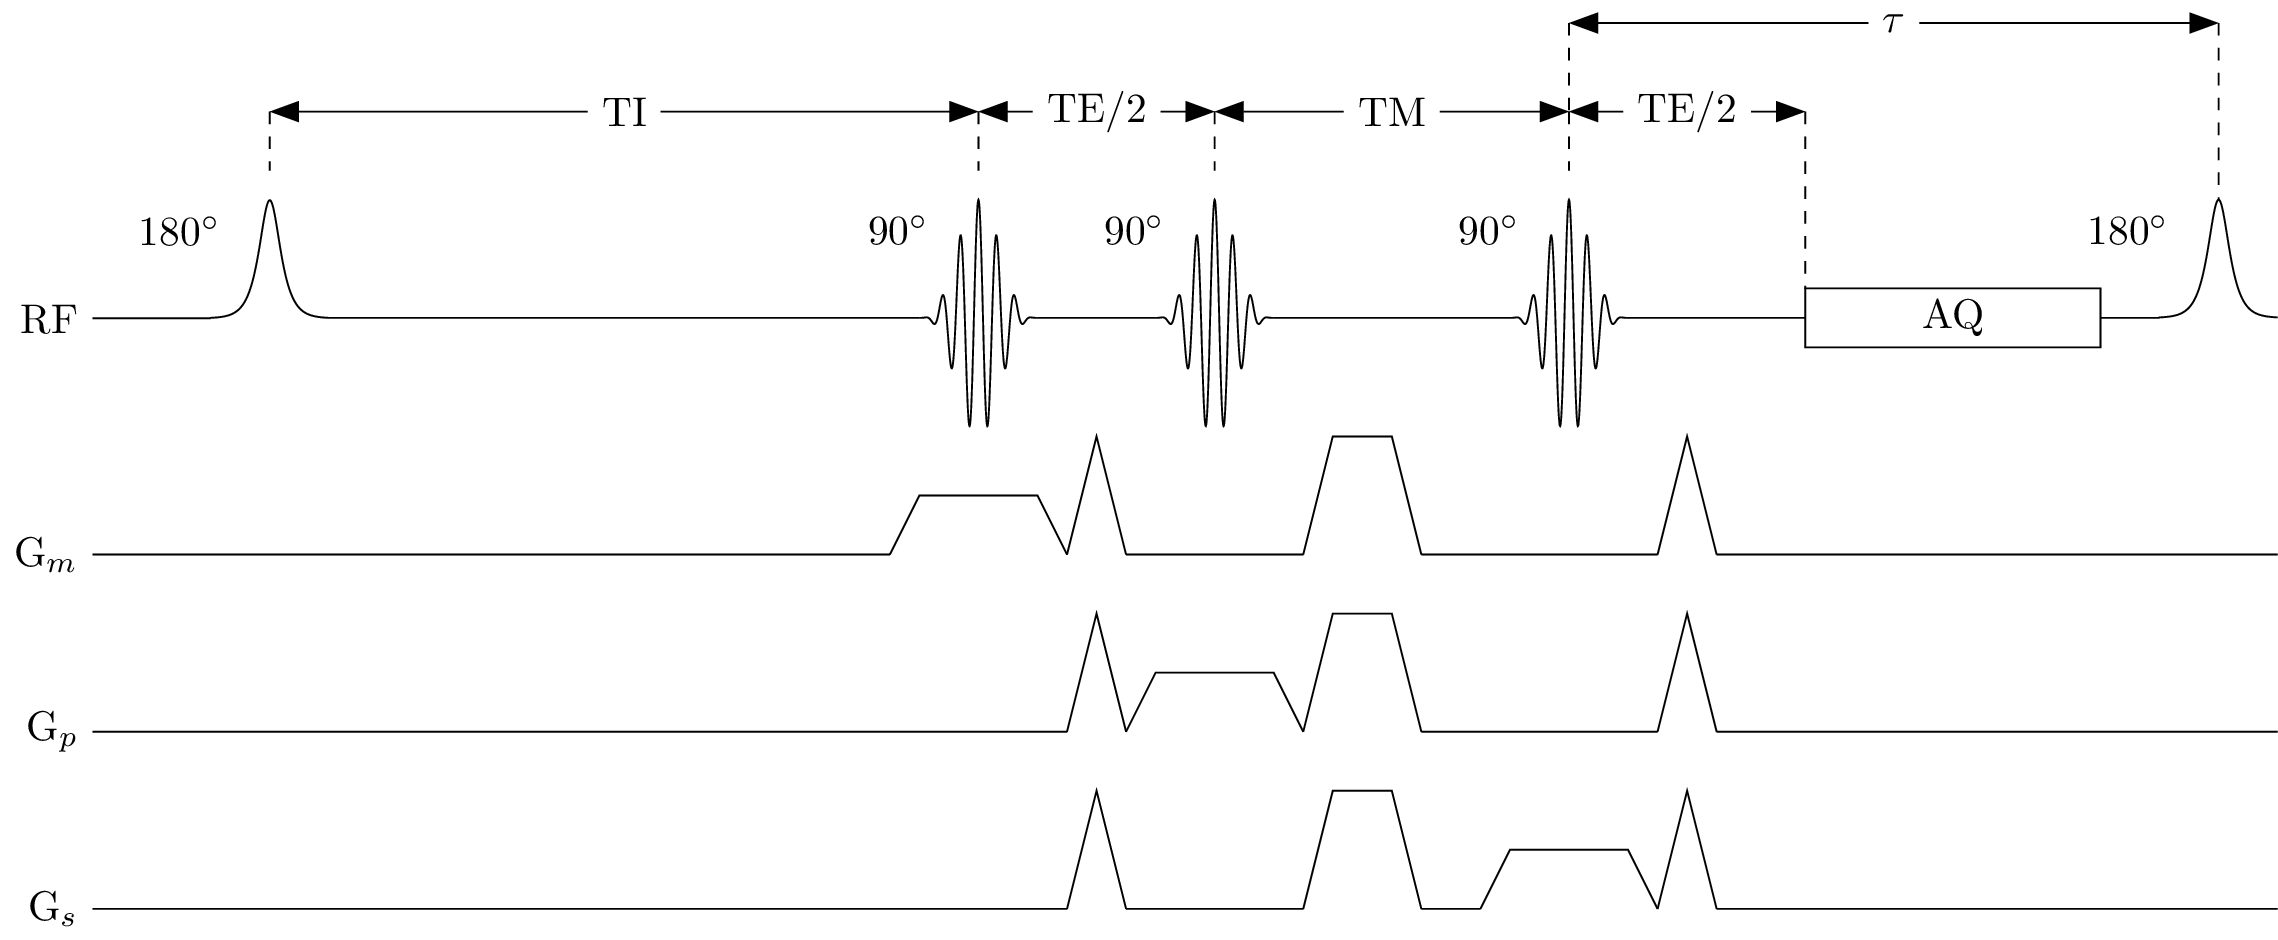
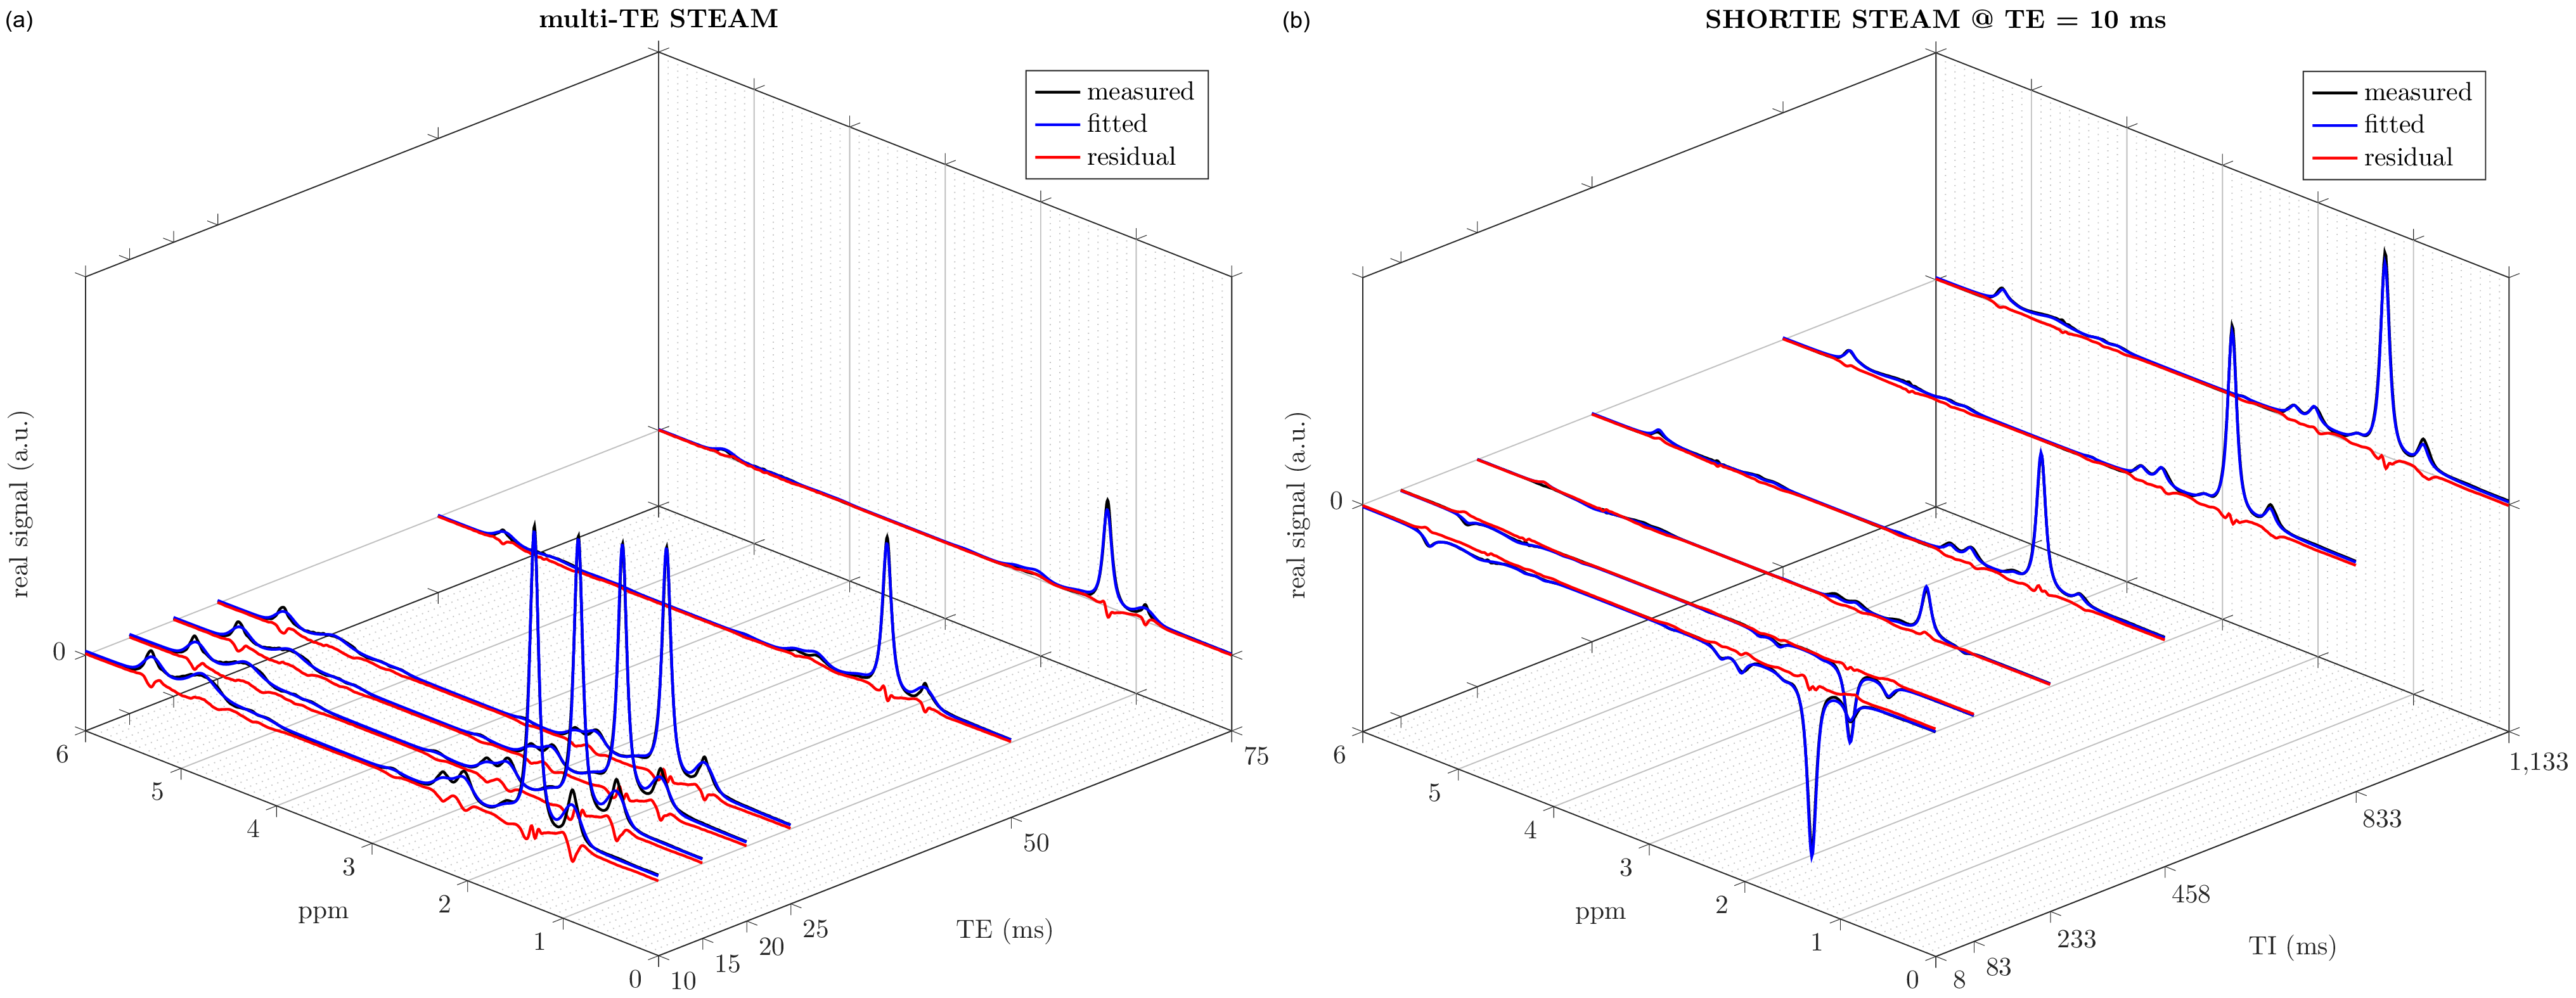
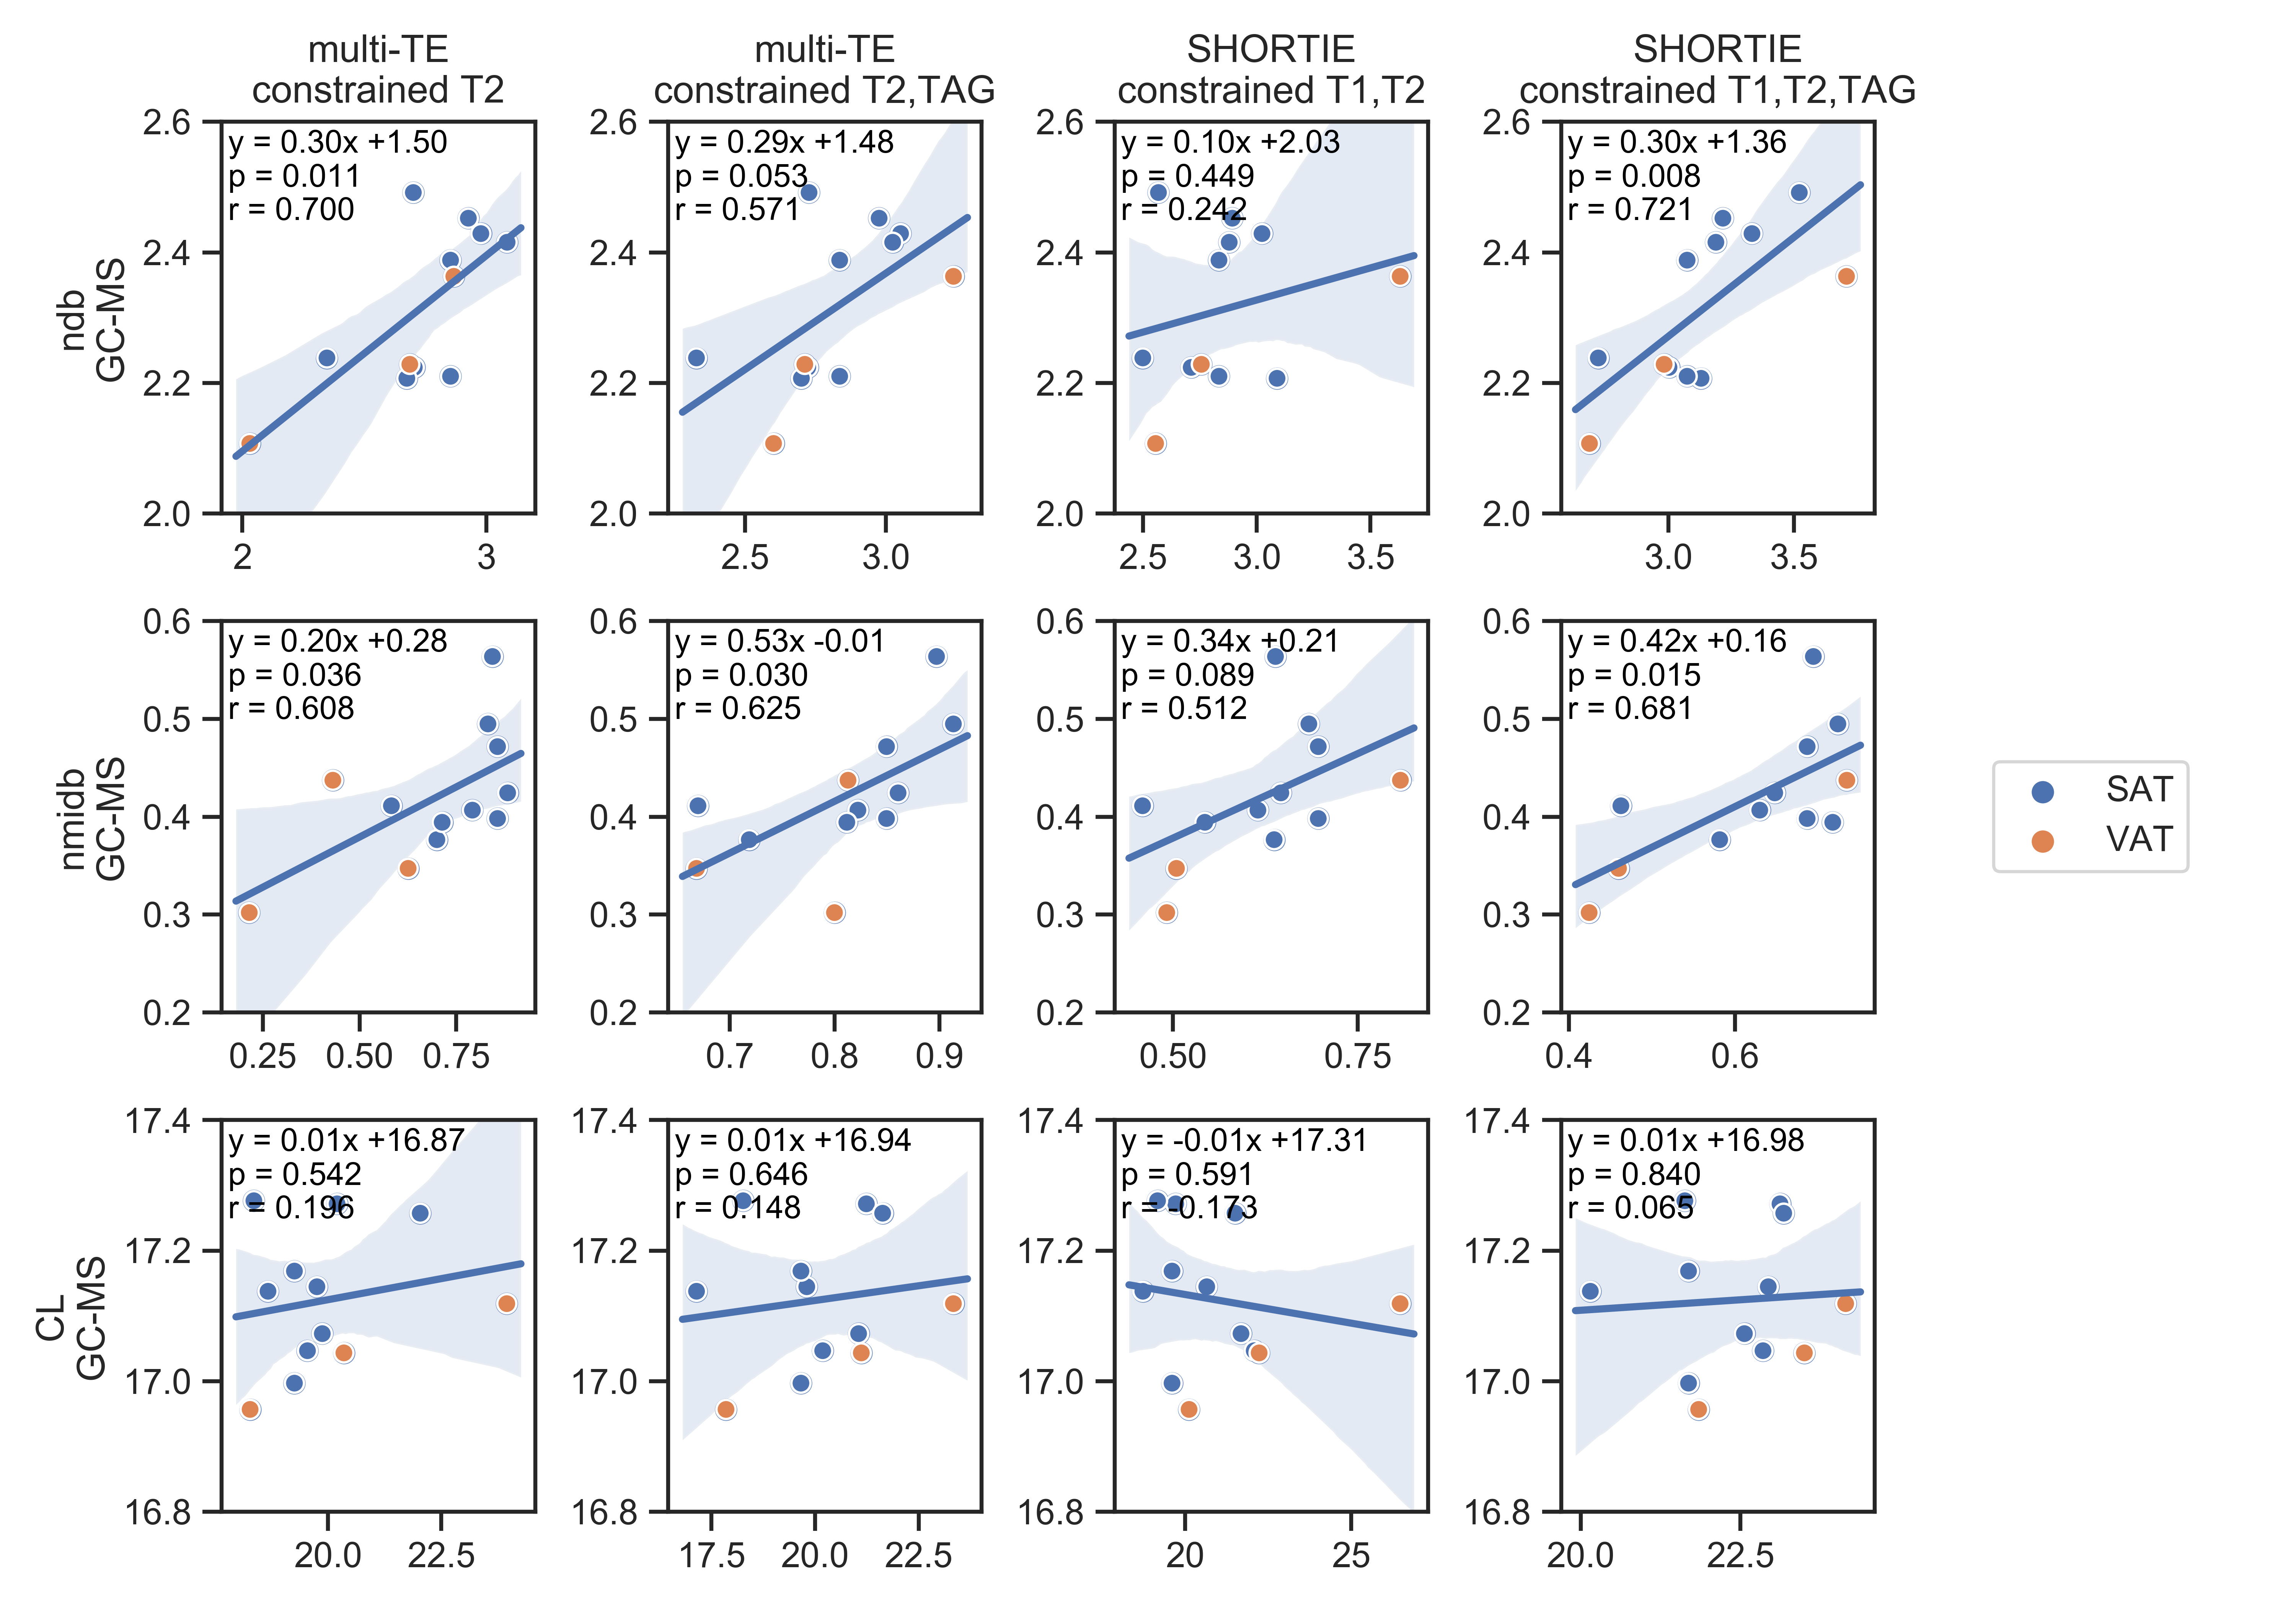
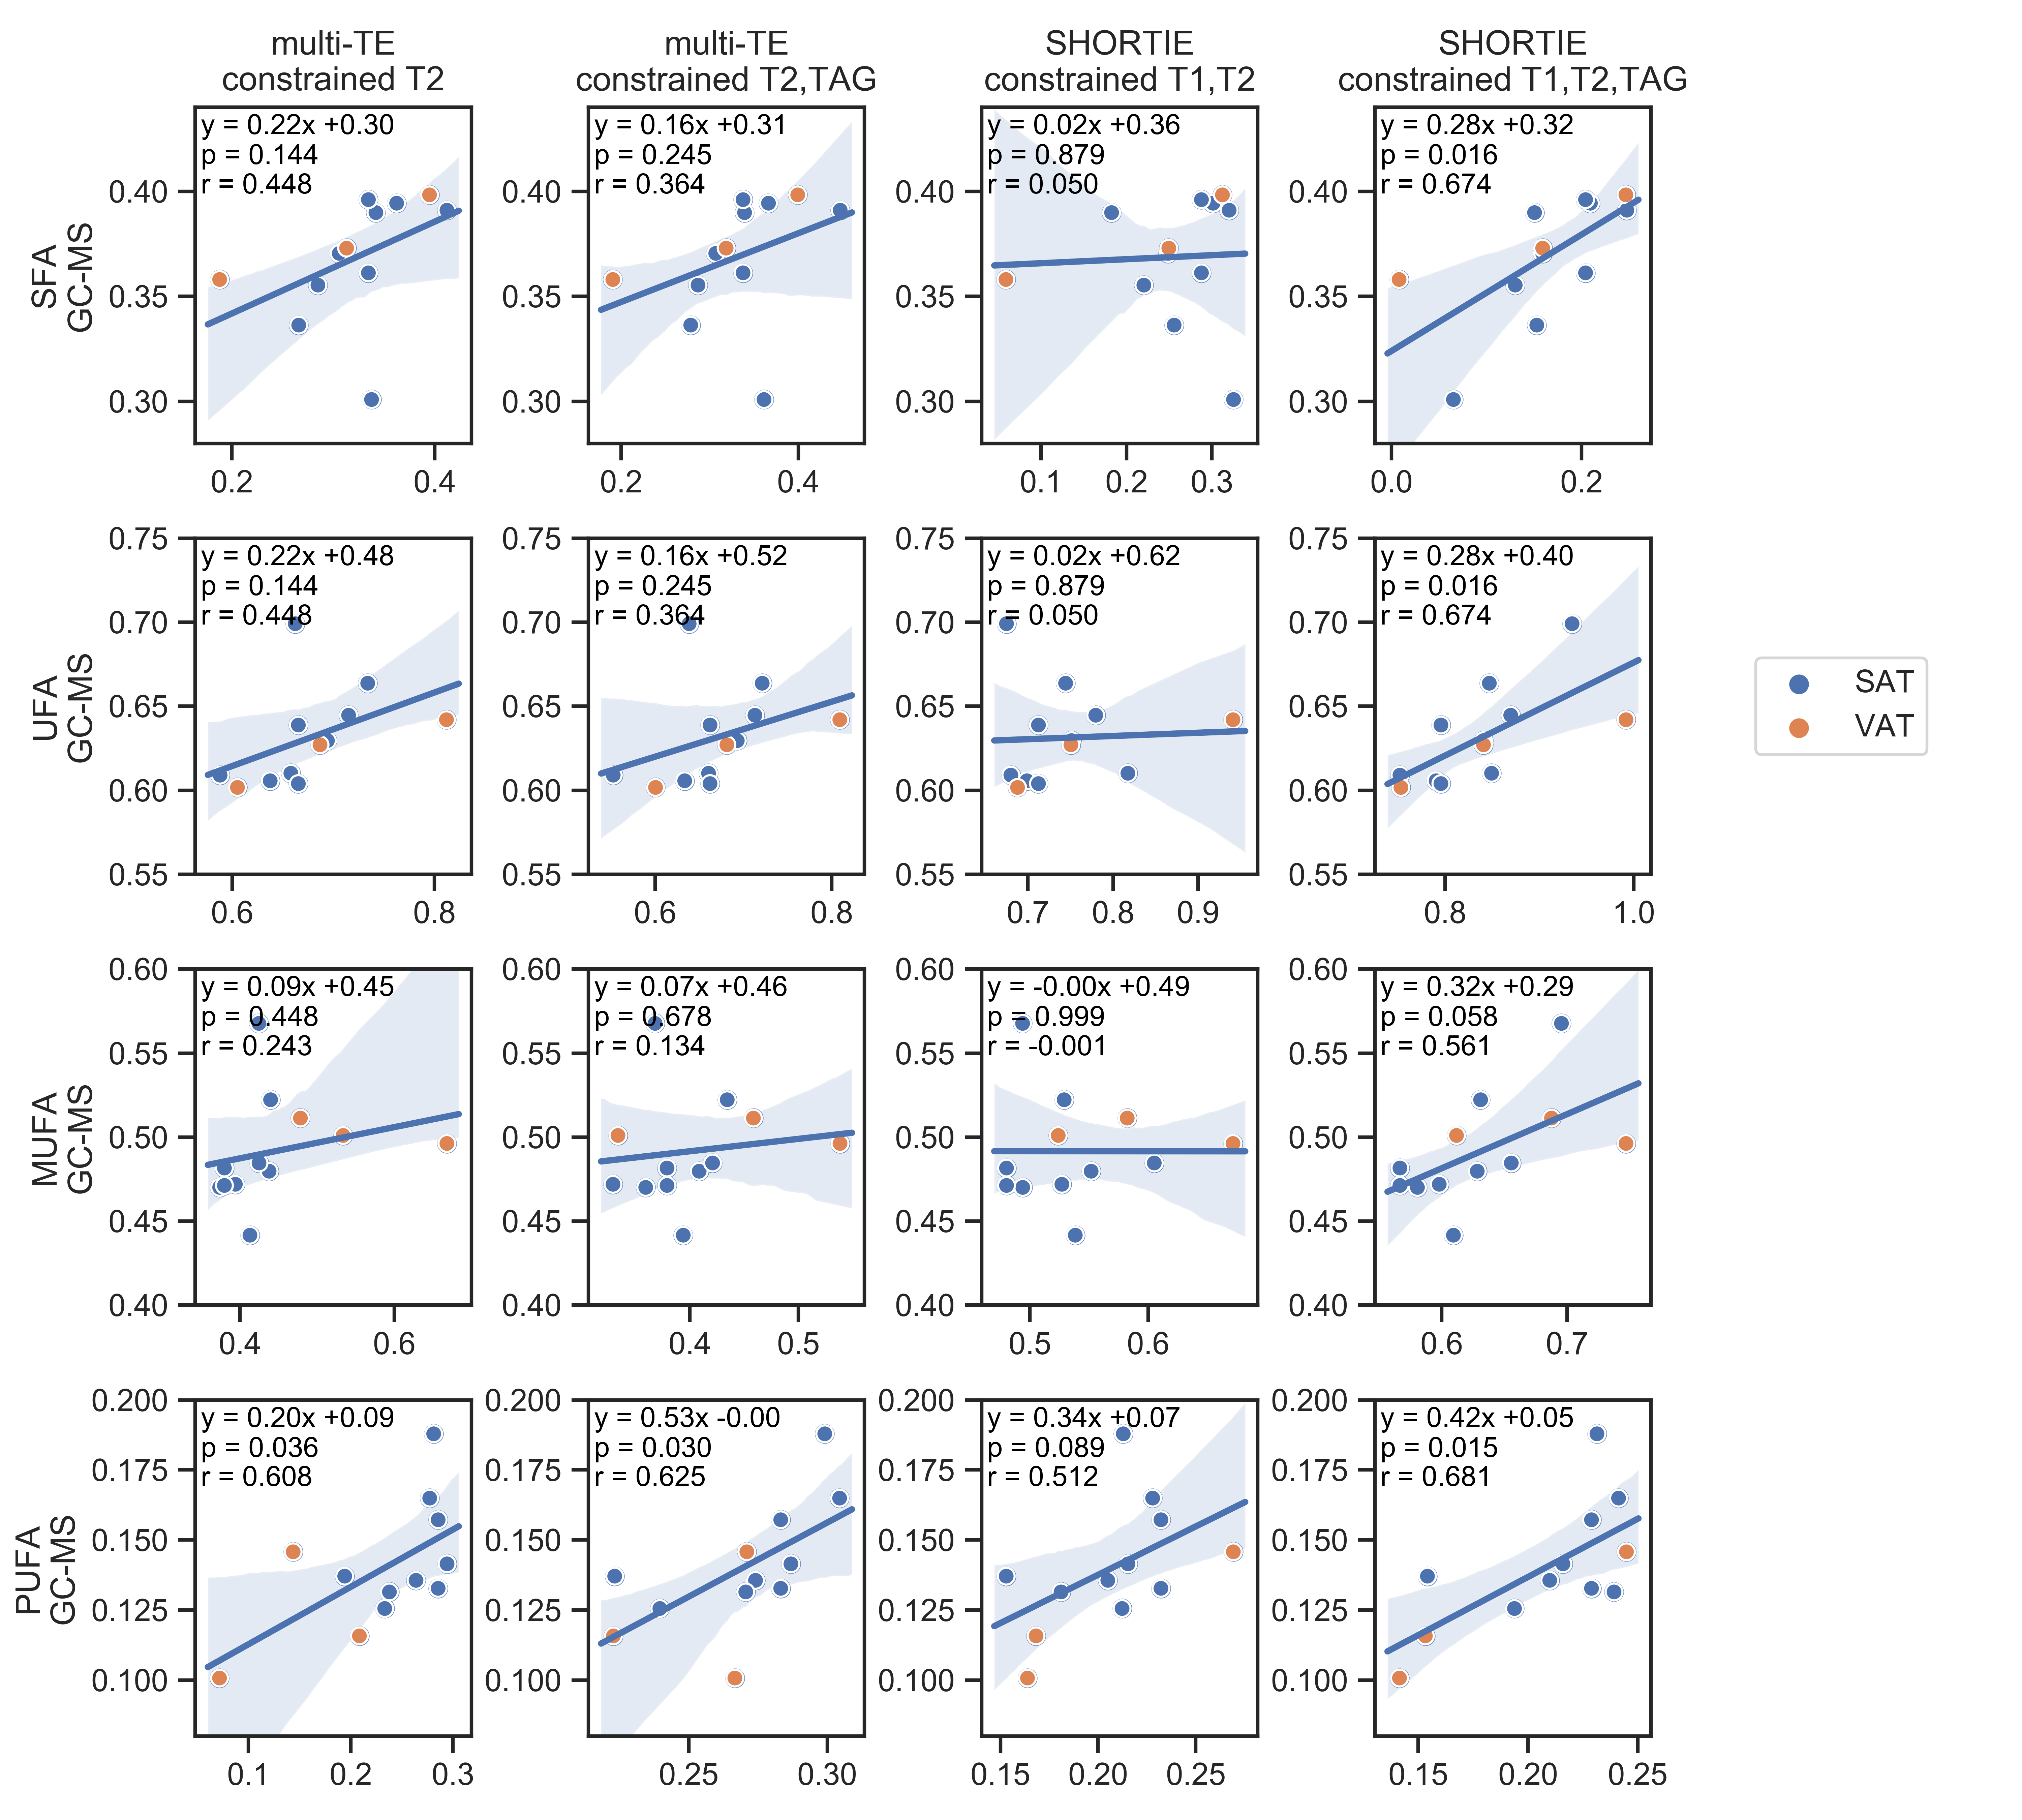

Fig. 5:
Table 1: Phenotype information of sample donors. BMI, body mass index; SD, standard deviation.
Table 2: Overview of the degrees freedom for the three fitting strategies: Q1 (relaxation-constrained fitting), Q2 (triglyceride model-constrained fitting) and Q3 (relaxation-constrained plus triglyceride model-constrained fitting). $$$ \rho_i $$$, proton density; $$$d_i$$$, Lorentzian damping factor; $$$g_i$$$, Gaussian damping factor; $$$\omega_i$$$, precession frequency of the $$$ i $$$th frequency component; $$$\phi$$$ additional phase term.