2557
Metabolic imaging of brown adipose tissue with intense exercise intervention
Venkatesh Gopalan1, Kavita Kaur1, Jadegoud Yaligar1, Sanjay Kumar Verma1, Rengaraj Anantharaj1, Le Thi Thu Giang1, and S Sendhil Velan1
1Laboratory of Molecular Imaging, Singapore BioImaging Consortium,A*STAR Research Entities, Singapore, Singapore
1Laboratory of Molecular Imaging, Singapore BioImaging Consortium,A*STAR Research Entities, Singapore, Singapore
Synopsis
There is a large interest in development of non-invasive methods for activation of brown adipose tissue (BAT) due to its potential to combat obesity. Exercise is a non-pharmacological strategy to combat obesity by increasing EE. In this study we have investigated exercise induced BAT activation, heat and RER in sedentary and exercise groups. Our results show that exercise activates the brown fat with reduction in fat fraction, increased heat and RER. UCP1 expression shows that reduction in “white” like adipocytes in exercise group.
Purpose
Exercise training reduces lipid content and inflammation, regulates browning and thermogenesis, as well as modulates production of adipokines1-3. Exercise also reduces fat accumulation in the adipose depots and muscle triglycerides4 with increased energy expenditure. The goal of this study was to investigate the role of intense exercise on brown adipose tissue activation and assess the heat and respiratory exchange ratio (RER) in chow diet fed rats.Methods
All in-vivo experiments were in compliance and approved by institutional animal care and use committee. Male Wistar rats (n=12) fed with chow diet (CD) were randomized into two groups including Gp1: sedentary (n= 6), Gp2: exercise (n= 6). Exercise intervention was performed using animal treadmill (Columbus-1012R-1-E58 modular enclosed metabolic treadmill with shock (7670R-E58 Oxymax Economy System). Rats were habituated for exercise using a low intensity exercise protocol (10 to 20 m/min for 10 min per day) for one week. The high-intensity exercise protocol involved treadmill running at the rate of 24m/min for 45 min/day for 2 weeks. After habituation rats were acclimated for 4 days before the energy expenditure (EE) measurements. Volume of O2, CO2, heat production and RER were estimated by Oxymax software for 4 rats in each group. The body weight, fat fraction (FF) from iBAT and EE were measured before and after 2 weeks of exercise intervention. In vivo imaging experiments were performed using a 7 T Bruker (ClinScan) scanner with motion compensation, using a 72mm volume resonator for RF transmission in combination with 20mm receive-only coil for signal reception. Dixon imaging was performed by using the parameters: FOV 55 x55 mm2, matrix size 256×256, in-plane resolution of 0.214μm x 0.214μm, slice thickness of 1mm, TR 8 ms, averages 1, flip angle 8°, echo bandwidths of 1090 Hz/pixel with out-of-phase (1.0ms) and in-phase (2.5ms) echo times. After terminal experiments tissues were fixed in 10 % neutral buffered solution for 24 hours. Hematoxylin and eosin/ UCP-1 antibody staining was performed on 5µm tissue section and stained images were captured at 20× optical magnification by using Aperio ScanScope instrument5.Results and Discussion
Figure 1A shows representative FF images of iBAT obtained from an exercise and sedentary trained animal. Figure 1B shows the FF values at baseline for all the animals, sedentary group and exercise group. FF in exercise group reduced significantly (P <0.01) compared to sedentary group. Figure 2A shows the volume of O2 consumption of control and exercise groups. The VO2 in exercise (4933.19±301.81 ml/kg/hr) group increased significantly (P <0.001) compared to baseline (2038.24±60.81 ml/kg/hr). Figure 2B shows significant increase CO2 (P <0.001) exhalation from exercise group compared to baseline. Figure 2C shows significant increase of RER (P <0.001) in exercise group compared to baseline. Figure 2D shows the heat value which was also significantly (P <0.001) increased in exercise group (4.85±0.29 kcal/hr) compared to the baseline (1.95±0.05 kcal/hr). Metabolic activity of BAT increases with activation by exercise by reduced fat fraction and increased RER. Figures 3A, B show representative H & E stained images from sedentary and exercising animals. The image from exercising animal shows reduction in size and “white” like droplets within iBAT which is in agreement with reduced FF. Figures 4 A, B show the UCP 1 antibody stained images from iBAT obtained from sedentary and exercise groups. The results are in agreement with the H &E images.Conclusion
Fat content in iBAT reduced significantly reduced with increased energy expenditure in intense exercise group. The H& E images and UCP 1 antibody stained images show reduction in “white” like lipid droplets and size.Acknowledgements
No acknowledgement found.References
(1)Geng et al., (2019), Cell Reports 26, 2738–2752 (2) Thompson, D., Karpe, F., Lafontan, M., and Frayn, K. (2012). Physiol. Rev. 92, 157–191. (3) Gorgens, S.W., Eckardt, K., Jensen, J., Drevon, C.A., and Eckel, J. (2015). Prog. Mol.Biol. Transl. Sci. 135, 313–336. (4). Gopalan V et.al, Sci Rep. 2016 May 20;6:26445. (5)Lim S et.al., Nat Protoc (2012)7(3):606–615.Figures
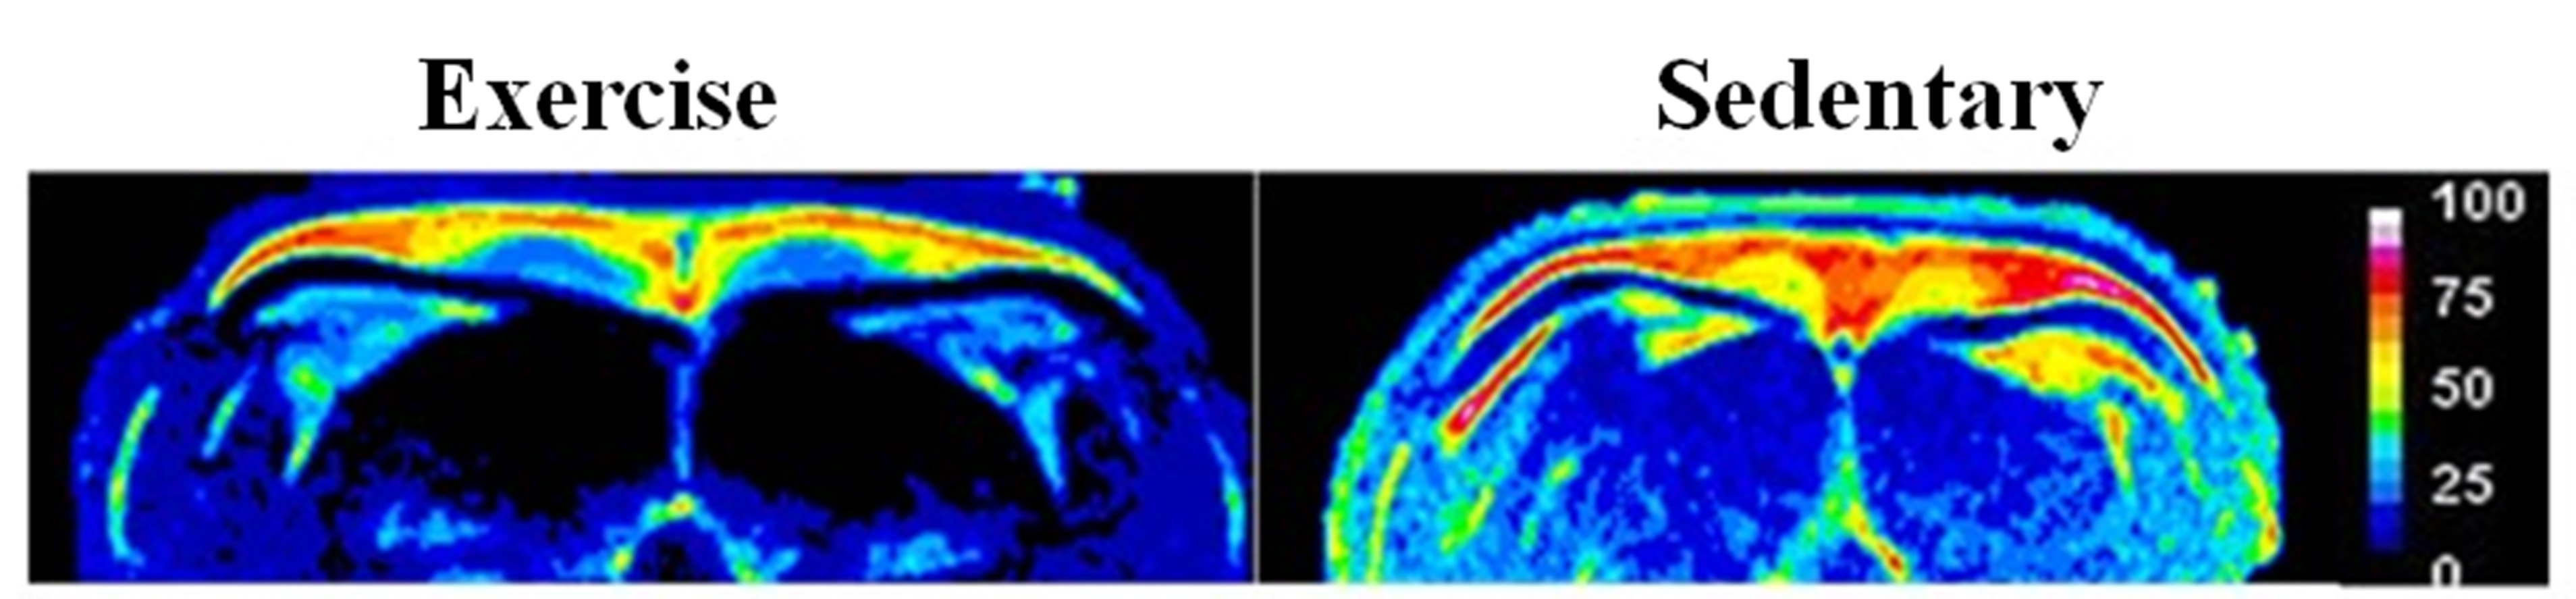
Figure 1A Representative FF images
from exercise and sedentary animal
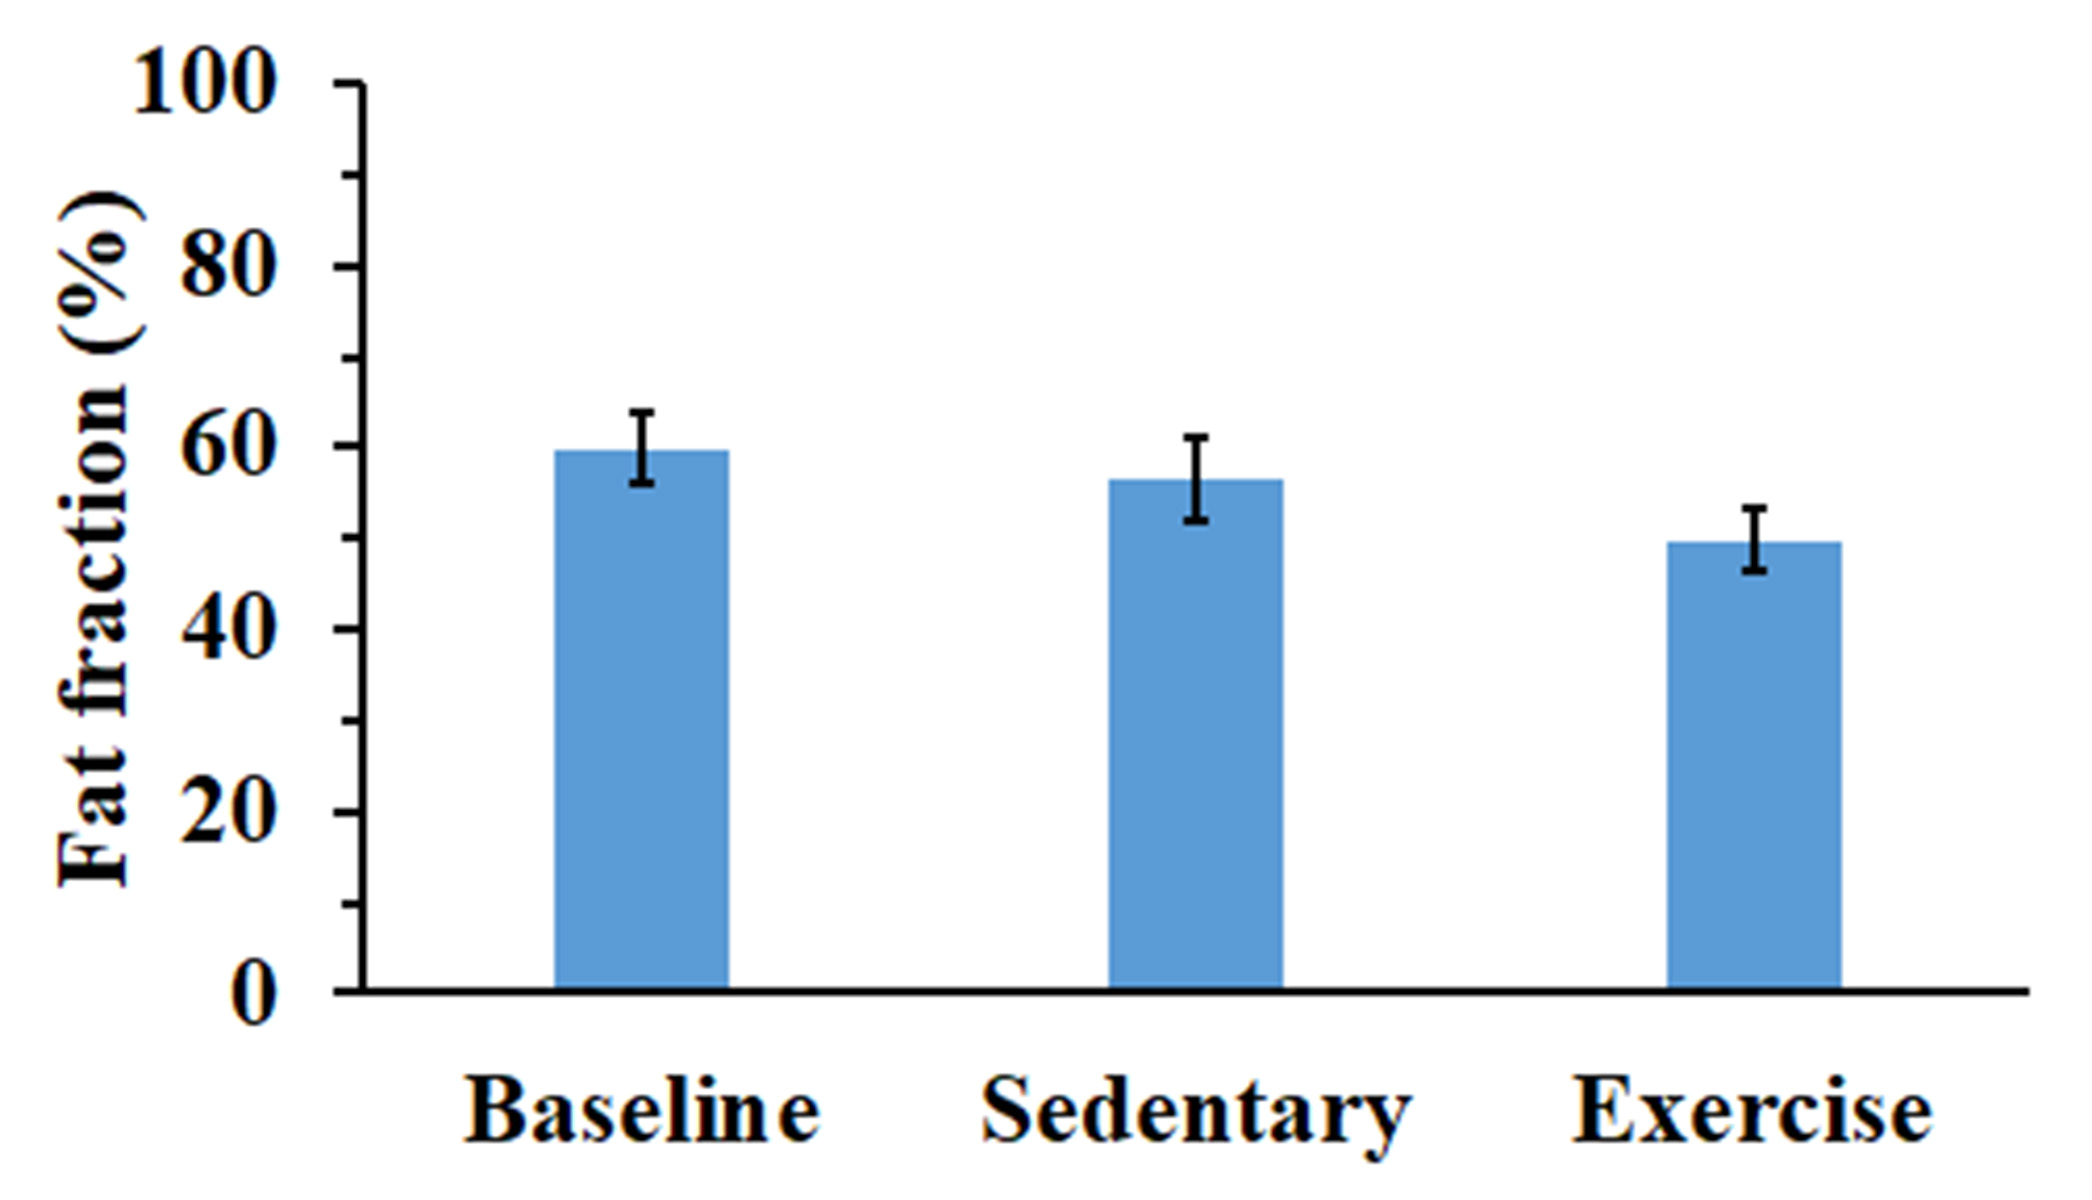
Figure 1B FF values at baseline and after two weeks
for sedentary group and exercise group
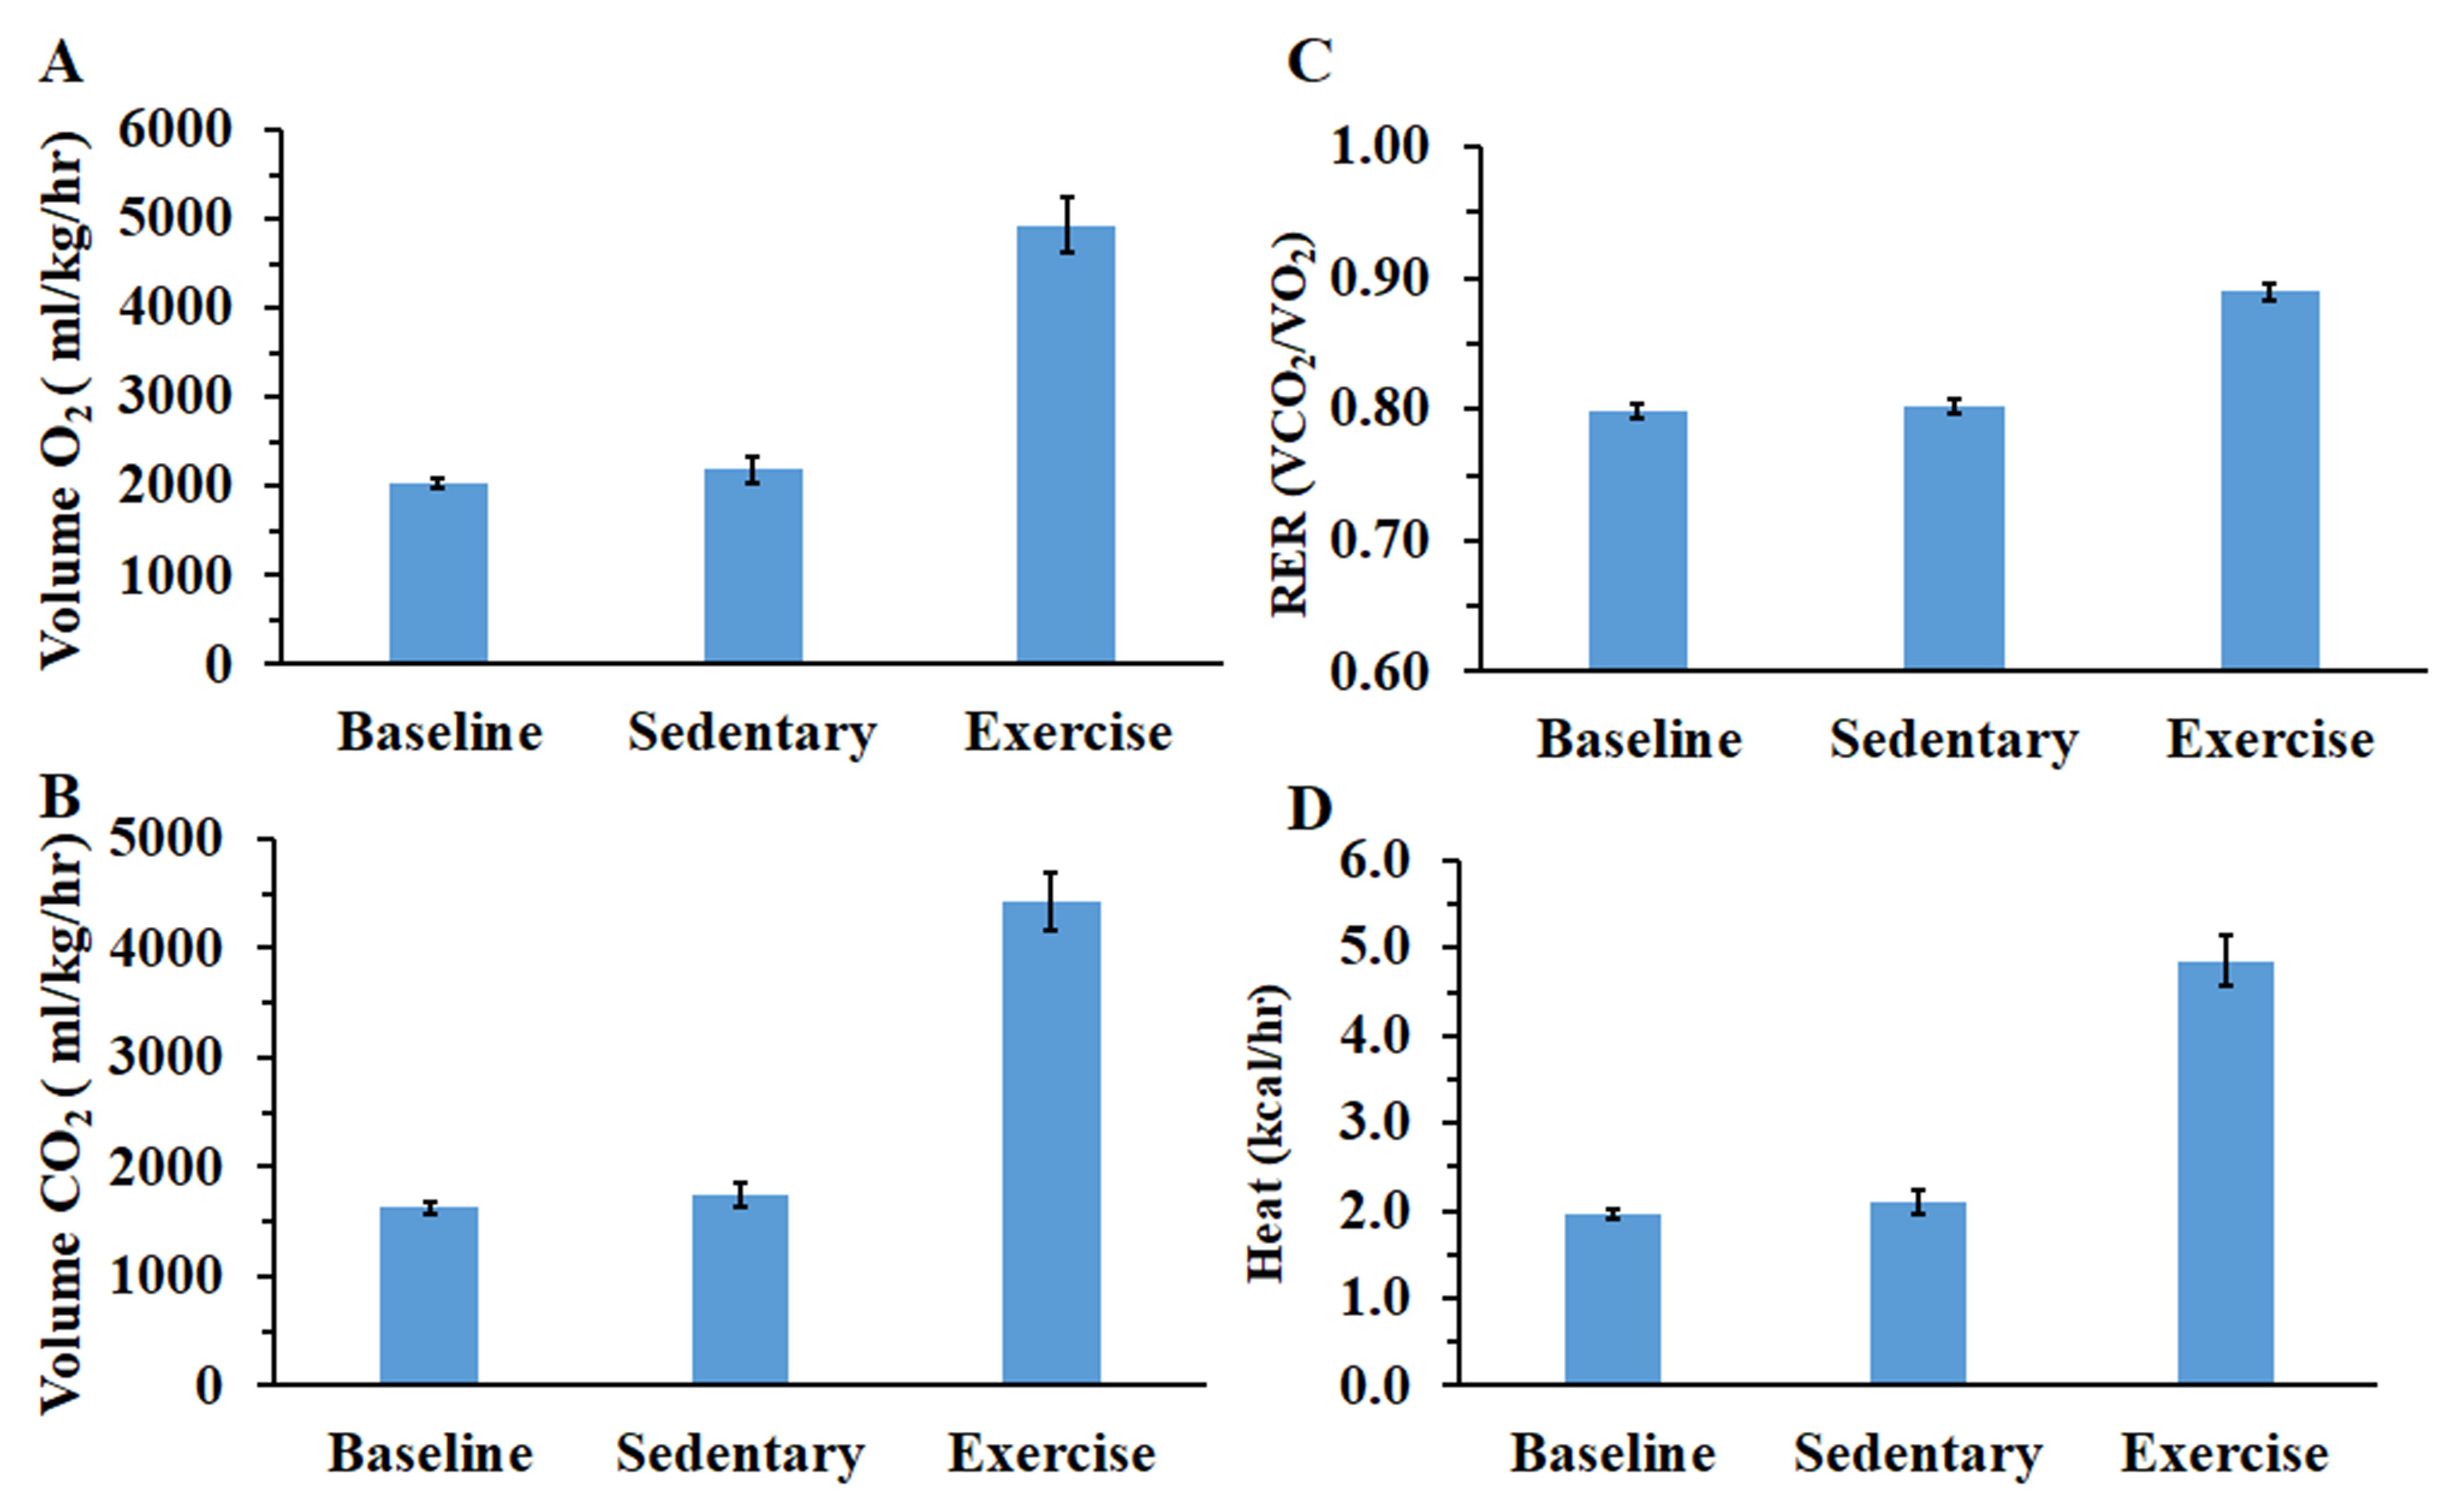
Figure 2A-D VO2, VCO2, RER and heat before
and after exercise intervention
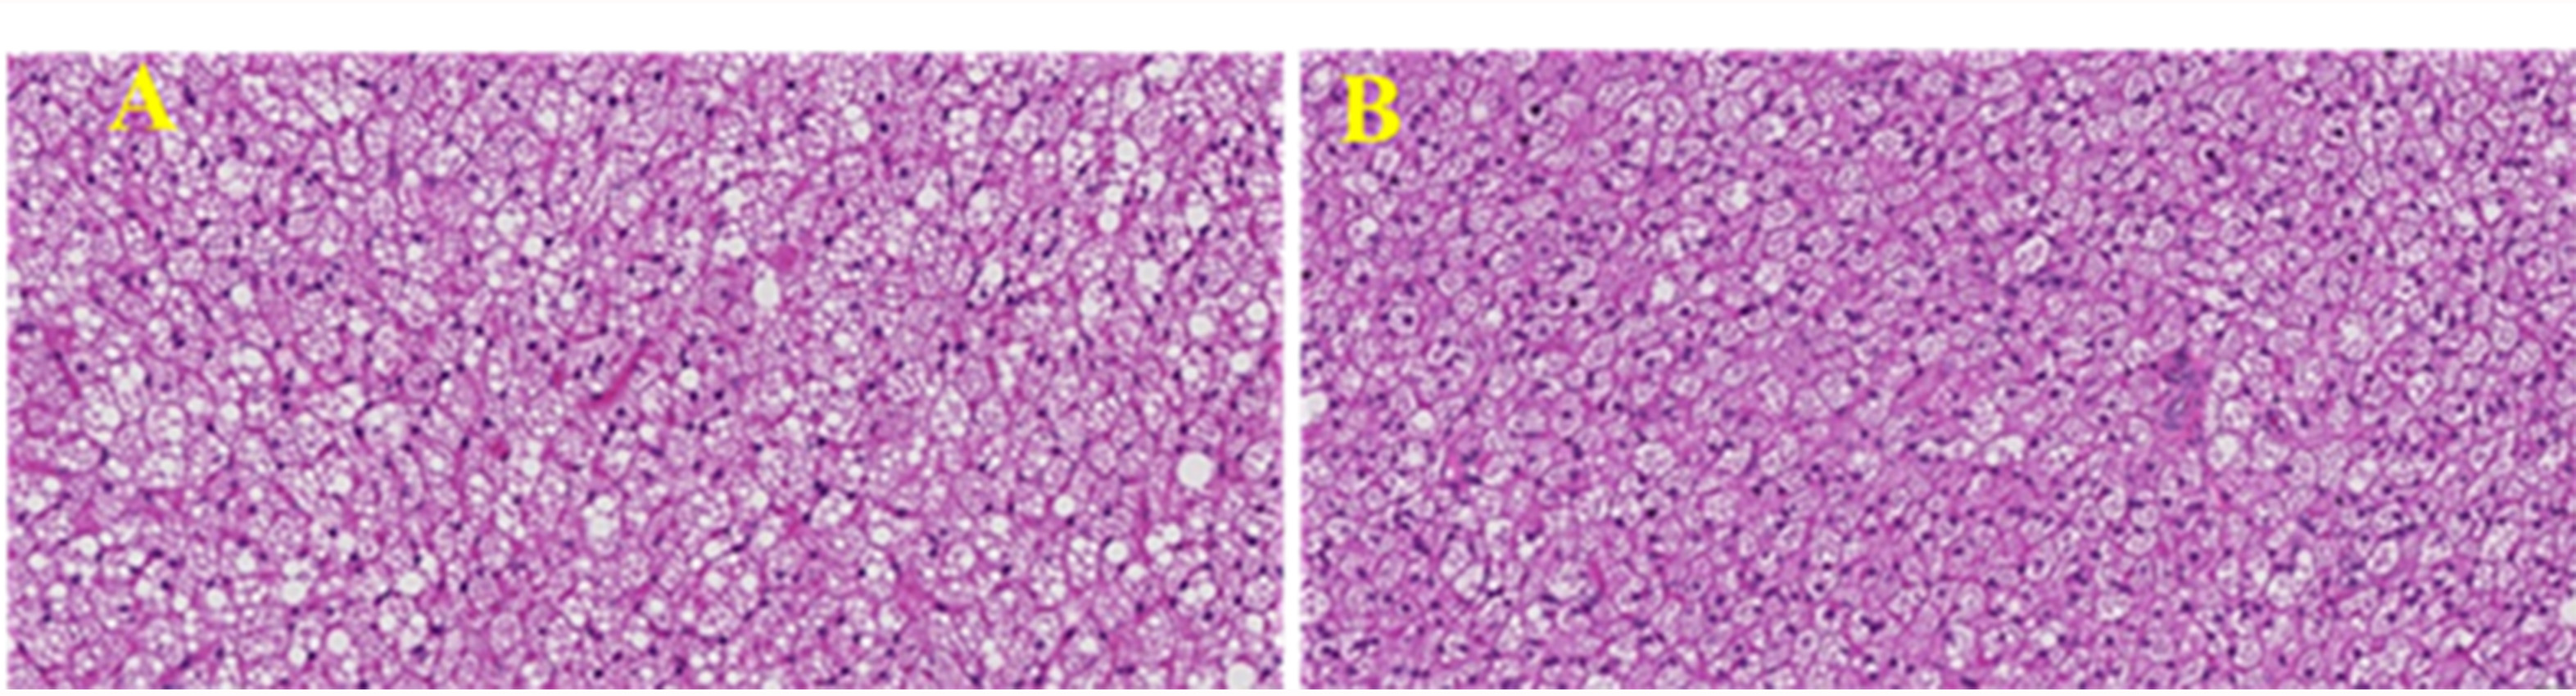
Figure 3A-B H & E stained
images of iBAT from sedentary and exercise group
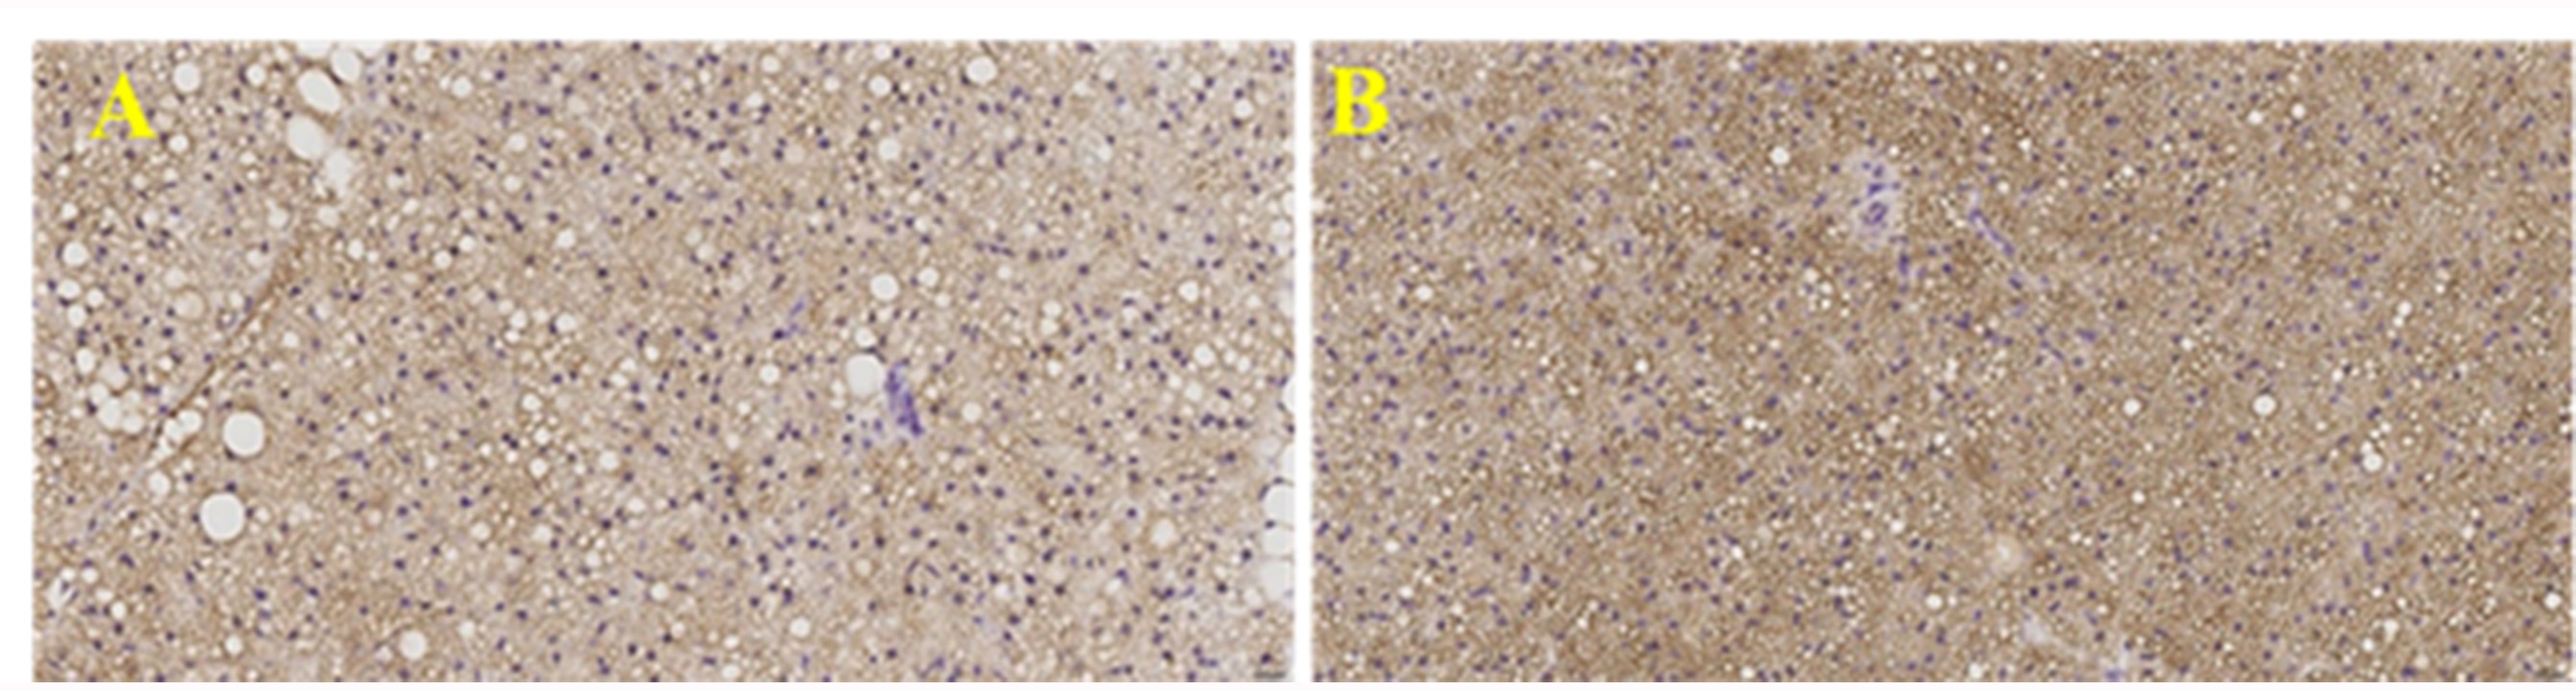
Figure 4A-B UCP1 antibody
stained images of iBAT from sedentary and exercise group