2554
Accumulation of saturated IMCL is associated with insulin resistance in both males and females1National Institute for Health Research Cambridge Clinical Research Facility, Cambridge University Hospitals NHS Foundation Trust, Cambridge, United Kingdom, 2Metabolic Research Laboratories, Wellcome Trust-MRC Institute of Metabolic Science, University of Cambridge, Cambridge, United Kingdom, 3Oxford Centre for Diabetes, Endocrinology and Metabolism (OCDEM), University of Oxford, Oxford, United Kingdom, 4Department of Clinical Research and Radiology, AMSM, University Bern, Bern, Switzerland, 5Department of Musculoskeletal Biology, and MRC-Arthritis Research UK Centre for Integrated research into Musculoskeletal Ageing (CIMA), University of Liverpool, Liverpool, United Kingdom, 6Wolfson Brain Imaging Centre, University of Cambridge, Cambridge, United Kingdom
Synopsis
In females the accumulation of saturated IMCL is more strongly associated with whole-body insulin resistance than IMCL concentration alone. Using a recently-validated 1H MRS approach we studied both the IMCL composition and concentration independent of composition in 30 control males, 41 age- and BMI-matched female controls and 16 female insulin resistant lipodystrophic subjects. We demonstrate that in both males and females markers reflecting the accumulation of saturated IMCL are more strongly associated with whole-body insulin sensitivity than IMCL concentration alone.
Introduction
In females the accumulation of saturated IMCL is more strongly associated with whole-body insulin resistance than IMCL concentration alone 1. Here we investigate whether age- and BMI-matched males differ from females in IMCL composition and concentration independent of composition, and whether they show similar associations with insulin resistance.Methods
30 male controls were age- and BMI- matched to 41 female controls and 16 female insulin-resistant subjects with lipodystrophy (LD). Control exclusion criteria included smoking, drug or alcohol addiction, any current or past medical disorder or medications that could affect measurements including supplements, and standard MR contraindications. Volunteers abstained from vigorous exercise for 19 h prior to measurement. We measured the recently-validated 2 short TE compositional saturation index (CH2:CH3 ratio) and concentration independent of composition (CH3) of IMCL in the soleus (SOL) and tibialis anterior (TA) muscles (Figure 1). The conventional ‘CH2’ that resonates at 1.3 ppm is influenced by composition, with a theoretical 100 % signal increase for 18:0 compared to 18:2.1H MRS was performed on a Siemens 3T scanner using PRESS with TE 35 ms 2. Data were analysed in jMRUI 3,4 and fitted by AMARES 5 using identical prior knowledge 1 (lipid Gaussian lineshapes, soft constraints on EMCL/IMCL CH2 frequencies and linewidths, CH3 frequencies and linewidths determined from prior knowledge relative to CH2 6, and all amplitudes estimated). IMCL CH2 and CH3 were quantified relative to creatine and then the calculated water signal (water-calc) 1. As lipid composition varies with concentration in female controls independent of insulin sensitivity 1, two measures of composition were used: the IMCL saturation index (CH2:CH3) reflects saturation of the total pool; the IMCL saturation index adjusted for quantity, a marker of accumulation of saturated IMCL, is calculated as (CH2:CH3adj) = CH2 – (mCH3 + c), where m and c are the regression slope and intercept of CH2 vs CH3 for the female controls.
Statistical analyses were performed in IBM SPSS Statistics 24 (IBM, Armonk, NY: IBM Corp.).
Results
Figure 2 shows the characteristics and muscle lipid measures of the male and female control groups. As expected the males had lower fat mass and higher fat-free mass and lower HDL-cholesterol than females, but similar insulin sensitivities. There were no statistically significant gender differences in IMCL measures, but males had tendencies short of statistical significance to higher soleus IMCL CH2:CH3adj (p=0.059), lower TA IMCL concentration (p=0.055) and higher IMCL CH2:CH3 (p=0.051) (Figures 2 & 3). EMCL was significantly reduced in the TA of males.Figure 4 shows the relationship of whole body insulin sensitivity and IMCL measures. Male controls showed similar and stronger associations with HOMA-IR compared with female controls, with significant correlations with SOL and TA CH2:CH3adj and TA CH2.
Figure 5A & B shows the saturation index adjusted for quantity against ln(HOMA-IR) in all controls and lipodystrophic subjects. [HDL-cholesterol] was negatively associated with both composition (CH2:CH3) and composition adjusted for quantity (CH2:CH3adj) in both muscles of female controls and lipodystrophics together (all p<0.001) and in female controls alone in the soleus and tibialis anterior (all p<0.05). There were no associations of IMCL measures with [HDL-cholesterol] in the control males.
Discussion
We investigated the IMCL composition and concentration independent of composition in 30 control males and compared these with 41 age- and BMI-matched female controls. We show that, in this cohort of males with similar insulin sensitivity to females, the IMCL measures were similar. The male tibialis anterior CH3 IMCL tended to be lower and the soleus composition adjusted for quantity (related to CH2) to be higher, which is in partial agreement with a large cohort study 7 of CH2 IMCL levels.The males demonstrated similar, and stronger, relations to whole body insulin sensitivity compared to the female controls, where the composition adjusted for quantity (CH2:CH3adj) and CH2 (TA) correlated with insulin sensitivity. This agrees with recent findings in a grouped analysis of females covering a wide range of insulin sensitivities 1 and reinforces the finding that markers reflecting the accumulation of saturated IMCL are more strongly associated with whole-body insulin sensitivity than IMCL concentration alone. Differences in associations of insulin resistance with IMCL concentration when using the CH3 and conventional CH2 peaks for quantification highlights the need for awareness of the potential influence of composition on previously-reported 1H MRS measures of concentration.
Conclusion
In both males and females the accumulation of saturated IMCL is more strongly associated with whole-body insulin resistance than IMCL concentration alone.Acknowledgements
We thank all the participants, staff at both the NIHR Cambridge Clinical Research Facility and the Wolfson Brain Imaging Centre. We acknowledge the NIHR Core Biochemistry Assay Laboratory, Cambridge Biomedical Research Centre, UK, for providing the insulin analysis. This research was supported by grants from the Clinical Research Infrastructure Grant, UK NIHR Cambridge Biomedical Research Centre, and the UK Medical Research Council Centre for Obesity and Related Metabolic Diseases.
References
1 Savage DB, Watson L, Carr K, et al. Accumulation of saturated intramyocellular lipid is associated with insulin resistance. J Lipid Res. May 2019:jlr.M091942.
2 Thankamony A, Kemp GJ, Koulman A, et al. Compositional marker in vivo reveals intramyocellular lipid turnover during fasting-induced lipolysis. Sci Rep. 2018;8(1):2750.
3 Naressi A, Couturier C, Devos JM, et al. Java-based graphical user interface for the MRUI quantitation package. Magma Magn Reson Mater Physics, Biol Med. 2001;12(2-3):141-152.
4 Stefan D, Cesare F Di, Andrasescu A, et al. Quantitation of magnetic resonance spectroscopy signals: the jMRUI software package. Meas Sci Technol. 2009;20(10):104035.
5 Vanhamme L, Van Den Boogaart A, Van Huffel S. Improved method for accurate and efficient quantification of MRS data with use of prior knowledge. J Magn Reson. 1997;129:35-43.
6 Boesch C, Machann J, Vermathen P, Schick F. Role of proton MR for the study of muscle lipid metabolism. NMR Biomed. 2006;19(7):968-988.
7 Thamer C, Machann J, Bachmann O, et al. Intramyocellular lipids: anthropometric determinants and relationships with maximal aerobic capacity and insulin sensitivity. J Clin Endocrinol Metab. 2003;88(4):1785-1791.
Figures

Figure 1. The ratio of CH2:CH3 is influenced primarily by the saturation of the fatty acids in triglyceride (TG). (A) Palmitoleic acid component of TG has a theoretical ratio of CH2 (at 1.3 ppm) to CH3 (at 0.9 ppm) of 16/3 = 5.3, lower than the equivalent ratio of palmitic acid = 8.0. The CH2:CH3 ratio is also scaled by chain length, but to smaller effect 2. (B) Theoretical CH2:CH3 values for stearic, oleic, and linoleic fatty acids (FA) and practical values 2. (C) Example soleus spectra and fit.
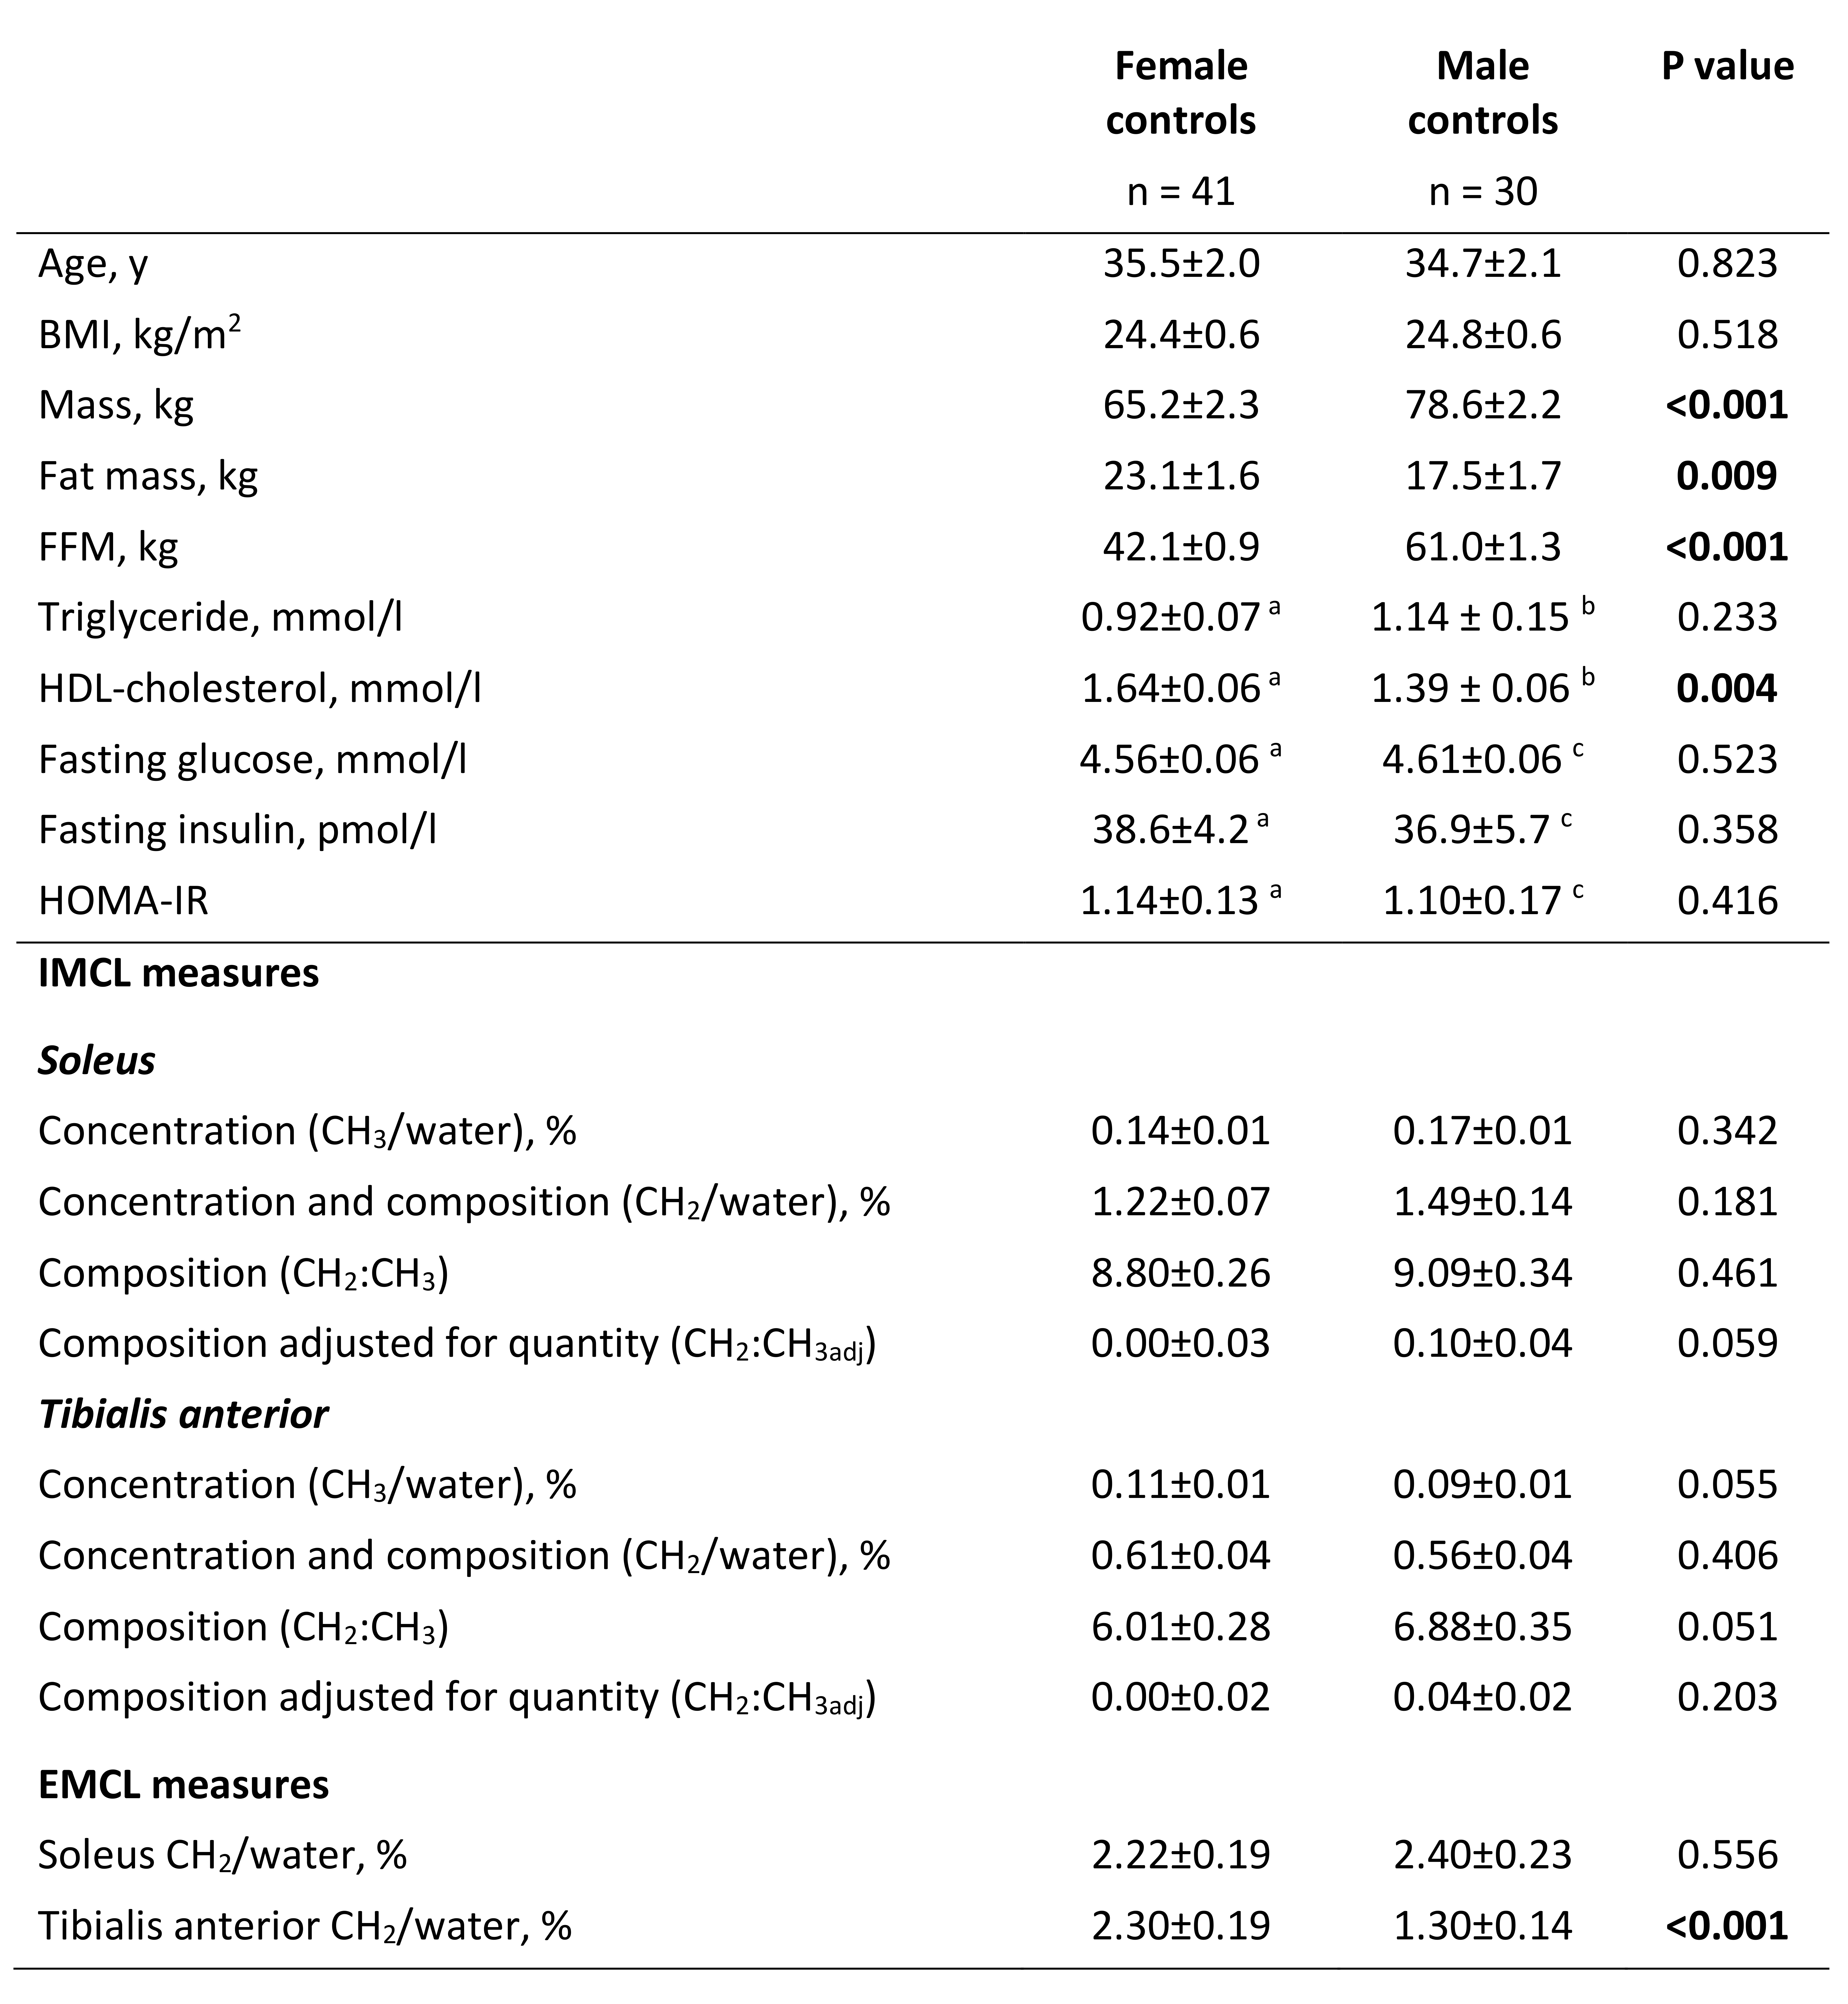
Figure 2. Participant characteristics and muscle lipid measurements. Non-normally distributed variables were log-transformed before independent-samples t-test. Bold P values are statistically significant. Data are mean ± SEM. FFM, fat free mass; HOMA-IR, Homeostasis Model Assessment of Insulin Resistance; IMCL, intramyocellular lipid; EMCL, extramyocellular lipid; CH3 and CH2, methyl and methylene protons resonating at 0.9 ppm and 1.3 ppm, quantified as % of uncorrected water resonance. a n = 38, b n = 29, c n = 27

Figure 3. Soleus (A) and tibialis anterior (B) IMCL CH2 (at 1.3 ppm) and CH3 (at 0.9 ppm) in both male and female controls. Dotted line = linear regression of female control points.

Figure 4. Correlation coefficients of whole-body insulin resistance with IMCL. Due to non-normality of ln(HOMA-IR), IMCL associations were assessed by Spearman’s rank correlation coefficient. HOMA-IR, Homeostasis Model Assessment of Insulin Resistance; F, female; M, male; LD, lipodystrophic subjects (female); IMCL, intramyocellular lipid; CH3, methyl protons resonating at 0.9 ppm; CH2, methylene protons resonating at 1.3 ppm; CH2:CH3, compositional saturation index; CH2:CH3adj, CH2:CH3 saturation index adjusted for lipid quantity. Tibialis anterior has a n = 50 b n = 77
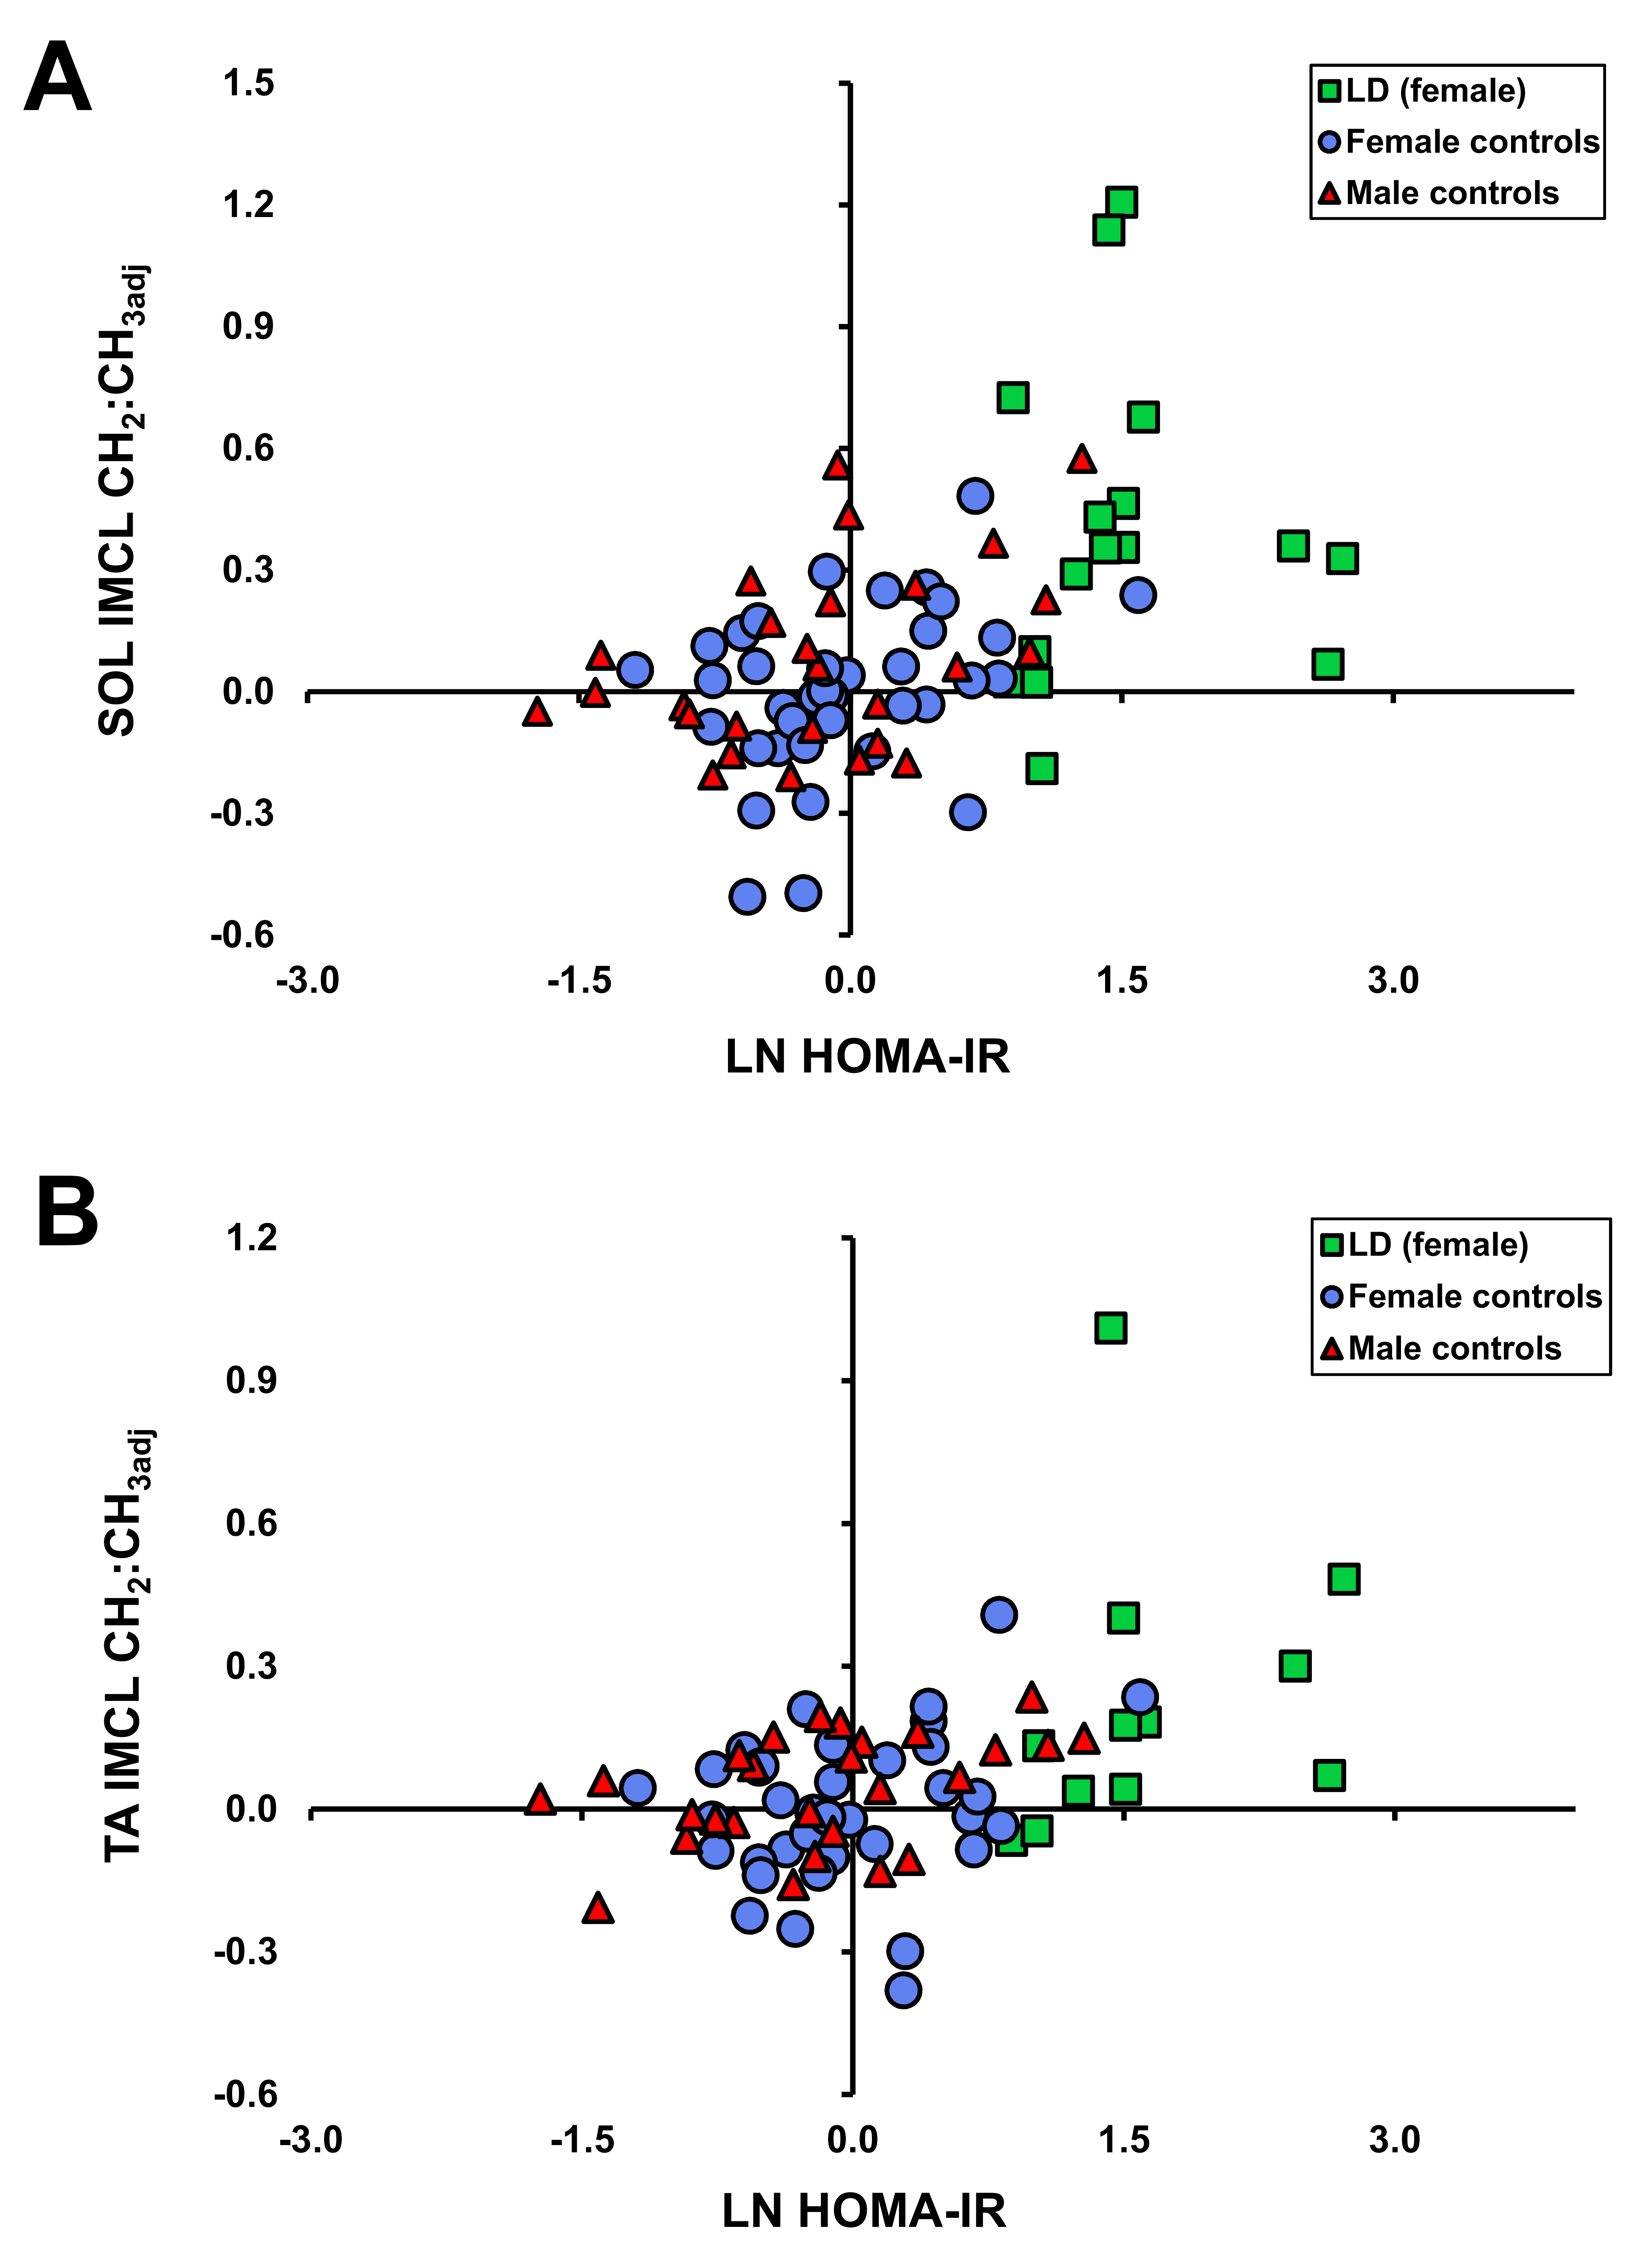
Figure 5. Relation of soleus (A) and tibialis anterior (B) IMCL compositional adjusted saturation index (CH2:CH3adj) with HOMA-IR in lipodystrophic (LD) subjects (green) and female and male controls (blue, red). HOMA-IR correlation coefficients are shown in Figure 4.