2553
Using 1H MRS to Investigate Hepatic Fat Fractions and Lipid Composition in NAFLD Patients with Type 2 Diabetes1NIHR Nottingham Biomedical Research Centre, University of Nottingham, Nottingham University Hospitals NHS Trust and the University of Nottingham, Nottingham, United Kingdom, 2Sir Peter Mansfield Imaging Centre, University of Nottingham, Nottingham, United Kingdom, 3School of Sport, Exercise and Health Sciences, Loughborough University, Loughborough, United Kingdom
Synopsis
1H MRS offers unique insights into hepatic lipid composition. In this study, NAFLD patients with and without Type 2 Diabetes were scanned and hepatic lipid composition indices measured. Diabetic patients then underwent a randomized controlled trial to investigate the effectiveness of 6 weeks moderate exercise vs control. Lipid composition indices were similar to previous studies in obesity, and show no differences in diabetic v non-diabetic groups. The intervention also shows no change in hepatic fat fraction or lipid composition.
INTRODUCTION
Ectopic lipid deposition in the liver leads to several poor health outcomes, and non-alcoholic fatty liver disease (NAFLD) is becoming an increasing global health burden along with other related metabolic disorders [1]. Whilst most research in this field has focused on the quantity of lipid accumulation, recent studies indicate that lipid composition also plays a key role [2].High resolution 1H MRS can be used to determine fat fractions within the liver, and also to evaluate indices of lipid composition and therefore provides a unique non-invasive method of evaluating the impact of lipid quality in these conditions [3].
The aim of this study was to compare lipid composition in NAFLD patients with and without Type 2 diabetes, and to evaluate the impact of regular moderate intensity exercise on these outcomes.
METHODS
This study involved a cross sectional comparison of Type 2 diabetic (NAFLD-D) vs non-diabetic (NAFLD-ND) patients and a subsequent randomized control trial investigating the effects of regular moderate intensity exercise in NAFLD-D. The study had local ethics approval and participants were recruited from GP practices and general advertising.Following an overnight fast, participants were scanned for hepatic fat fraction using 1H MRS and measurements of average blood glucose (HbA1c) and peak oxygen uptake were taken.
NAFLD-D participants were then randomized into either 6-weeks of exercise intervention (EX) or no intervention (CON). EX participants completed 4 exercise sessions per week, 3 of which were supervised by the research team. CON participants were asked to maintain their habitual lifestyle. At the end of 6 weeks all participants returned for post-intervention assessments (48 – 72 hours after final exercise session).
During test days participants were scanned on a Philips 3T Ingenia system. STEAM localised 1H MRS was acquired from a 20x20x20mm voxel in the lower right lobe of the liver. Spectra were acquired in a single breath hold (TR = 2000 ms, TE = 15, 30, 45 and 80 ms, 2 averages per spectra), with and without water suppression. To determine lipid composition, a high sensitivity 1H MRS was acquired over 6 breath holds (TR = 2000 ms, 5 averages per breathhold, 30 averages in total in total).
In-house software was written in Matlab to auto phase correct and frequency align spectra before averaging at each echo time. Peak amplitudes were fitted for each TE using prior knowledge [4] and the lscurvefit function (tolerances set according to [4]) and peak areas fitted to a monoexponential decay for water and fat T2. The final fat fraction was calculated as T2 corrected fat/(fat + water). The short TE multi-average data was used to identify individual lipid peaks and calculate lipid composition indices.
Saturated fat indices (SI), Unsaturated fat indices (UI) and Poly-Unsaturated fat indces (PUI) were calculated as previously described [3]. In addition, a short-chain fatty acid index (SCI) was developed by taking the ratio of signal from end (methyl) to mid chain hydrogens whilst also considering the number of carbons associated with each hydrogen as follows: [1/3 Methyl] / [1/3 Methyl + 1/2 (Methylene + β-Carboxyl + α-Olenfinic) + α-Carboxyl + Diacyl].
RESULTS
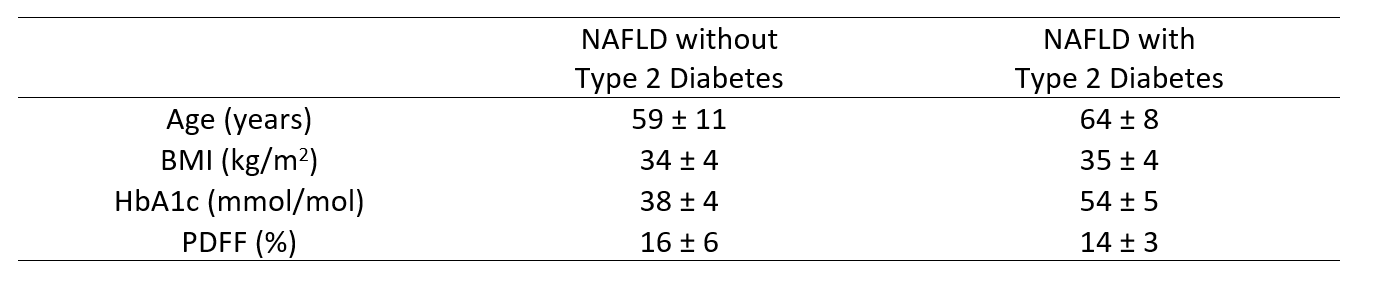
Any subjects with liver lipid values (PDFF) below 5.5% were excluded.16 NAFLD-ND and 9 NAFLD-ND have been recruited and completed a baseline scan so far (table 1). Acquired spectra has shown good SNR with high spectral resolution, allowing for good peak fitting of individual fat peaks (Figure 1). PDFF was 16 ± 6 % and 14 ± 1 % for NAFLD-ND and NAFLD-D groups respectively.
There are no significant differences between patient groups in SI (NAFLD-ND = 0.9 ± 0.04; NAFLD-D = 0.9 ± 0.05), UI (NAFLD-ND = 0.14 ± 0.04; NAFLD-D = 0.13 ± 0.05), PUI (NAFLD-ND = 0.03 ± 0.02; NAFLD-D = 0.03 ± 0.02) or SCI (NAFLD-ND = 0.10 ± 0.04; NAFLD-D = 0.08 ± 0.04) as shown in figure 2.
8 NAFLD-D participants have completed the 6 week intervention period so far. Interim (blinded) analysis shows that PDFF values have remained constant in both interventions (Group I: Visit 1 = 14 ± 2 %, Visit 2 = 14 ± 5 %; Group II: Visit 1 = 14 ± 3 %, Visit 2 = 14 ± 4 %). Similarly, there are no changes in SI, UI, PUI or SCI between visit 1 and visit 2 in either group.
DISCUSSION
1H MRS offers a unique insight into lipid composition and is more sensitive to fat fraction than other imaging techniques (e.g. Dixon imaging). Lipid composition indices from this study are similar to those found in obese subjects with and without NAFLD from previous studies [3], however there are no significant differences between NAFLD patients with and without Type 2 diabetes thus far, nor any effect of moderate exercise intervention in Type 2 diabetics (between group effects). Studies in this area are still novel and exploratory and further work should be done to establish the relevance of lipid composition in other fat stores for varying conditions and interventions.Acknowledgements
We are grateful to Diabetes UK for funding this studyReferences
1. Perumpail, B.J., et al., Clinical epidemiology and disease burden of nonalcoholic fatty liver disease. World Journal of Gastroenterology, 2017. 23(47): p. 8263-8276.
2. Erickson, M.L., et al., Non-invasive assessment of hepatic lipid subspecies matched with non-alcoholic fatty liver disease phenotype. Nutrition Metabolism and Cardiovascular Diseases, 2019. 29(11): p. 1197-1204.
3. Johnson, N.A., et al., Noninvasive assessment of hepatic lipid composition: Advancing understanding and management of fatty liver disorders. Hepatology, 2008. 47(5): p. 1513-1523.
4. Hamilton, G., et al., In vivo characterization of the liver fat H-1 MR spectrum. Nmr in Biomedicine, 2011. 24(7): p. 784-790.
Figures