2551
Investigation of Supraclavicular Brown Adipose Tissue in Hyperthyroid Patients using Simultaneous PET-MR Imaging
Sanjay K Verma1, Lijuan Sun2, Suresh Anand Sadananthan3, Navin Michael3, Hui Jen Goh2, Govindharajulu Priya2, Melvin Khee-Shing Leow2,4, and S Sendhil Velan1
1Singapore Bioimaging Consortium, Agency for Science Technology and Research (A*STAR), Singapore, Singapore, 2Clinical Nutrition Research Centre, Agency for Science, Technology and Research (A*STAR), Singapore, Singapore, 3Singapore Institute of Clinical Sciences, Agency for Science, Technology and Research (A*STAR), Singapore, Singapore, 4Department of Endocrinology, Tan Tock Seng Hospital, Singapore, Singapore
1Singapore Bioimaging Consortium, Agency for Science Technology and Research (A*STAR), Singapore, Singapore, 2Clinical Nutrition Research Centre, Agency for Science, Technology and Research (A*STAR), Singapore, Singapore, 3Singapore Institute of Clinical Sciences, Agency for Science, Technology and Research (A*STAR), Singapore, Singapore, 4Department of Endocrinology, Tan Tock Seng Hospital, Singapore, Singapore
Synopsis
BAT dissipates heat energy during adaptive thermogenesis regulated by several complex neuronal mechanisms including thyroid hormones. Twelve hyperthyroid subjects, treated with an anti-thyroid drug intervention were investigated using simultaneous PET-MR imaging. A significant increase in body weight and decrease in resting metabolic rate after treatment were observed. MR fat fraction significantly increased after treatment, whereas there is no significant change in PET-SUV. MR is more sensitive to the thyroid hormone induced changes, and can be utilized to study the BAT activity.
Introduction
Brown adipose tissue (BAT) is a highly innervated and richly vascularized thermogenic tissue with abundant mitochondria exhibiting an inverse relationship to obesity1. BAT dissipates heat energy during adaptive thermogenesis regulated by several complex neuronal mechanisms including thyroid hormones (TH)2. Hyperthyroid patients are characterized by increased metabolic activity, weight loss, heat intolerance, and sympathetic nervous system activation, resulting in tachycardia and tremors. The impact of hyperthyroidism on human BAT metabolism has been reported using PET-CT with contradicting results in hyperthyroid patients2, 3. The association of supraclavicular BAT (sBAT) and, serum-free T3 and T4 in subjects with low and normal BMI has been recently reported with MR fat fraction (FF)4. We investigated BAT metabolism in hyperthyroid patients treated with an anti-thyroid drug intervention using simultaneous PET-MR imaging.Methods
A total of 12 hyperthyroid subjects were recruited based on the clinical characteristics of hyperthyroidism. All the subjects had clinical symptoms of hyperthyroidism with increased serum-free T4 > 30 pmol/L associated with TSH levels of <0.05 mIU/L. Whole body energy expenditure (EE) was examined in a non-blinded crossover design in these subjects before and after treatment through gaseous exchanges using a dual-room whole body calorimeter (WBC)5. Subjects were treated with a 2-year course of carbimazole (CMZ) dose-titrated to target thyroid hormones to a euthyroid range, and were assessed at baseline (Visit 1) and six months later (Visit 2). Imaging experiments were performed using a hybrid 3T PET-MR (Biograph mMR; Siemens). The PET scans were acquired for 30 min after 40-45 min post intravenous injection of 3 mCi (111 MBq) of 18-fluorodeoxyglucose (18F-FDG) administered through an intravenous cannula in a vein. 3-dimensional T1-weighted anatomical images were acquired using TR = 15 ms; TE = 2.46 ms; FOV, 384 mm × 288 mm; matrix size 384 × 192. A 3D multi-point VIBE Dixon unipolar sequence was utilized for acquiring the water and fat images with the following parameters: TR 15 ms; six echoes time, 1.1, 2.61, 4.11, 5.61, 7.11 and 8.61 ms; FA, 3°; FOV, 384 mm × 288 mm; matrix size 192 × 144; 96 slices with 2 mm thickness. FF was obtained by fitting the multi-echo data to a 6-peak fat model using ISMRM Fat Water Toolbox6, 7. An affine based registration was used to register FF and PET images. The background subtraction algorithm followed by the percentile-based automatic thresholding method was applied to exclude the unwanted region8. sBAT was manually segmented from PET and MR images based on anatomical information in multiple slice images using ITK-SNAP9. A lower threshold of 40% of FF values was used to exclude the muscle and bone marrow5, 10. Statistical analysis (paired samples statistics and correlations) was performed in SPSS software version 23 (IBM SPSS Inc.).Results
A significant increase in body weight after treatment (before: 54.13 ±13.01; after: 56.54 ± 14.05 kg; P<0.001) was observed. Resting metabolic rate (RMR) significantly decreased after the treatment (before: 1698.1 ± 443.5; after: 1368.16 ± 278.60 kcal/day; P<0.001). Figure 1 shows representative images of T1 (a), FF (b) and PET (c) before (top) and after treatment (bottom). The PET images shown came from a subject where the 18F-FDG uptake was seen at baseline. There were subjects with no 18F-FDG uptake before and after the intervention. Figure 2 shows the mean and median values of FF and SUV for both visits. The mean (median) FF shows a significant increase after treatment (before: 72.54 ±6.07 (74.83±7.70); after: 76.11 ± 5.88 (78.99±7.30); P<0.001). We also observe an increase in SUV before the treatment compared to post-intervention but this was not significant. Figure 3 shows the histogram of FF and SUV of the manually segmented voxels. The total number of voxels with lower FF was greater at the first visit of the hyperthyroid subjects compared to the follow-up visit after having received 6 months of intervention. The number of voxels with higher FF increased at Visit 2. Increased number of voxels with higher SUV was observed in hyperthyroid patients in the Visit 1 compared to Visit 2.Discussion and Conclusions
Several imaging studies have been reported on the TH levels and BAT metabolism using PET-CT. PET uptake is inconsistent with different levels of TH3. We employed simultaneous PET-MR to study the BAT metabolism in twelve hyperthyroid subjects treated with a thionamide anti-thyroid drug. We observed that FF is significantly increased after treatment initiation whereas there is no significant change in SUV. In conclusion, MR is more sensitive to the TH-induced changes and can be utilized to study the BAT activity in hyperthyroid subjects.Acknowledgements
The study was funded by the Singapore Ministry of Health’s National Medical Research Council (NMRC) Clinician Scientist Award (grant ID NMRC/CSA-INV/003/2015).References
- Cypess A, Lehman S, Williams G, et al. Identification and Importance of Brown Adipose Tissue in Adult Humans. The New England Journal of Medicine 360, 15 (2009), 1509–1517.
- Lahesmaa M, Orava J, Schalin-Jäntti C, et al. Hyperthyroidism increases brown fat metabolism in humans.The Journal of clinical endocrinology and metabolism 99, 1 (2013), E28–35.
- Nishii R, Nagamachi S, Mizutani Y, et al. Do TSH, FT3, and FT4 Impact BAT Visualization of Clinical FDG-PET/CT Images? Contrast Media & Molecular Imaging 2018, (2018), 1–9.
- Franz D, Weidlich D, Syväri J, et al. The presence of brown adipose tissue is associated with thyroid function in subjects with low and normal BMI. Proc. Intl. Soc. Mag. Reson. Med. 26 (2018).
- Sun L, Verma S, Michael N, et al. Brown Adipose Tissue: Multimodality Evaluation by PET, MRI, Infrared Thermography, and Whole‐Body Calorimetry (TACTICAL‐II).Obesity 27, 9 (2019), 1434–1442.
- Hernando D, Kellman P, Haldar JP, et al. Robust water/fat separation in the presence of large field inhomogeneities using a graph cut algorithm. Magnetic Resonance in Medicine 63, 1 (2010), 79–90.
- Hu H, Börnert P, Hernando D, et al. ISMRM workshop on fat–water separation: Insights, applications and progress in MRI.Magnetic Resonance in Medicine 68, 2 (2012), 378–388.
- Schneider C, Rasband W, and Eliceiri K. NIH Image to ImageJ: 25 years of image analysis. Nature Methods 9, 7 (2012), 671.
- Yushkevich P, Piven J, Hazlett H, et al. User-guided 3D active contour segmentation of anatomical structures: Significantly improved efficiency and reliability. NeuroImage 31, 3 (2006), 1116–1128.
- McCallister A, Zhang L, Burant A, et al. A pilot study on the correlation between fat fraction values and glucose uptake values in supraclavicular fat by simultaneous PET/MRI. Magnetic Resonance in Medicine 78, 5 (2017), 1922–1932.
Figures
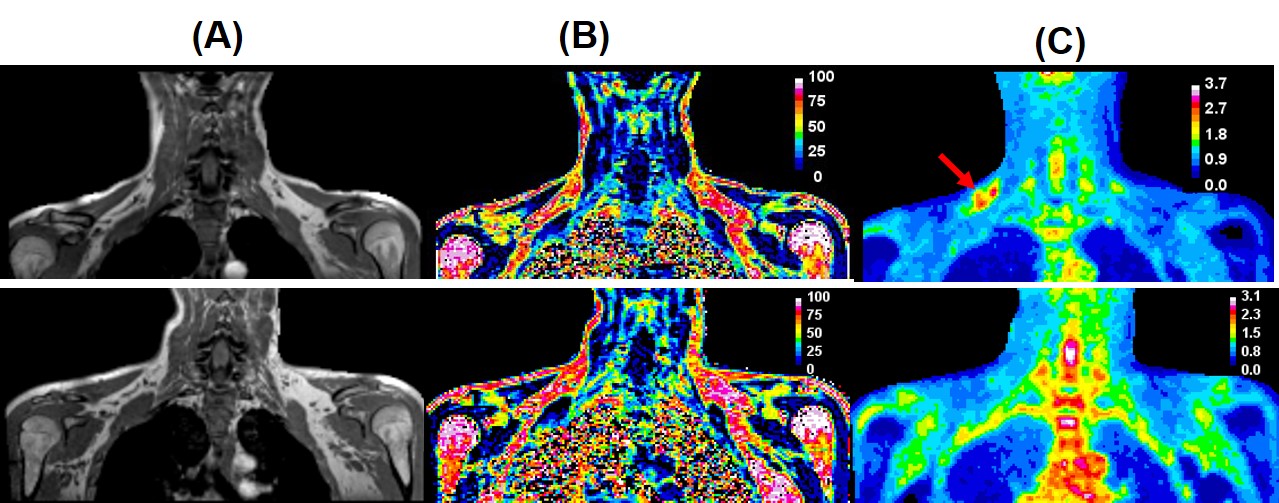
Figure 1. Representative
images obtained before (top) and after
(bottom) treatment. (A) T1-weighted
anatomical image, (B) fat fraction map (colour scale shows values of FF in %)
(C) 18F FDG-PET map with colour scale showing SUV values. The
arrow shows the glucose uptake on sBAT region.
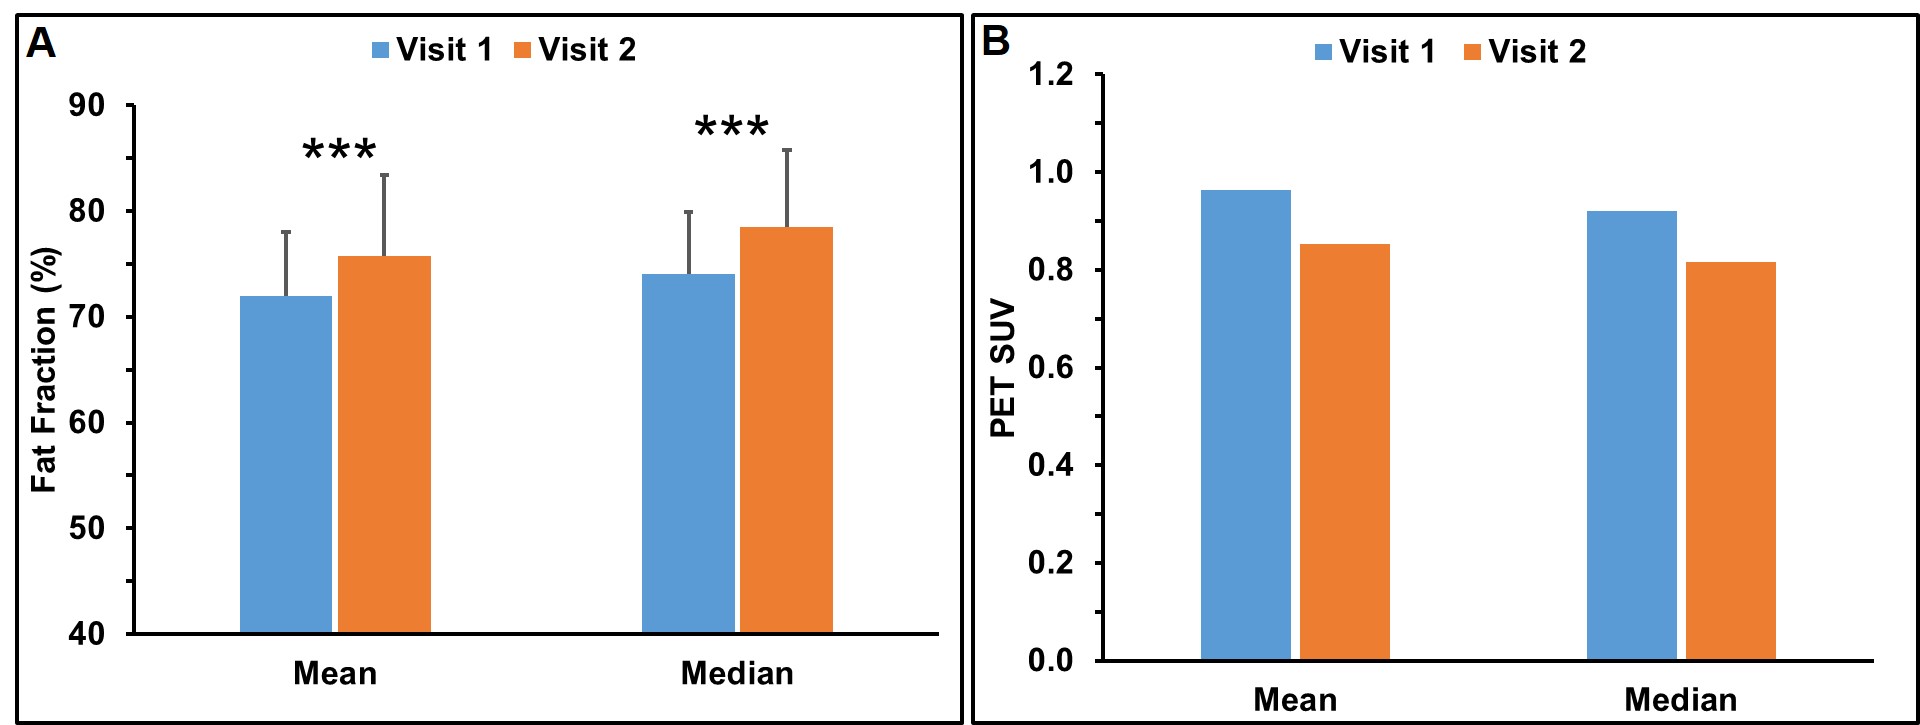
Figure 2. Mean and median FF (A) and SUV (B) values at baseline (Visit 1)
and after treatment (Visit 2).
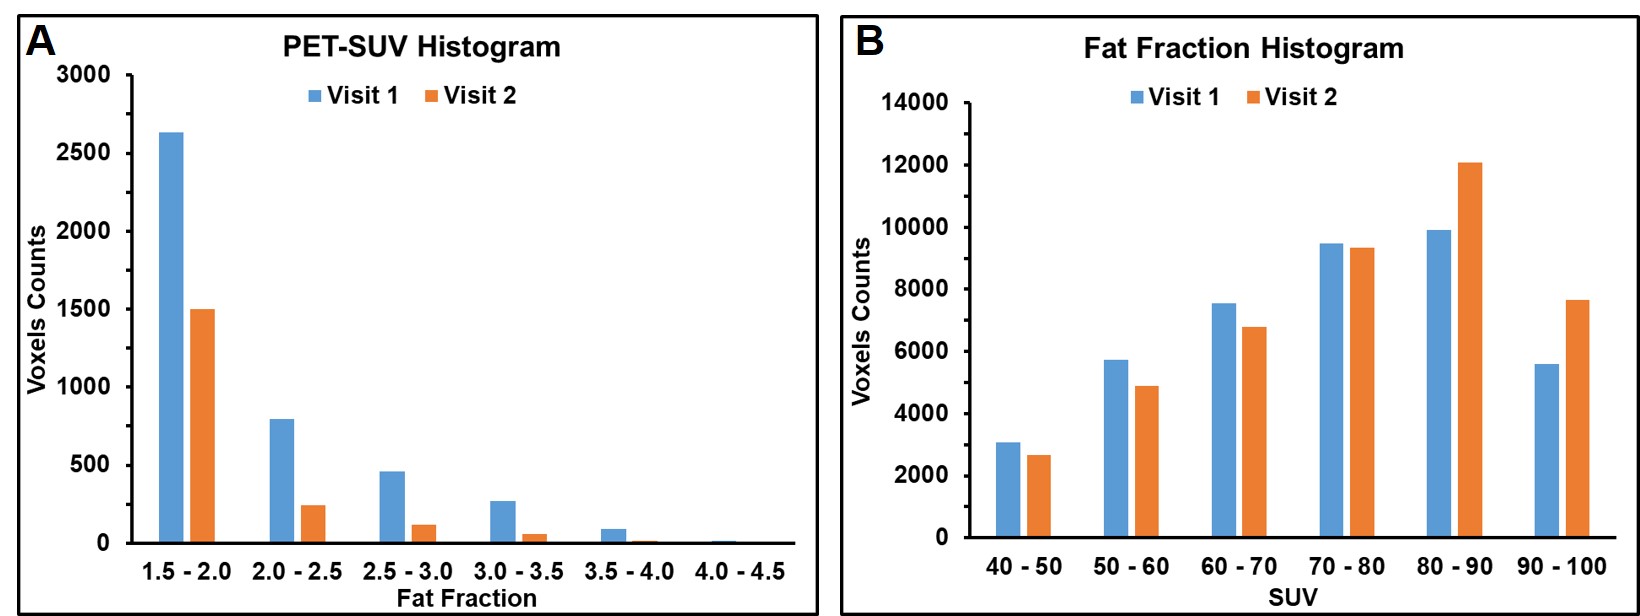
Figure 3. Histogram of the FF (A) and SUV (B) at baseline (Visit
1) and after treatment (Visit 2). Fat fraction (≥40) and SUV values (≥1.5)
threshold were used to count the voxels in segmented sBAT region.