2550
Hemodynamics Comparison Between Type2 Diabetes Mellitus Patients and Healthy Controls Using 4D Flow MRI1Center for Biomedical Imaging Research, Department of Biomedical Engineering, Tsinghua University, Beijing, China, 2Zhong Da Hospital Southeast University, Nanjing, China
Synopsis
Type2 Diabetes Mellitus (T2DM) is a metabolic disease with high morbidity. 4D Flow MRI is an advanced technique which could provide visualization and quantification of blood flow. In the study, we identified the reproducibility of the processing and measuring procedure of abdominal 4D Flow data and discovered the significant hemodynamic differences in the affected vessels between T2DM patients and controls using 4D Flow MRI. The differences indicated the systematic hemodynamic changes caused by the disease and hinted 4D Flow MRI could offer more help in the evaluation and better understanding of the disease.
Introduction
Diabetes is a series of metabolic diseases characterized by an abnormally high level of blood glucose1. Type 2 diabetes mellitus (T2DM) is a chronic disease with high morbidity and account for over 90% of the diabetes cases2. While T2DM is hard to be detected in the early stage, it could generate severe complications in late stages3. However, the hemodynamic condition of some affected vessels (renal arteries (LRA/RRA), splenic artery (SA) and coeliac trunk (CT)) in T2DM patients could change in the early stage4. 4D Flow MRI is a time-resolved, 3-dimensionally, 3-directionally velocity-encoded MR imaging technique and is able to visualize the blood flow and measure important hemodynamic parameters. In the study, we aim to identify the reproducibility of blood flow quantification offered by abdominal 4D Flow MRI and utilize it to explore the differences of hemodynamics between T2DM patients and healthy controls.Materials and Methods
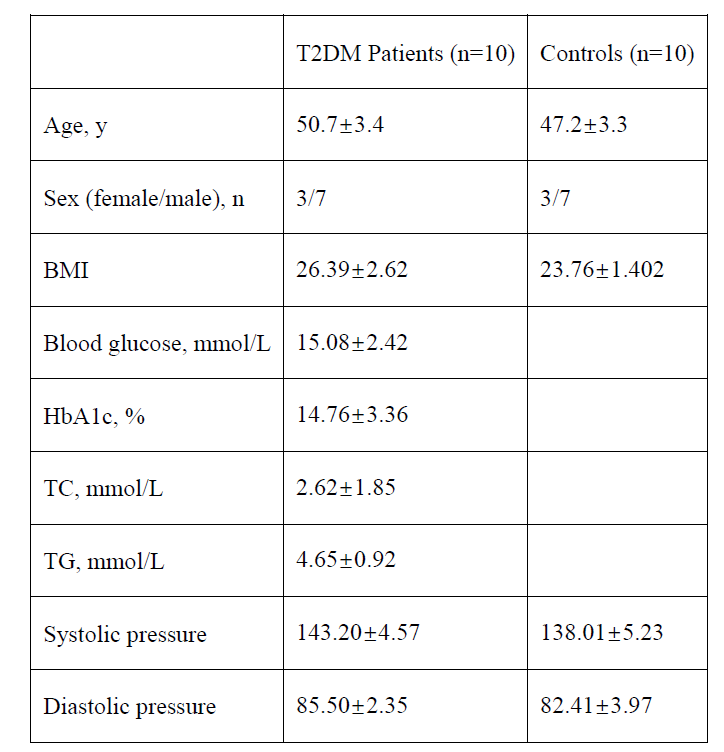
Subjects and ExaminationsA total of 10 patients were included in the study. All of them were diagnosed with T2DM and underwent abdominal 4D Flow MRI examination. The Venc was set to 50/75/150 (RL/AP/FH) cm/s. And the free-breathing, peripheral pulse-gated scan could last for about 6 minutes with a SENSE (P, 1.5) acceleration. Additionally, 10 healthy controls with no history of diabetes were recruited and underwent the same 4D Flow examination as the patients. The 2 groups have matched sex and age.
Image Analysis
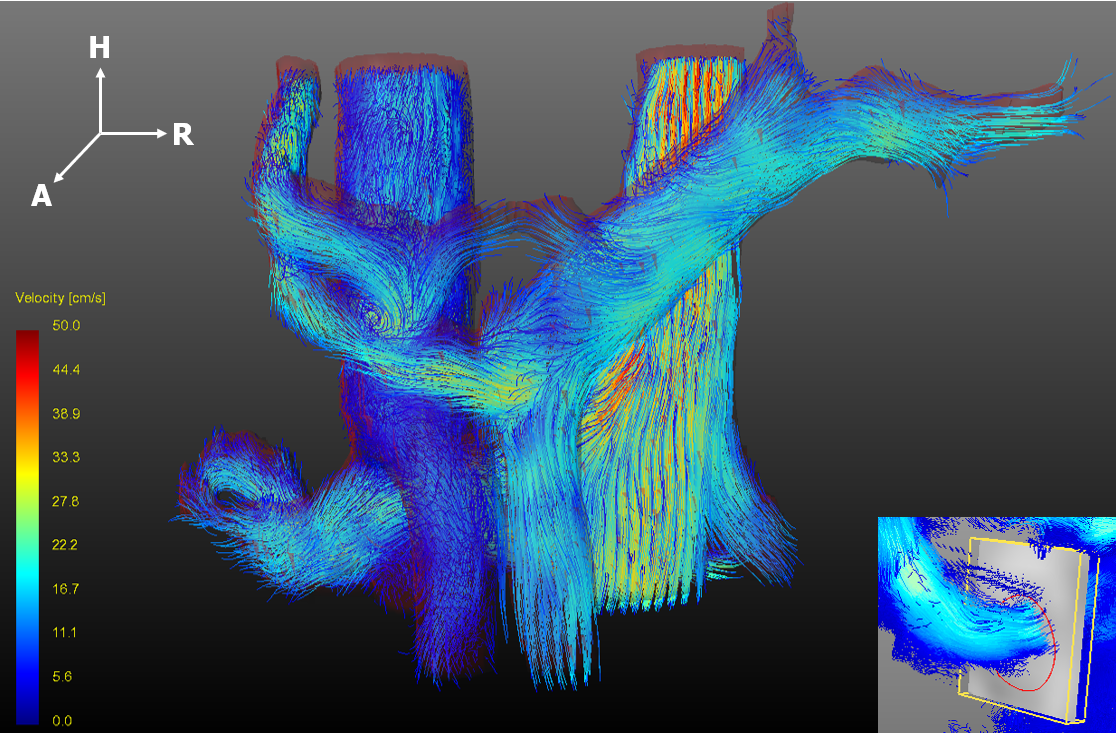
All preprocessing, visualization, and quantification of 4D Flow MRI data were performed with GTFlow (Gyrotools, Zurich, Switzerland). The preprocessing steps included eddy current correction, velocity aliasing correction and velocity masks application. Pathlines and streamlines were calculated for the visualization of the blood flow. 4 arteries (LRA, RRA, SA and CT) introduced earlier were selected for the following analysis. For the quantification of the hemodynamics, a plane was created perpendicular to the blood flow inside the target artery. Then a contour was created manually to cover all the blood flow in the vessel and hemodynamic parameters could be calculated according to the flow information inside the contour. The following parameters were calculated for the statistical analysis: 1) Flownet: the net volume of the flow through the contour in one cardiac cycle, 2) Vavg: the average velocity of the flow in the contour, and 3) Vmax: the maximum velocity of the flow. The data from 5 randomly chosen volunteers were calculated twice by one experienced observer and also respectively calculated by two experienced observers to test the intra/inter-observer reproducibility.
Statistical Analysis
The intra/inter-observer reproducibility of the hemodynamic parameters were evaluated by intra-class correlation coefficient (ICC) and Bland-Altman statistics. Independent Student t-test was operated to determine the difference of the hemodynamic parameters between T2DM patients and controls. All the statistical analysis was operated by Medcalc (MedCalc Software, Mariakerke, Belgium) and the level of statistical significance was set at p-value < 0.05.
Results
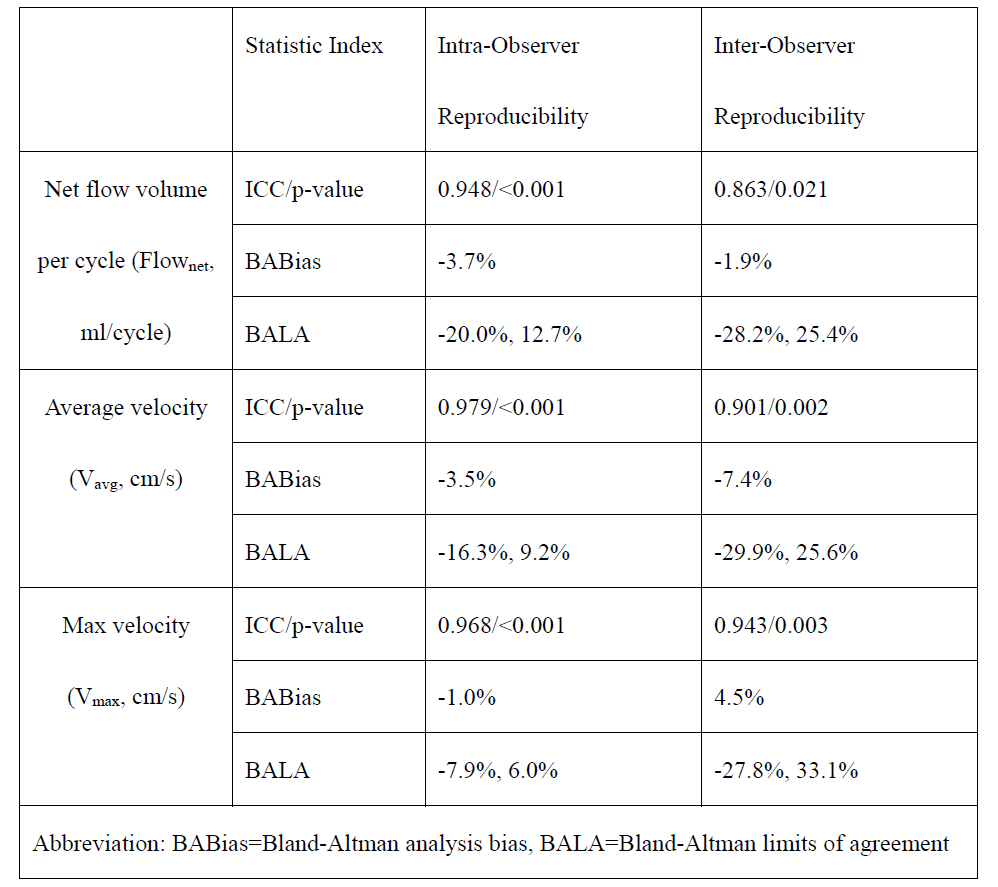
ReproducibilityFor all the hemodynamic parameters calculated from the 4D Flow data, the statistics showed great intra-observer reproducibility (ICC=0.948/0.979/0.968, Bland-Altman bias=-3.7%/-3.5%/-1.0%) and inter-observer reproducibility (ICC=0.863/0.901/0.943, Bland-Altman bias=-1.9%/-7.4%/4.5%), as shown in Table 2.
Difference Between T2DM Patients and Controls
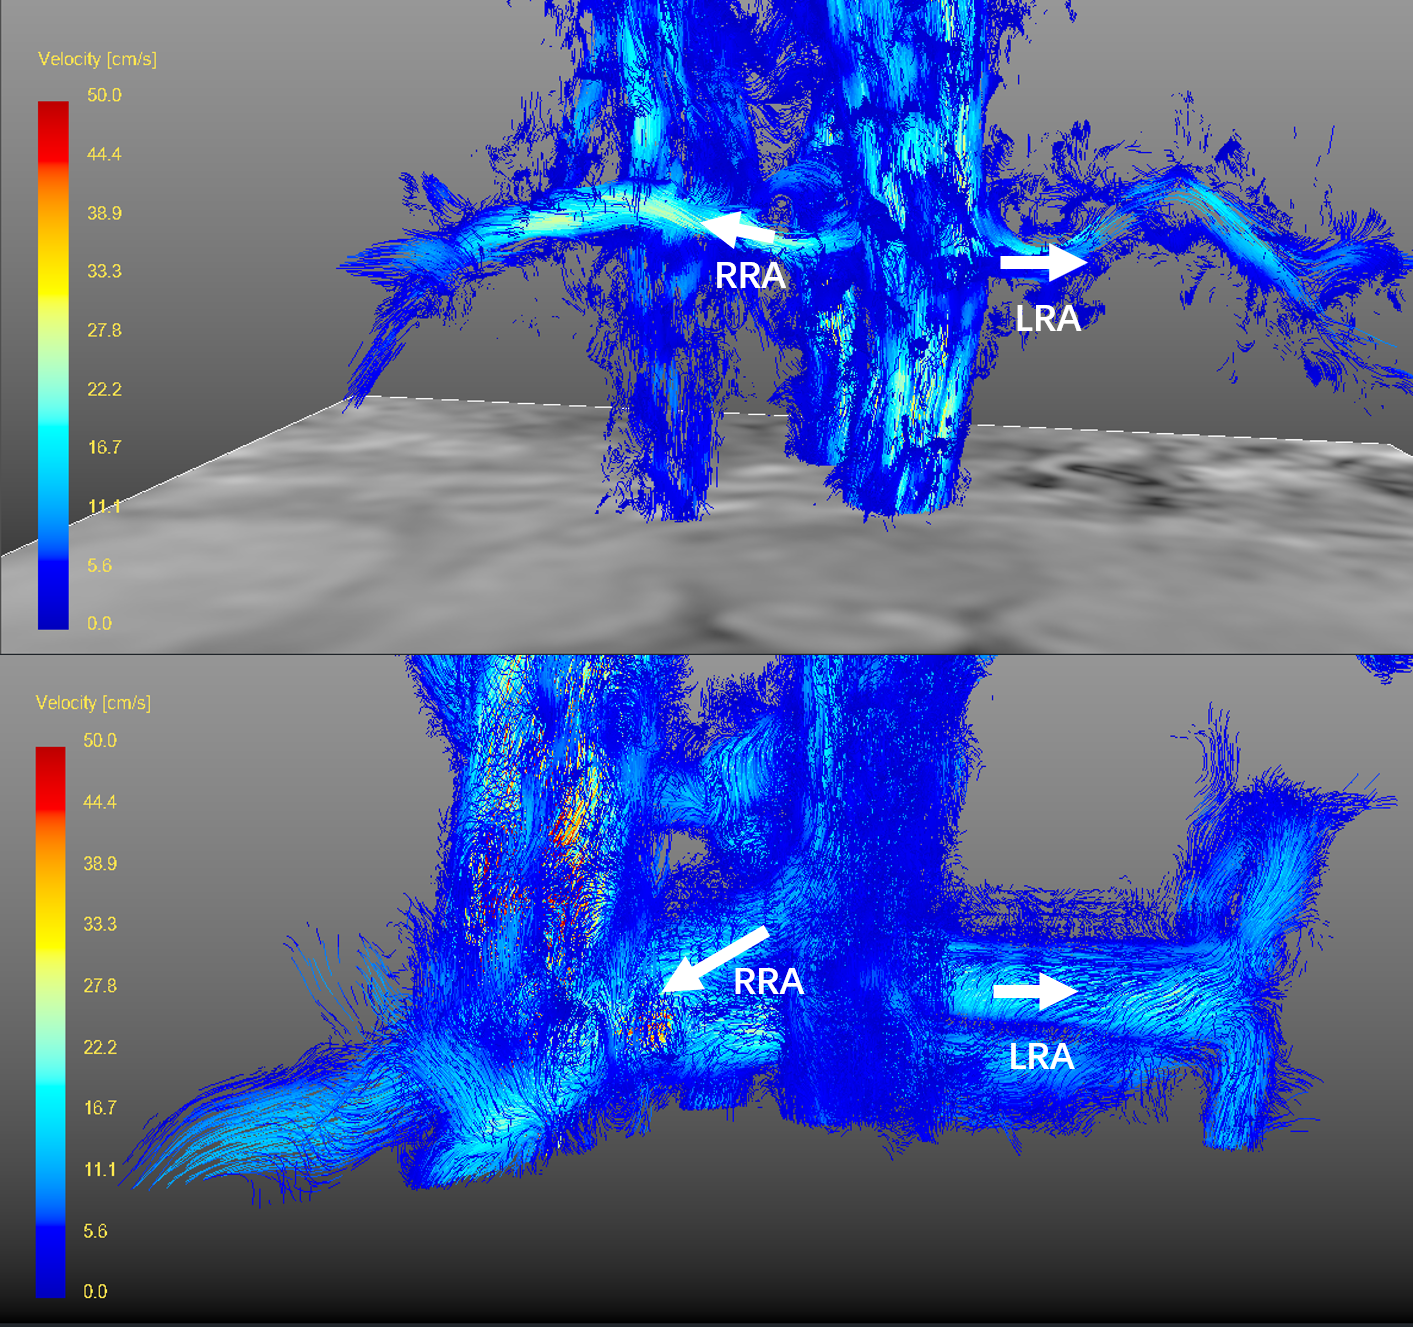
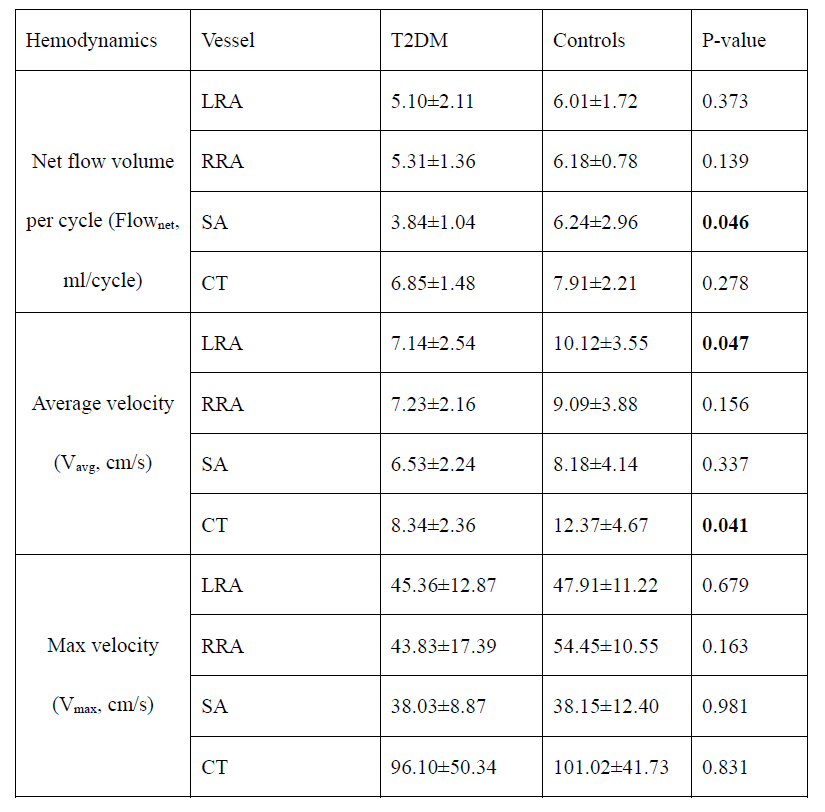
According to the statistical results displayed in Table 3, T2DM patients have significantly lower Flownet in SA (3.84±1.04ml vs. 6.24±2.96ml, p=0.046), and significantly lower Vavg in LRA (7.14±2.54cm/s vs. 10.12±3.55cm/s, p=0.047) and CT (8.34±2.36cm/s vs. 12.37±4.67cm/s, p=0.041).In addition, the visualization of the blood flow offered extra information. Some of the T2DM patients have obviously more blood flow in one side of the renal artery than another side while the controls’ blood in renal arteries looked much balanced, as displayed in Figure 2. Due to the possible existence of the unbalanced blood supply, it is reasonable to choose the renal artery with less blood flow to reveal the condition of both renal arteries. In this way, we detected significantly less blood flow in T2DM patients than controls (3.98±1.37ml vs. 5.69±1.53ml, p=0.044).
Discussion
According to the results, we observed excellent intra-observer reproducibility of the procedure, indicating the reliability of the processing and measuring steps. Also, the individual error could be excluded due to the great inter-observer reproducibility. In our study, the results indicated lower blood flow volume in SA and lower blood flow velocity in LRA and CT for T2DM patients. The phenomenon revealed the hemodynamic condition changes in the affected arteries due to the disease. The probable reason for the phenomenon is the increase of the viscosity of the blood due to the high level of the blood glucose and the potential vessel wall burden due to the unhealthy blood environment. The unbalanced blood flow in the renal arteries of the patients indicated the function loss might begin from single side of the kidney. However, most of the hemodynamic parameters for T2DM patients appeared to be at a lower level than controls, indicating the changes caused by the disease is systematic, and hinting the hemodynamics might be important markers of diabetes.Conclusion
To conclude, the study identified the reproducibility of the processing and measuring procedure of 4D Flow data and indicated the hemodynamic differences between T2DM patients and controls. We believe 4D Flow MRI, as a non-invasive technique could offer more help in the evaluation and better understanding of the disease.Acknowledgements
The prospective single-center study was approved by the local ethics review board. Written informed consent was obtained from all subjects.References
1. Hu C , Jia W . Diabetes in China: Epidemiology and Genetic Risk Factors and Their Clinical Utility in Personalized Medication[J]. Diabetes, 2018, 67(1):3-11.
2. International Diabetes Federation. IDF Diabetes Atlas, 8th edn. Brussels, Belgium: International Diabetes Federation, 2017.
3. Davies M J , D’Alessio, David A, Fradkin J , et al. Management of Hyperglycemia in Type 2 Diabetes, 2018. A Consensus Report by the American Diabetes Association (ADA) and the European Association for the Study of Diabetes (EASD)[J]. Diabetes Care, 2018.
4.Umanath K , Lewis J B . Update on Diabetic Nephropathy: Core Curriculum 2018[J]. American Journal of Kidney Diseases, 2018:S0272638617311022.
Figures