2538
Effect of noise on R2 based iron quantitation: Numerical simulation and phantom verification1Radiology, Baylor College of Medicine, MISSOURI CITY, TX, United States, 2Pediatric Radiology, Texas Children's Hospital, Houston, TX, United States, 3Radiology, Baylor St. Luke's Medical Center, Houston, TX, United States
Synopsis
T2/T2* based relaxometry is increasingly used to non-invasively quantify tissue iron content in lieu of biopsy. However, studies have shown that the observed linear relationship between R2 (1/T2) and tissue iron concentrations does not hold true above an iron concentration threshold (dubbed as the ‘saturation threshold’) [1,2]. Our numerical simulations and phantom experiments show that the choice of interval between the echo times used to sample T2 decay, and noise levels play a crucial role in determining the saturation threshold, and that the linear relationship between iron concentration and R2 can be extended by judiciously varying echo spacing.
INTRODUCTION
Studies have shown that the observed linear relationship between R2 relaxation rate and tissue iron concentration, plateaus above an iron concentration threshold, restricting its application in accurately quantifying high iron concentrations [1, 2]. Multiple mechanisms such as altered local magnetic fields to iron accumulation, thermal or electrical noise in measurement, digitization errors, signal analysis algorithms, etc. have been attributed as contributing factors for this threshold effect. In this study, we performed simulation and phantom studies to investigate the effect of noise, signal digitization and echo time (TE) intervals on saturation of the R2 measurement at high iron concentrations. Furthermore, we looked into the limitation imposed by MRI digitization on R2 quantification. Since R2* decay shares the similar property as the R2, many of our results can be naturally applicable to R2* measurement as well.METHODS
Numerical Simulations: Spin echo MR signal was modeled as monoexponential decay with a rate constant (R2) characteristic of tissue. The decay curve was sampled at five echo times with a starting echo time of TE0 and at echo times TE0+idTE with a single echo acquired per TR (i = 0,1,…4). Signal decay curves with tissue R2 values ranging from 20 Hz to 1000 Hz were generated. For each decay rate, 100 curves were generated with the addition of random noise at each noise level varied from 1% - 30% of the signal at TE0. The resulting curves were fitted using Marquardt-Levenburg algorithm (Mathworks, Natick, MA), and mean and standard deviation of R2fit were calculated over the 100 samples. Furthermore, the impact of varying dTE was evaluated with dTE set at 3 ms (Short echo spacing (SES)) and at 12 ms (Long echo spacing (LES)).Phantom Experiments: A set of MnCl2 water solutions with concentrations ranging from from 0.2 mM up to 14 mM (equivalent to R2: 20 Hz to 1000 Hz). A series of single-slice spin echo images of the phantom were acquired was at five echo times with TE= TE0+ idTE (TE0 = 6 ms, and i = 0,1,2,3 and 4, with dTE increased from 0.2, 0.4, 0.6, 0.8, 1, 1.5, 3 ms), with the following parameters: acquired slice thickness 20 mm; in-plane resolution 0.94x0.94 mm.
Data Analysis: The mean and standard deviation of signal intensity within an ROI of 17x17 pixels at each echo time was used to calculate the R2 of the phantoms with varying concentrations of MnCl2. R2 fitting was repeated for each set of experiment acquired at different dTE.
RESULTS
1. Numerical simulations demonstrate that the linear relationship between fitted R2 and prescribed R2 is preserved when R2 values and noise levels are low (Figure 1A and B).2. The impact of short and long echo spacing on R2 estimation is shown in Figure 2.
3. Saturation threshold as a function of MnCl2 concentration (and calculated R2) is demonstrated in Figure 3, as a function of varying the dTE.
4. Figure 4 showed the impact of dTE selection on signal and demonstrated that with the large dTE of 3ms signal at the second TE and fifth TE are shown in Figures 4, and 5. Note that the second TE dropped to 8.21% at 4 mM concentration of MnCl2 (or R2 280 Hz or LIC 41.3 Fe mg/g dw).
The results from the numerical simulations, and phantom study demonstrate the following:
(1) When the measured MR signal (at longer echo times) becomes comparable to noise level, the fitted R2 values start to deviate from the linear relationship;
(2) When noise levels dominate MR signal at the second TE (TE1), the saturation of estimated R2 becomes apparent;
(3) The saturated R2 value depends on the measured signal at TE0.
DISCUSSION
The results from our work demonstrate the interplay of signal decay and noise contributing to the nonlinear behavior observed between measured R2 and true R2. Therefore, when the concentration of iron is very high, it is necessary to sample the decay curve at short echo times, and incorporate methods to reduce noise. However, it is also important to note that just shortening the first TE, could also introduce errors in the low R2 regions, if the noise levels are high. Therefore, it is necessary to strike an appropriate tradeoff depending on the clinical need.CONCLUSION
Quantification of R2 and R2* can provide valuable insight in the diagnosis, treatment and patient management of patients with iron overload. Our work underscores the importance of the effect of noise, as well as experimental parameters to permit the estimation of R2* over a large range of iron overload conditions.Acknowledgements
I would like to thank Dr. K. Ghaghada for preparation of the MnCl2 water solution phantoms.References
1. Pierre et al, Noninvasive measurement and imaging of liver iron concentrations using proton magnetic resonance, BLOOD, 15 JANUARY 2005, VOLUME 105, NUMBER 2
2. Brown GC et al, Performance and limitations of R2* relaxometry liver iron measurements, December 2010, Proc. Intl. Soc. Mag. Reson. Med. 19At: Montreal
Figures
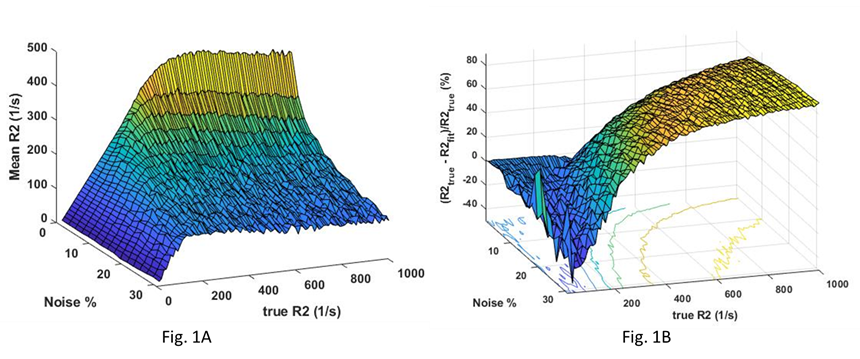
Fig 1: Surface plot of effects of true R2 value and noise on R2fit (1A) and its error (1B) with dTE 3ms. The Fig. 1A shows that linear relationship between R2 values and means R2fit at low noise and low R2. It becomes saturated at high R2 and high noise. The fig. 1B shows that error is high at very low R2 and then becomes flat for a short range and then increases again.
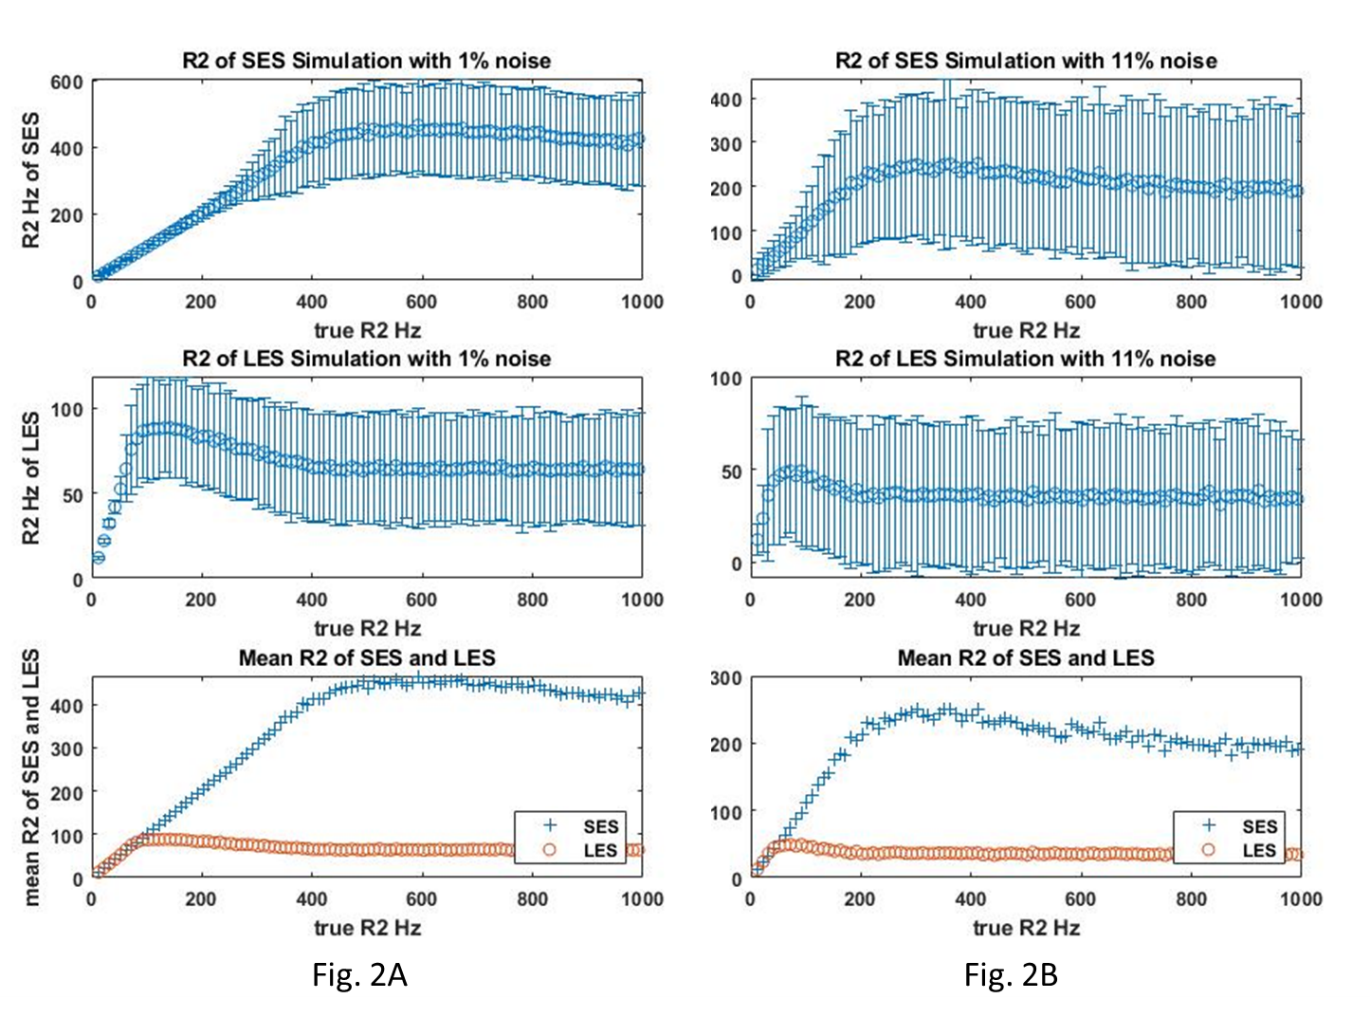
Fig 2: relationships of R2fit with true R2 with error bar of two standard deviations from mean R2fit: 2A) noise of 1%, 2B) noise of 10%, and top row is for short echo spacing (SES) with the dTE of 3 ms , middle row is for long echo spacing with the dTE of 12 ms, bottom row comparison between SES and LES. Compared to 1% noise, 11% noise significantly reduces linear range and becomes saturated quickly. The R2fit noise propagated from signal noise jumps when R2fit begins saturated.
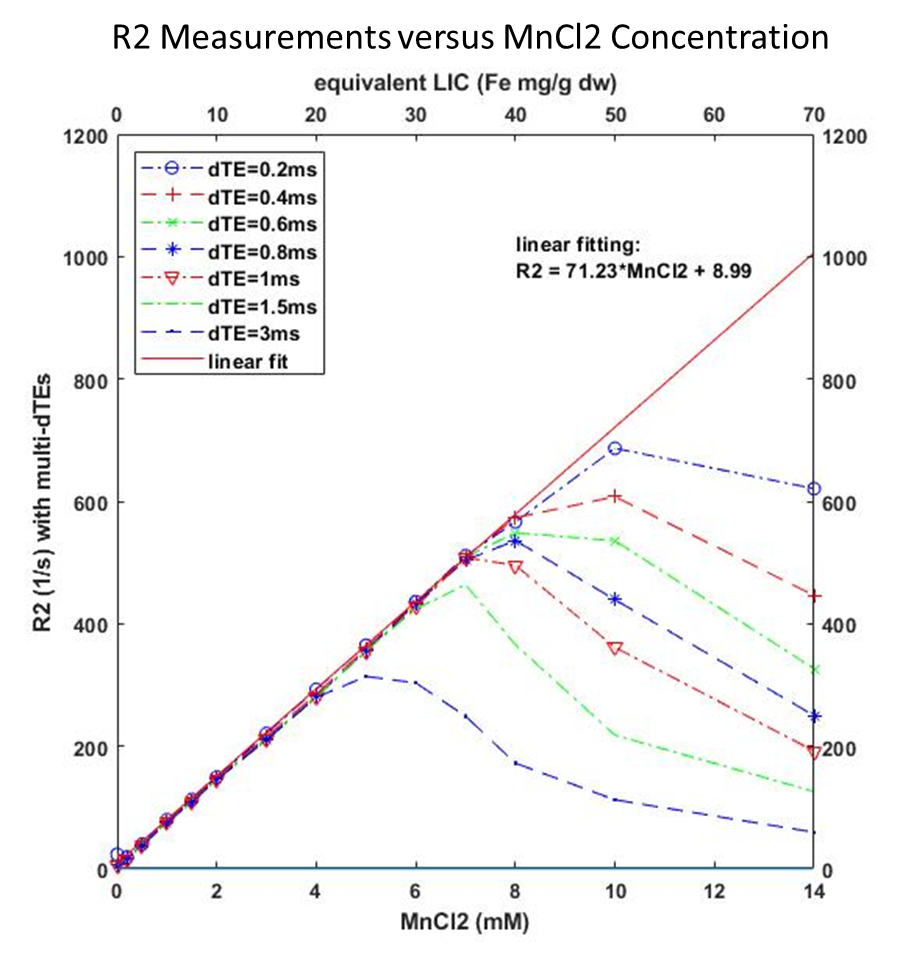
Fig 3: R2 measurement on phantoms with a series of MnCl2 concentrations. Linear curve fitting was performed on a subset of data (MnCl2 from 0 to 7 mM) with dTE of 0.2 ms. This linear function was used to extrapolate R2 for the MnCl2 concentration beyond the linear range. The saturation occurs at high MnCl2 concentration and high dTE the same to our simulation. The equivalent liver iron concentration (LIC) was calculated according to Pierre’s paper (ref 1) and added to x-axis at the top.
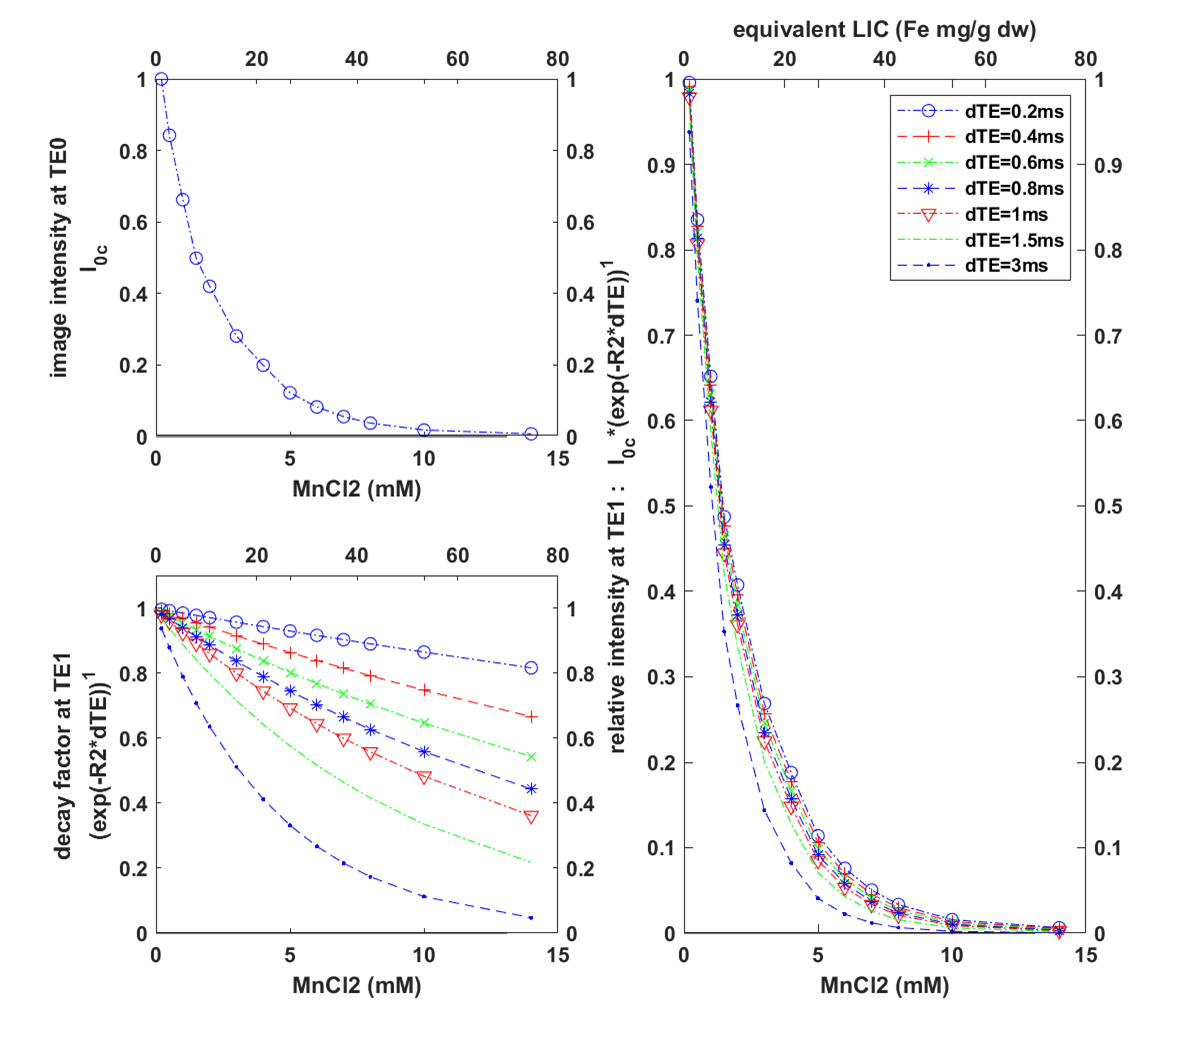
Fig 4: The image intensity varies with MnCl2 concentration. Left top: initial image intensities of phantoms at the TE0; left bottom: decay factor exp(R2*dTE) at the second TE1 for different dTEs (legend on the right) where R2 values were computed using the fitting equation R2 = 71.23*MnCl2 + 8.99. Right: multiples of initial image intensities and decay factor at the second echo TE1. For the longest dTE of 3 ms, the signal at TE2 drops to 8.21% at MnCl2 of 4 mM and drops to 4.1% at MnCl2 of 5 mM.
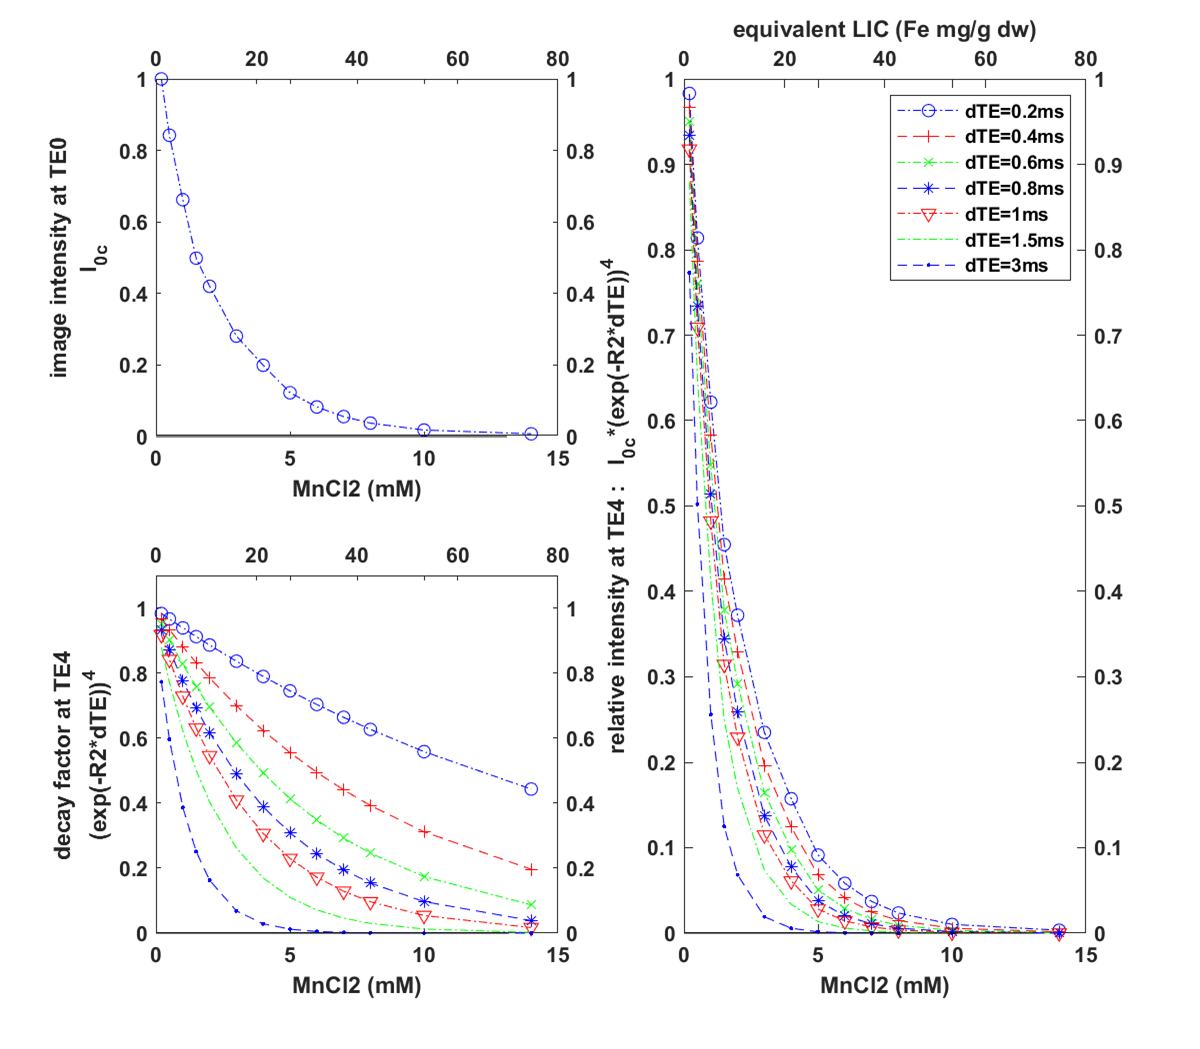
Fig 5: The image intensity varies with MnCl2 concentration. Left top: initial image intensities of phantoms at the first TE1; left bottom: decay factor exp(R2*dTE) at the fifth echo TE4 for different dTEs (legend on the right) where R2 values were computed using the fitting equation R2 = 71.23*MnCl2 + 8.99. Right: multiples of initial image intensities and decay factor at TE4. For the shortest dTE of 0.2 ms, the signal at TE4 drops to 9.14% at MnCl2 of 5 mM and drops to 3.71% at MnCl2 of 7 mM.