2537
Evaluation of severe hepatic iron overload using a high-performance 0.55T MRI system
Adrienne E Campbell-Washburn1, Christine Mancini1, Anna Conrey1, Lanelle Edwards1, Hui Xue1, Peter Kellman1, W. Patricia Bandettini1, and Swee Lay Thein1
1National Heart, Lung, and Blood Institute, National Institutes of Health, Bethesda, MD, United States
1National Heart, Lung, and Blood Institute, National Institutes of Health, Bethesda, MD, United States
Synopsis
Iron overload in the liver can be assessed with MRI by measurements of T2* and R2*. In this study, we assessed the dynamic range of hepatic T2* values using a high-performance 0.55T, compared to 1.5T, in patients with iron overload. Patients with iron overload had increased dynamic range of T2* values at 0.55T (T2* = 11.8 ± 9.4ms) compared with 1.5T (T2* = 5.7 ± 6.0ms), and the measurements were closely correlated between 0.55T and 1.5T (r = 0.96). The improved field homogeneity at 0.55T may provide value for stratification and monitoring of patients with severe iron overload by T2*.
Introduction
Iron overload in the liver can be assessed with MRI by measurements of T2* and R2*. At 1.5T, severe iron overload is classified by T2*<2ms [1, 2], however, some T2* mapping methods can lack accuracy for very short T2* because of noise bias and the lower bound of TE [3]. As a result, significant work has been done to improve the accuracy and precision of T2* mapping in recent years [4, 5].We hypothesized that lower field MRI would offer advantages for stratification of patients with severe iron overload by virtue of field homogeneity and associated prolonged T2* at lower magnetic field. We recently described a high-performance low field MRI system with the hardware and imaging capabilities for contemporary T2* mapping methods [6]. In this study, we assessed the dynamic range of hepatic T2* values using our high-performance 0.55T, compared to 1.5T, in patients with iron overload.
Methods
Liver T2* mapping was performed using a breath-held multi-echo gradient echo acquisition with fat suppression (parameters in Figure 1). We made a liver iron phantom in order to correlate 0.55T T2* values to iron concentration. Iron III nitrate (10 mgFe/g liver to 50 mgFe/g liver, 8 samples) was dissolved in liver reconstituted with water (1:7 dilution). Phantom T2* was measured at 0.55T and 1.5T within 1 hour.Patient imaging was performed with approval from the local Institutional Review Board. Patients with sickle cell anemia (n = 33) or thalassemia (n = 1) referred for a clinical MRI exam to assess iron overload were invited to participate in this study. Patients were imaged on both a 1.5T MRI system (MAGNETOM Aera, Siemens, Erlangen, Germany) and a 0.55T MRI system (prototype MAGNETOM Aera, Siemens Healthineers, Erlangen, Germany) within 24 hours. T2* was compared between field strengths in these patients. A small cohort of patients (n = 12) returned 6-12 months later for clinical follow-up and imaging was repeated. In patients with severe iron overload (n = 8), ΔT2* values between baseline and follow-up were assessed.
Results
T2* and R2* values vs. iron concentration are provided in Figure 2 for the liver phantom. At 1.5T, the relationship between iron concentration (IC) and R2* (IC = 0.018xR2*-0.16) was consistent with the model developed by Wood et al [2]. At 0.55T, we found IC = 0.072xR2*-15 using the phantom.Liver T2* in healthy volunteers has been reported to be 30 ms at 1.5T [7] and 43ms at 0.55T [6]. By comparison, patients with iron overload had mean±standard deviation (range) T2* values of 5.7 ± 6.0ms (0.8-25ms) at 1.5T and 11.8 ± 9.4ms (1.9-37ms) at 0.55T. The T2* values were well correlated between 0.55T and 1.5T (r = 0.96), with slope = 1.7, as expected (Figure 3). Patients with T2*<3ms at 1.5T, had T2* values of 1.9-5.9ms at 0.55T. This increase in dynamic range may be valuable for stratifying patients and assessing therapy response in these patients with severe iron overload. Figure 4 compares T2* maps and T2*-weighted images (TE =10.3ms) between 0.55T and 1.5T.
Eight patients with severe iron overload on their first visit, underwent chelation therapy, blood transfusion or both before follow-up. In these patients, mean ΔT2* was 17% at 1.5T and 28% at 0.55T. On average, T2* increased from 4.0ms to 5.4ms at 0.55T and 1.5ms to 1.8ms on 1.5T in these patients undergoing therapeutic treatment for iron overload.
Discussion and Conclusion
The improved field homogeneity at 0.55T may provide value for stratification and monitoring of patients with severe iron overload by T2*. The longer T2* at 0.55T may also allow for acquisitions with higher spatial resolution. The ability to measure T2* accurately in the abdomen and heart relies on the fast gradient performance and appropriate pulse sequence capabilities. Future work will investigate the sensitivity of 0.55T T2* measurements to detect patients with mild iron overload from normal, and will evaluate the precision of lower SNR 0.55T T2* measurements.Acknowledgements
Funding for this work was provided by the National Heart, Lung and Blood Institute’s Division of Intramural Research. We would like to acknowledge the assistance of Siemens Healthcare in the modification of the MRI system for operation at 0.55T under an existing cooperative research agreement (CRADA) between NHLBI and Siemens Healthcare.References
- Labranche, R., et al., Liver Iron Quantification with MR Imaging: A Primer for Radiologists. Radiographics, 2018. 38(2): p. 392-412.
- Wood, J.C., et al., MRI R2 and R2* mapping accurately estimates hepatic iron concentration in transfusion-dependent thalassemia and sickle cell disease patients. Blood, 2005. 106(4): p. 1460-5.
- Hernando, D., et al., Quantification of liver iron with MRI: state of the art and remaining challenges. J Magn Reson Imaging, 2014. 40(5): p. 1003-21.
- Kellman, P., et al., Free-breathing T2* mapping using respiratory motion corrected averaging. J Cardiovasc Magn Reson, 2015. 17(1): p. 3.5
- Sandino, C.M., et al., Myocardial T2* mapping: influence of noise on accuracy and precision. J Cardiovasc Magn Reson, 2015. 17(1): p. 7.
- Campbell-Washburn, A.E., et al., Opportunities in Interventional and Diagnostic Imaging by Using High-performance Low-Field-Strength MRI. Radiology, 2019. 293(2): p. 384-93.
- Westwood, M., et al., A single breath-hold multiecho T2* cardiovascular magnetic resonance technique for diagnosis of myocardial iron overload. J Magn Reson Imaging, 2003. 18(1): p. 33-9.
Figures
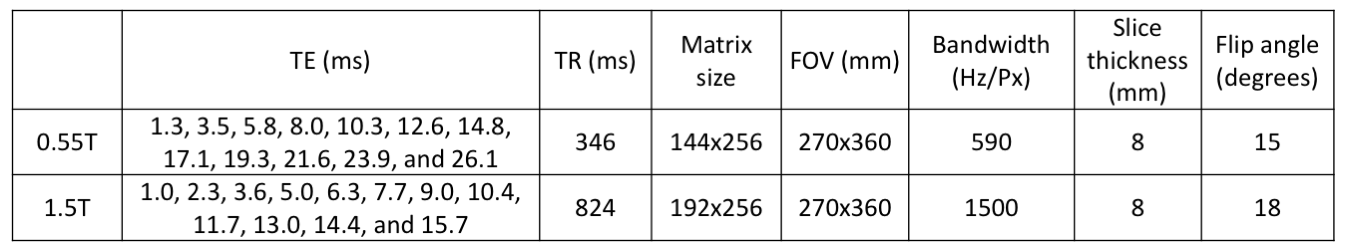
Figure 1: Imaging parameters for breath-held 12-echo gradient echo T2* mapping in the liver.
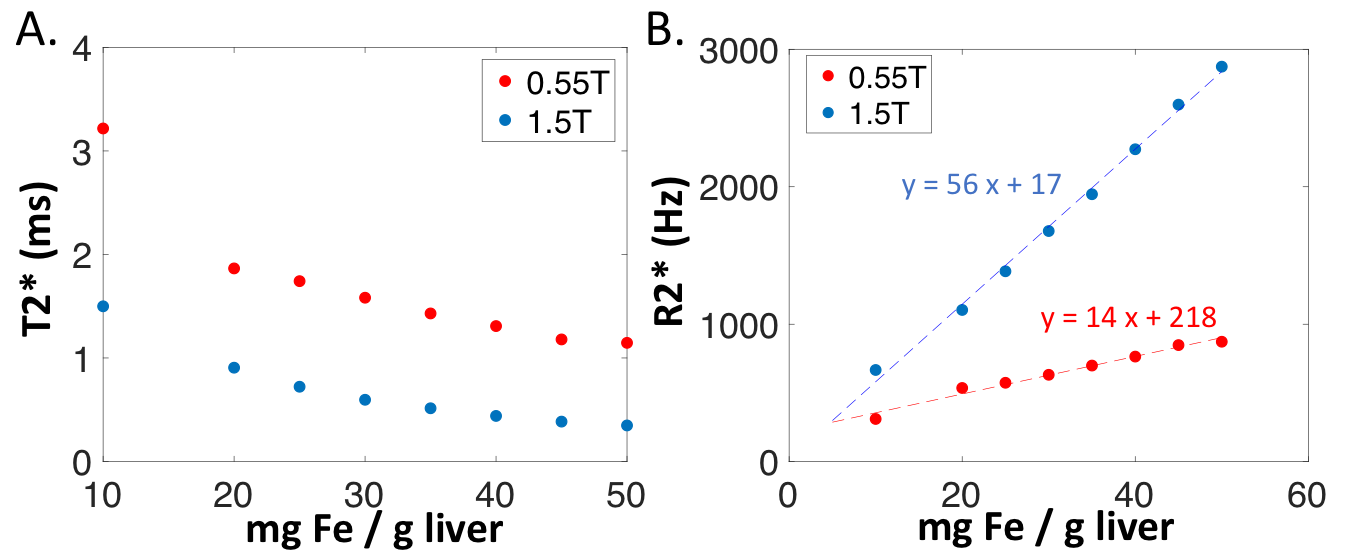
Figure 2: Liver iron phantom measurements of (A) T2* and (B) R2*.
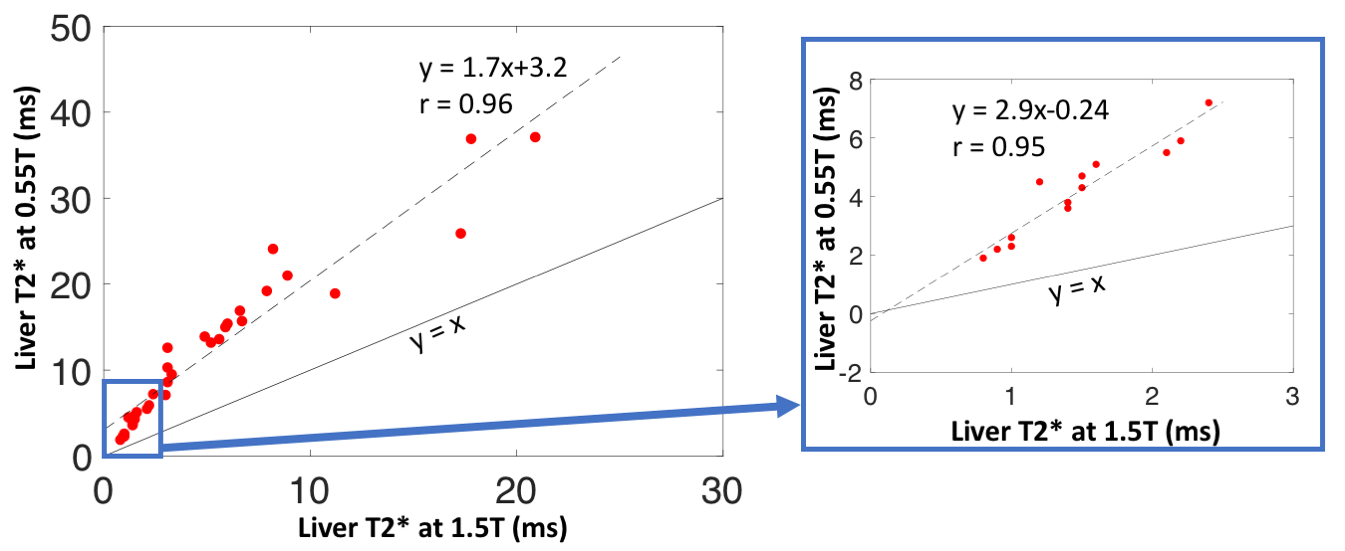
Figure 3: Liver T2* measured at 0.55T and 1.5T in patients with iron overload (n = 34). The blue box highlights patients with moderate to severe iron overload with T2*<3ms at 1.5T. Larger dynamic range at 0.55T for patients with severe iron overload was observed.
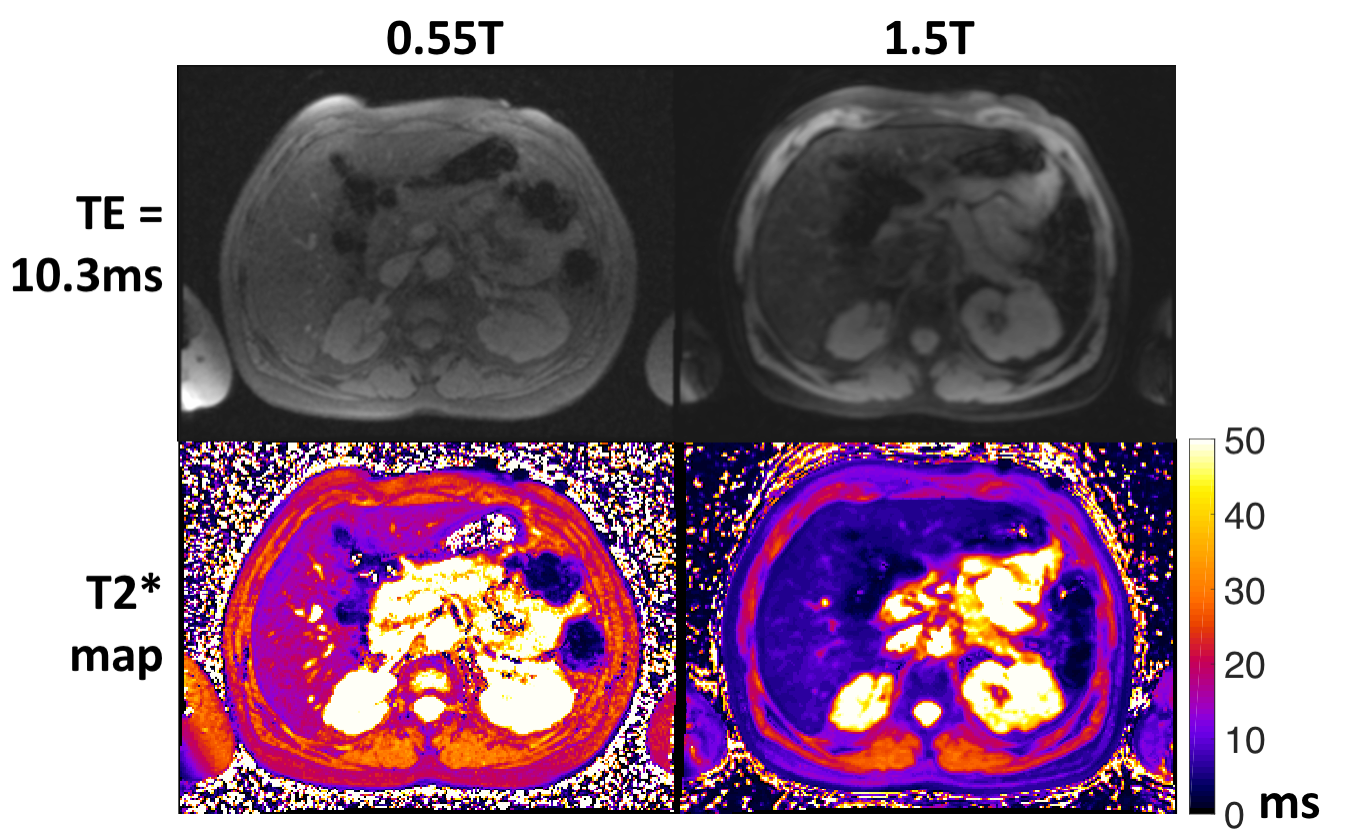
Figure 4: T2*-weighted images (TE= 10.3ms) and T2* maps from 0.55T and 1.5T.