2536
Histological Validation of Multipeak Fat-Corrected Complex R2* Mapping for Quantification of Liver Iron1Medical Physics, University of Wisconsin-Madison, Madison, WI, United States, 2Radiology, University of Wisconsin-Madison, Madison, WI, United States, 3Pathology, The third Affiliated Hospital, Sun Yat-Sen University, Guangzhou, China, 4Biomedical Engineering, University of Wisconsin-Madison, Madison, WI, United States, 5Radiology, The third Affiliated Hospital, Sun Yat-Sen University, Guangzhou, China, 6Medicine, University of Wisconsin-Madison, Madison, WI, United States, 7Emergency Medicine, University of Wisconsin-Madison, Madison, WI, United States
Synopsis
Histological grading of iron deposition in the liver has been shown to correlate with conventional magnitude-based R2* mapping methods. However, magnitude-based R2* mapping methods are known to exhibit bias in the presence of fat and when signal-to-noise ratio (SNR) is low. Multipeak fat-corrected complex R2* mapping enables accurate R2* measurements by correcting for fat-related bias and the bias due to low SNR, but has not been compared to histological iron grading. In this work, multipeak fat-corrected R2* mapping is validated by comparing with histological iron grading as the reference standard.
Introduction
MRI-based R2* relaxometry has emerged as an important quantitative biomarker for iron overload in the liver. However, magnitude-based R2* mapping methods are known to be confounded by noise-related bias (particularly at high iron levels), as well as by the presence of fat. Confounder-corrected complex R2* mapping, which addresses the presence of fat through water-fat separation, and noise bias through fitting the complex signal, has the potential to address these confounding factors[1]. In recent single and multi-site validation studies, this technique has been shown to enable accurate and reproducible liver iron quantification using an FDA-approved R2-based measure of liver iron concentration as the reference standard[2][3][4, p. 2][5]. However, these studies have not compared confounder-corrected complex R2* mapping of the liver to histology-based assessment of liver iron content. Therefore, the purpose of this work was to validate confounder-corrected complex R2* mapping with histological liver iron grading.Methods
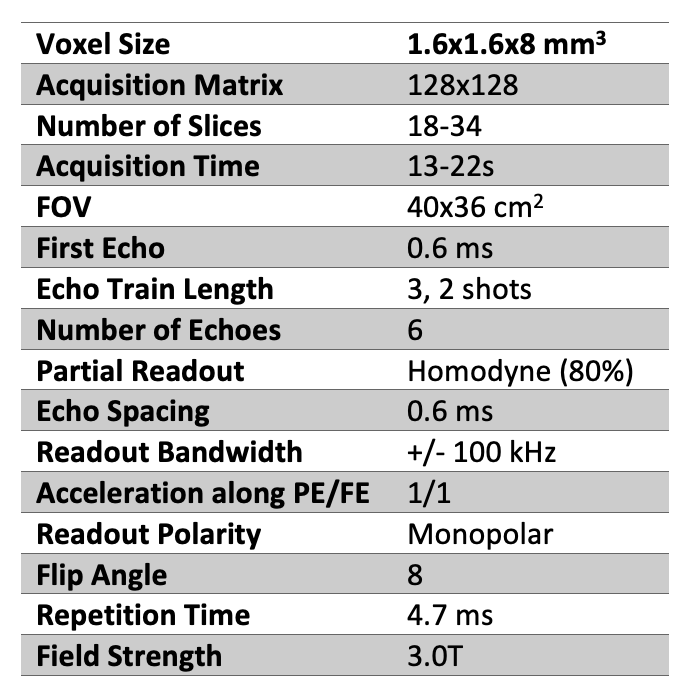
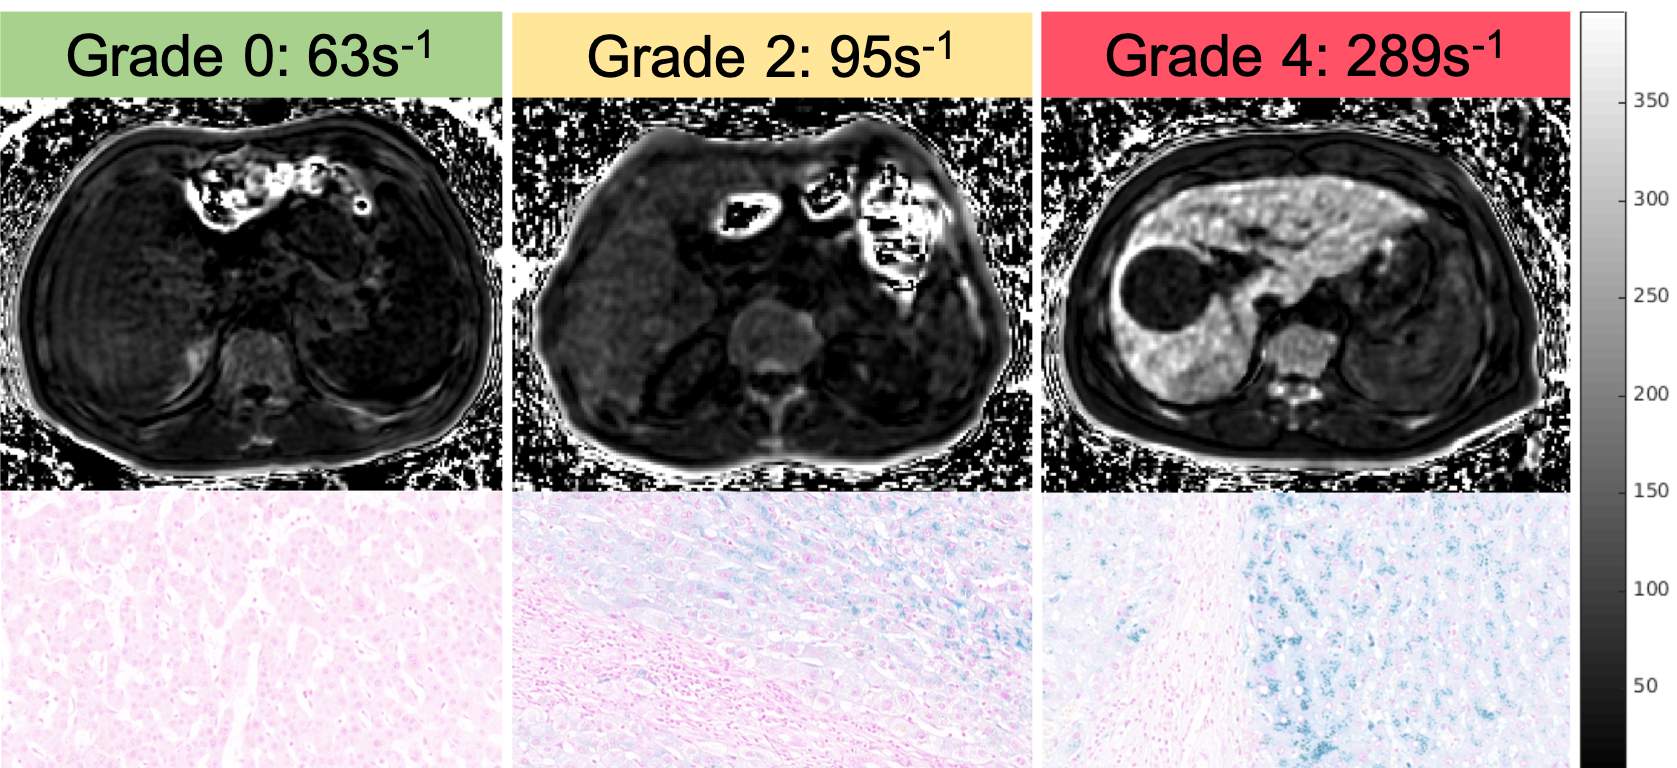
In this IRB-approved retrospective study, patients receiving clinical MRI scans for suspected focal liver lesions were recruited with informed written consent. For R2* mapping of the liver, a 3D multi-echo spoiled gradient recalled echo (SGRE) acquisition was performed on a clinical 3T MR system (GE Healthcare Discovery MR750, Waukesha, WI) with the parameters shown in Table 1. From this acquisition, R2* mapping was performed offline using a graphcut algorithm followed by a multipeak fat-corrected complex nonlinear least-squares fitting approach [1]. Liver R2* maps were measured in a single 2-4cm2 region-of-interest (ROI) drawn in the right lobe of the liver for each subject, avoiding from visible lesions, blood vessels, and bile ducts.Histology results used in this analysis were obtained from a liver paraenchymal biopsy acquired while performing liver resection of suspected focal liver lesions in all the patients. Histology analysis was based on Prussian blue staining followed by grading as follows: 0 (no iron staining), 1 (minimal iron staining), 2 (mild iron staining), 3 (moderate iron staining) and 4 (severe iron staining). Statistical analysis included correlation analysis, Student’s t-tests, and receiver operating characteristic (ROC) curve analysis. P value less than 0.05 is considered as statistically significant.
Results
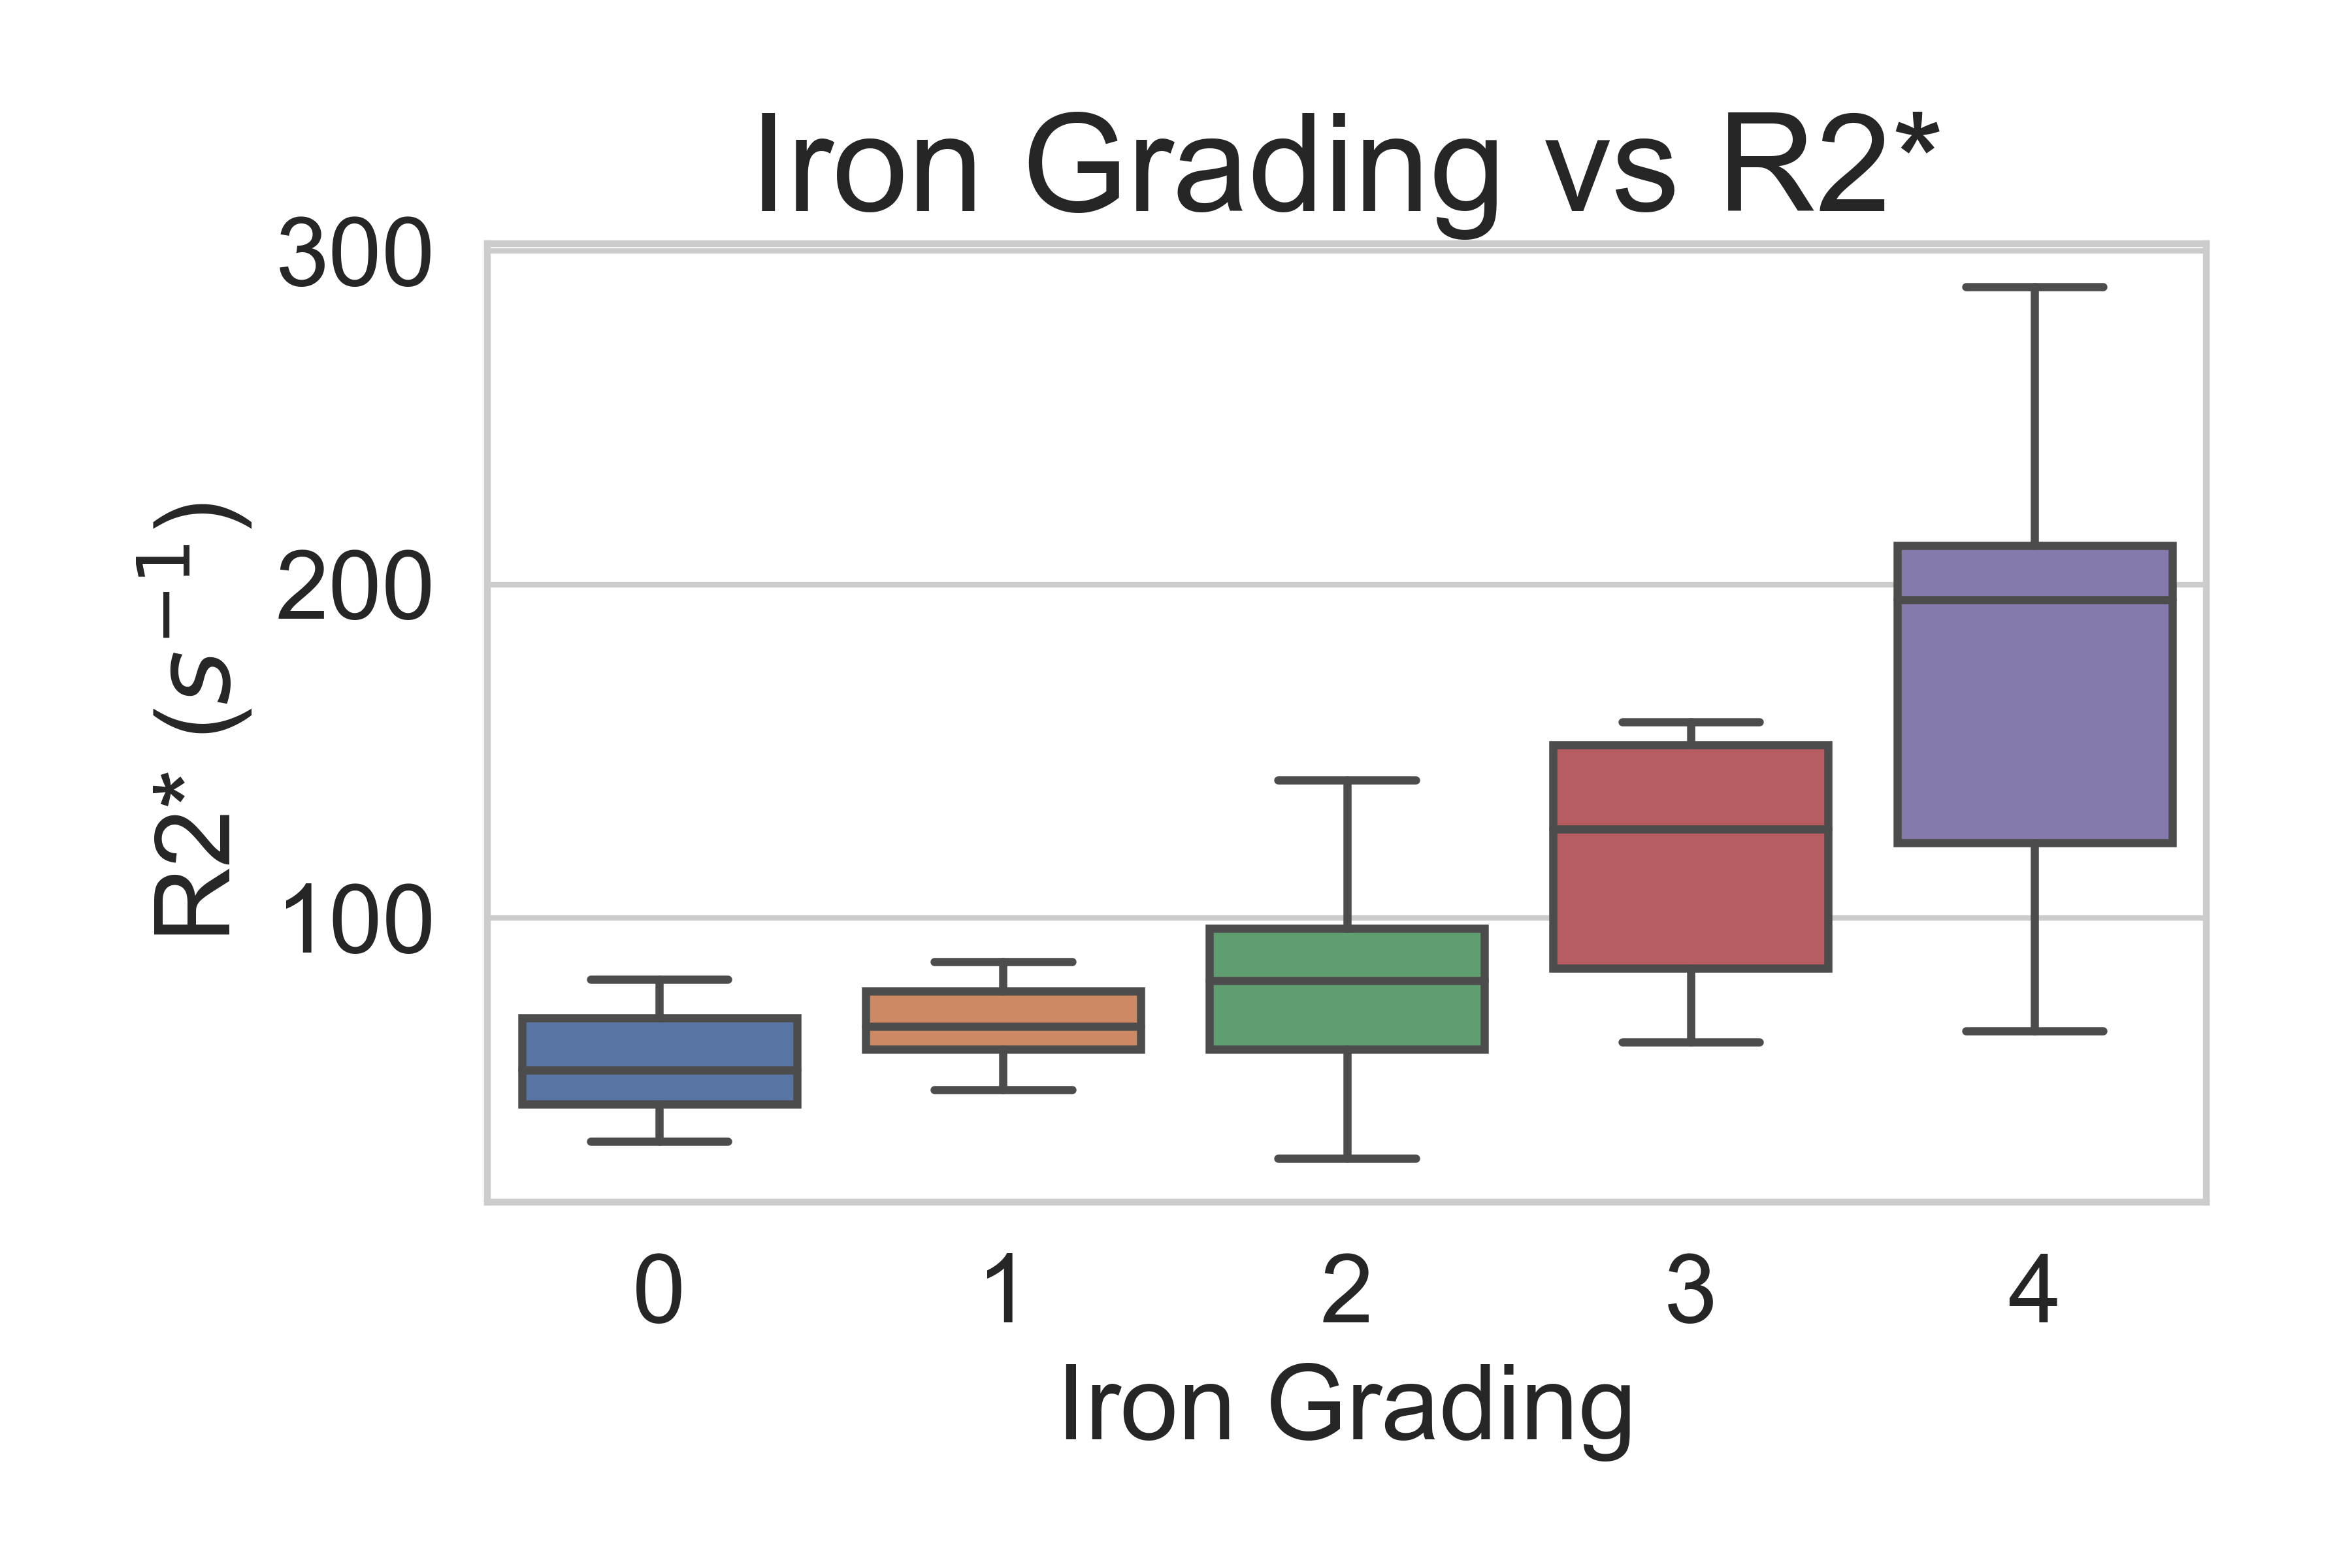
A total of 56 patients (age 22-78, average age=50, 52/4 male/female) with 3D multi-echo SGRE images and liver histology iron grading were included in this analysis. Measured liver R2* values ranged from 26 s-1 to 289 s-1 with a mean of 89 s-1 and standard deviation of 53 s-1. Based on the histology results, there were 11, 10, 23, 7, 5 patients with iron grades 0, 1, 2, 3, and 4, respectively. The distribution of measured R2* values for each iron grade is shown in Figure 3.Histological iron grading was performed by an expert hepatopathologist with 12 years clinical experience using a standard 4-point grading system[6]. The time interval between MRI scan and biopsy test is less than 1 month.
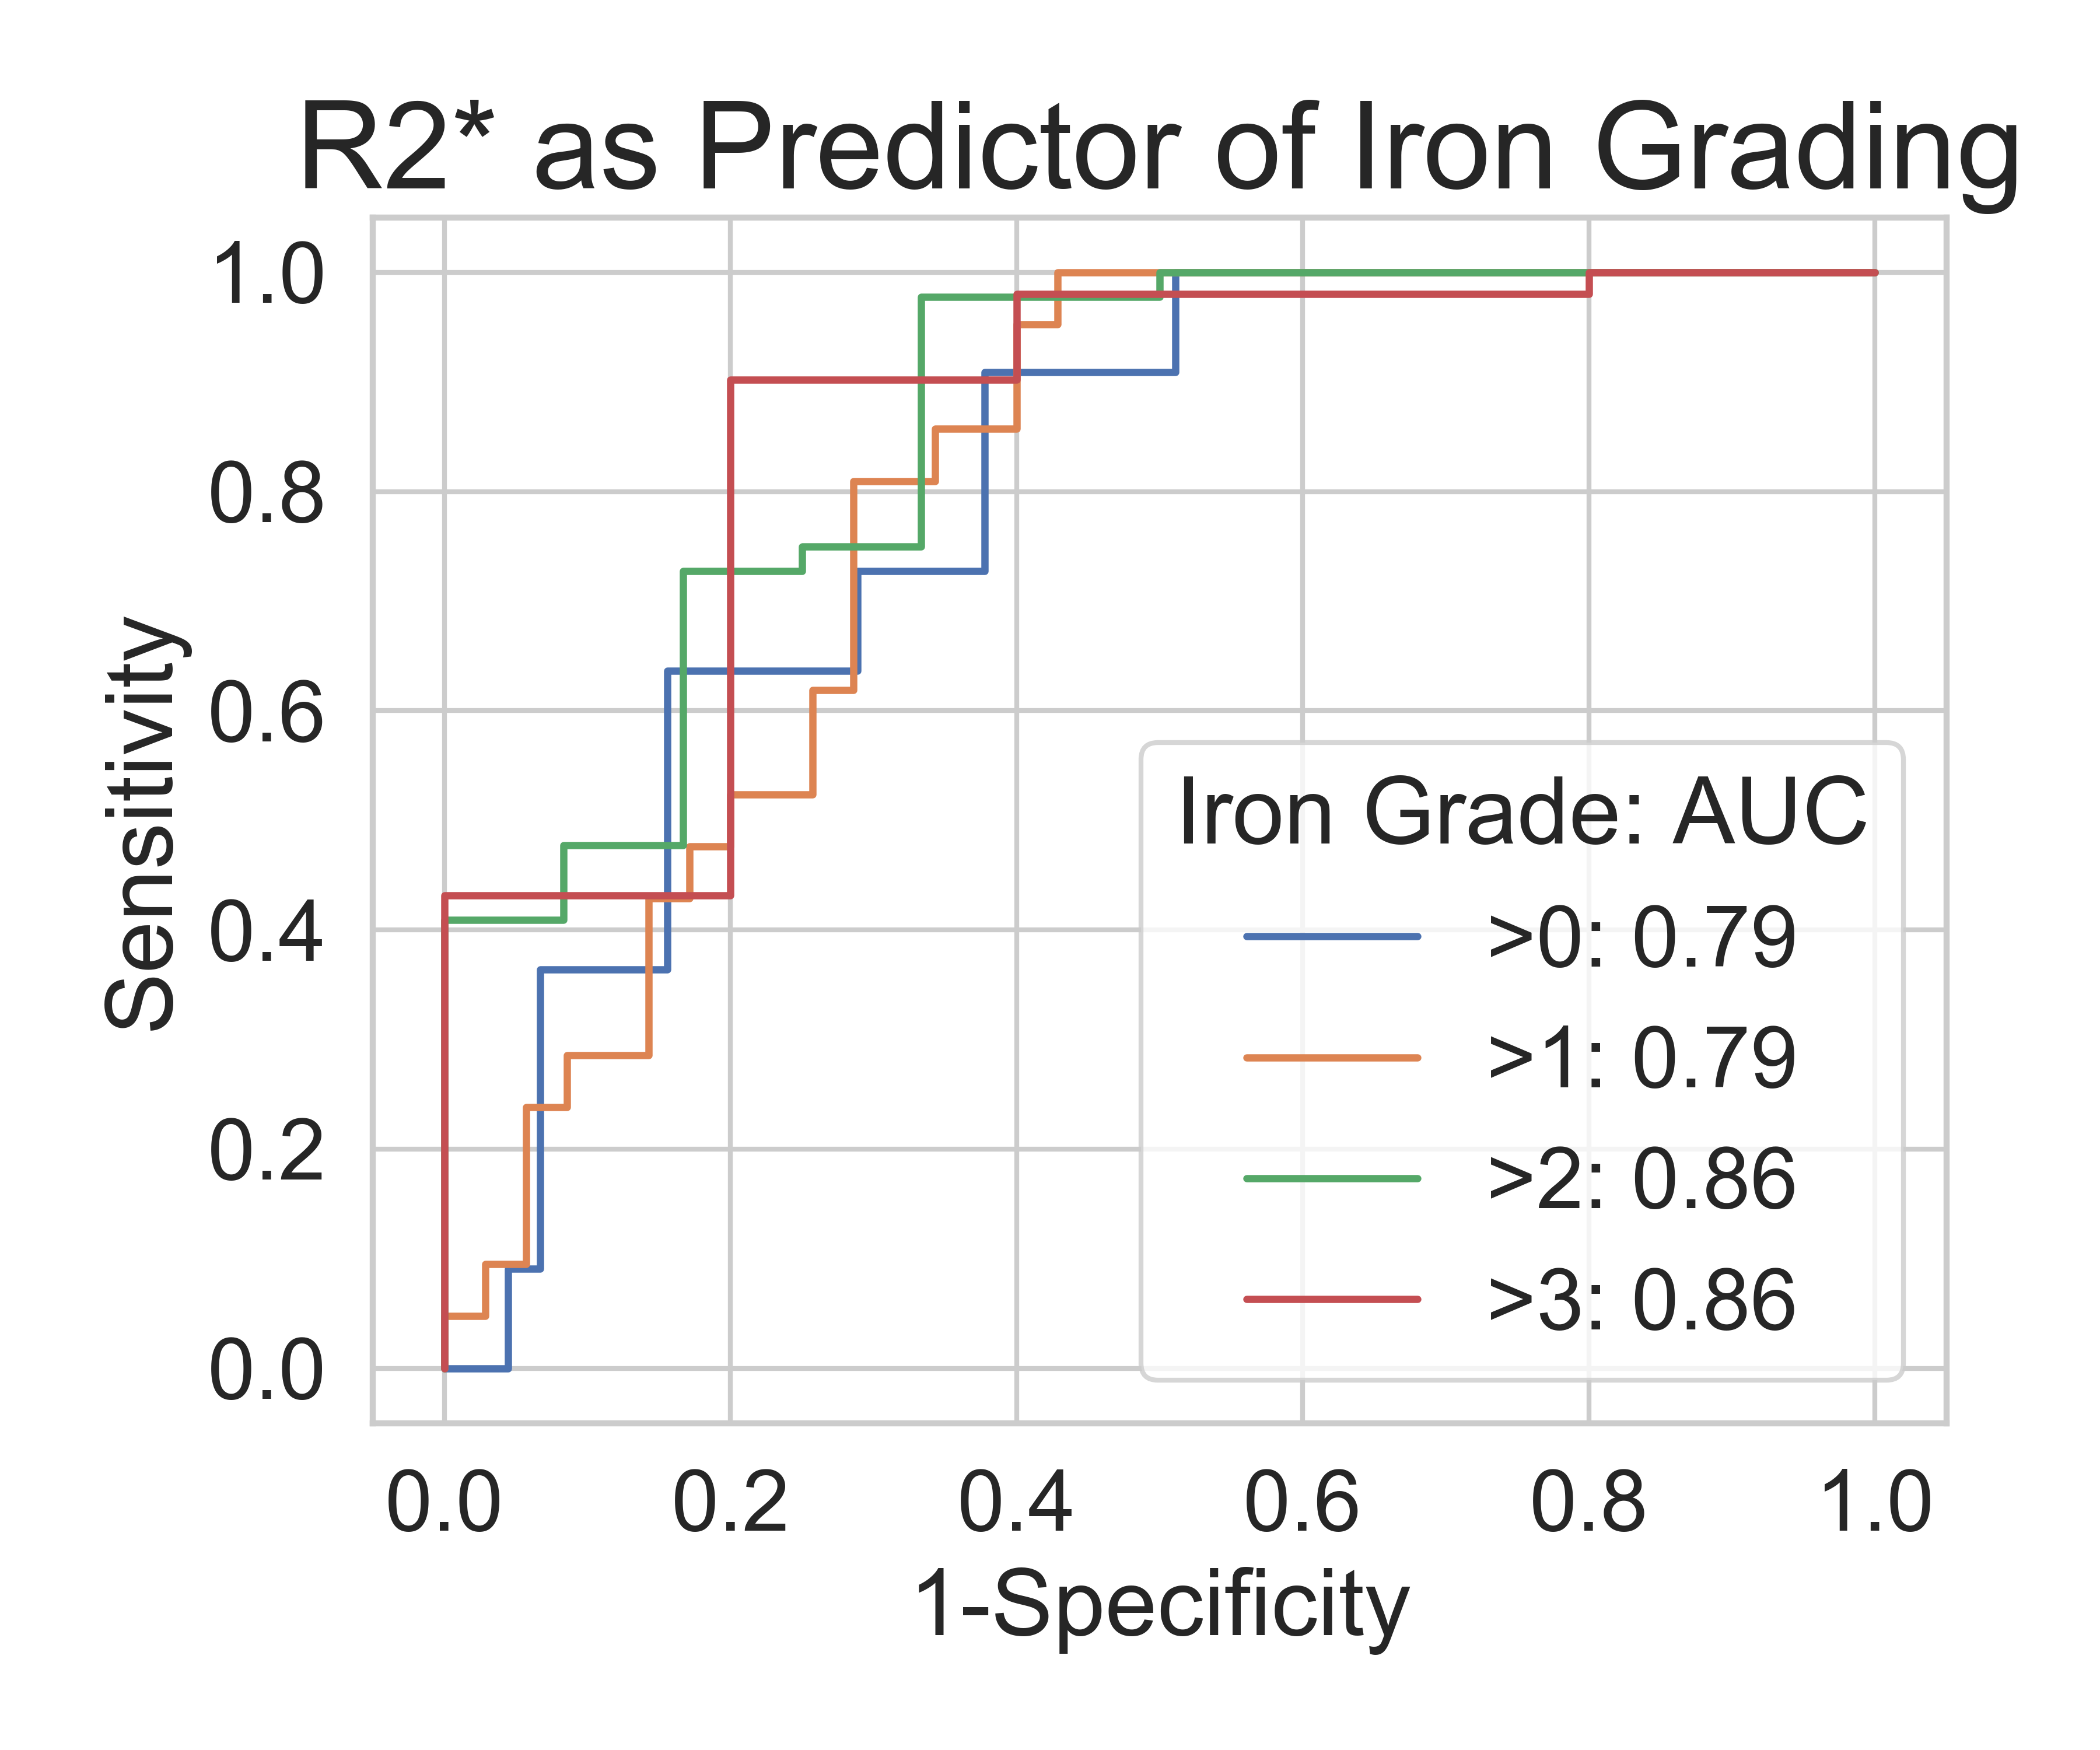
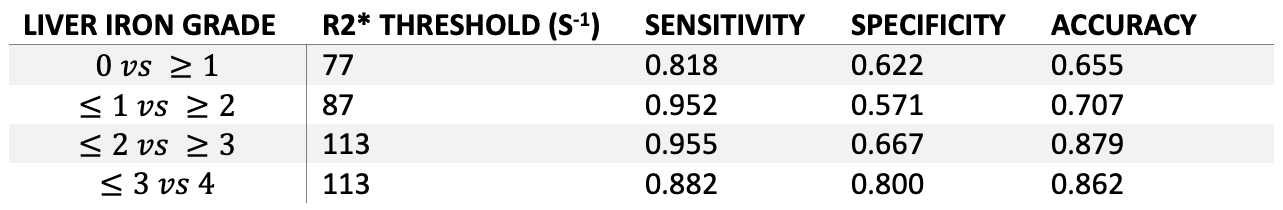
Mean R2* values increased with histological iron grade. A significant positive correlation was observed between R2* and histological liver iron grade (Spearman rank correlation coefficient Rs = 0.607, p<.001). Independent t-test showed significant difference for all paired grades of iron staining except for paired grades of 0-1, 1-2, and 3-4. ROC curves for thresholding iron grades are shown in Figure 4. R2* had an Area Under the Curve (AUC) value of 0.794 for distinguishing patients without iron at liver biopsy (grade = 0) from patients with iron (grade ≥ 1), and AUC of 0.860 for distinguishing mild or no iron overload (grade < 3) from moderate to severe iron overload (grade ≥ 3). Optimal thresholds for distinguishing iron grade are shown in Figure 5.
Discussion
In this work, we assessed the correlation of confounder-corrected complex R2* mapping with histology-based iron grading in the liver. In 59 patients, R2* of the liver showed high correlation with biopsy-based iron grade.Previous work using magnitude based fat-uncorrected methods have also demonstrated strong correlation with biopsy-based iron quantification[7]. Further, previous works with magnitude-based R2* methods have observed similar results[8]. Importantly, this work demonstrates the performance of a complex-based fitting method which inherently avoids noise-floor effects. Prior to this work, this complex-based method had not been validated using a histology-based reference.
Limitations of this analysis include the limited R2* range present in the dataset. Further, biopsy results provide highly localized measures of iron deposition and may vary substantially throughout the liver, and measurements of R2* may not be in the same location as liver biopsy[9]. Finally, liver R2* was compared with biopsy-based iron grading as a reference for liver iron deposition. A more sophisticated reference for biopsy-based iron quantification (e.g.: atomic absorption spectrometry) needs to be used.
Conclusion
In summary, confounder-corrected complex R2* measurements highly correlate with histological iron grade in the liver and can evaluate minimal liver iron deposition in patients with chronic liver disease.Acknowledgements
We wish to acknowledge support from the NIH (R01 DK083380, R01 DK088925, K24 DK102595) and from the University of Wisconsin SEED grant program. Further, we wish to acknowledge GE Healthcare and Bracco Diagnostics who provides research support to the University of Wisconsin. Finally, Dr. Reeder is a Romnes Faculty Fellow, and has received an award provided by the University of Wisconsin-Madison Office of the Vice Chancellor for Research and Graduate Education with funding from the Wisconsin Alumni Research Foundation.
References
[1] D. Hernando, J. H. Kramer, and S. B. Reeder, “Multipeak fat-corrected complex R2* relaxometry: Theory, optimization, and clinical validation,” Magn. Reson. Med., vol. 70, no. 5, pp. 1319–1331, 2013.
[2] N. Qazi, S. B. Reeder, and D. Hernando, “Robustness of R2* mapping for liver iron assessment at 1.5T and 3T,” presented at the ISMRM, 2013, vol. 4204.
[3] D. Hernando et al., “Repeatability and Reproducibility of Confounder-Corrected R2* as a Biomarker of Liver Iron Concentration: Interim Results from a Multi-Center, Multi-Vendor Study at 1.5T and 3T,” presented at the ISMRM, 2019, vol. 1020.
[4] D. Hernando et al., “Liver R2* as a Biomarker of Liver Iron Concentration: Interim Results from a Multi-Center, Multi-Vendor Reproducibility Study at 1.5T and 3T,” presented at the ISMRM, 2019, vol. 0514.
[5] D. Hernando, N. Qazi, and S. B. Reeder, “Calibration of confounder-corrected R2* for liver iron quantification at 1.5T and 3T: preliminary results,” presented at the ISMRM, 2013, vol. 4194.
[6] A. P. Hall, W. Davies, K. Stamp, I. Clamp, and A. Bigley, “Comparison of Computerized Image Analysis with Traditional Semiquantitative Scoring of Perls’ Prussian Blue Stained Hepatic Iron Deposition,” Toxicol. Pathol., vol. 41, no. 7, pp. 992–1000, Oct. 2013.
[7] J. C. Wood et al., “MRI R2 and R2* mapping accurately estimates hepatic iron concentration in transfusion-dependent thalassemia and sickle cell disease patients,” Blood, vol. 106, no. 4, pp. 1460–1465, Aug. 2005.
[8] M. França et al., “Accurate simultaneous quantification of liver steatosis and iron overload in diffuse liver diseases with MRI,” Abdom. Radiol., vol. 42, no. 5, pp. 1434–1443, May 2017.
[9] E. Butensky et al., “Variability in Hepatic Iron Concentration in Percutaneous Needle Biopsy Specimens From Patients With Transfusional Hemosiderosis,” Am. J. Clin. Pathol., vol. 123, no. 1, pp. 146–152, Jan. 2005.
Figures