2535
Free-Breathing QSM and R2* Mapping of Hepatic Iron Overload Using a 3D Multi-Echo Cones Trajectory1Radiology, Stanford University, Stanford, CA, United States, 2Electrical Engineering, Stanford University, Stanford, CA, United States, 3Radiology, University of Wisconsin-Madison, Madison, WI, United States, 4GE Healthcare, Redwood City, CA, United States
Synopsis
In this study, free-breathing QSM and R2* mapping of liver iron overload was enabled using a 3D multi-echo cones trajectory. The proposed method was compared with a chemical-shift-encoded MRI technique that requires breath-holding. QSM and R2* exhibit similar image quality in axial, sagittal, and coronal views as well as good agreement in ROI-based quantitative value based on Bland-Altman and linear correlation plots. The imaging time for free-breathing liver iron quantification takes ~4 min, which can be further accelerated by increasing readout duration or using compressed sensing.
Introduction
Respiratory motion is one of the major barriers in broad clinical use of abdominal quantitative susceptibility mapping (QSM) and R2* mapping for liver iron quantification. Currently, chemical-shift-encoded (CSE) MRI techniques are typically performed using 3D Cartesian acquisitions with breath-holding, covering the entire liver volume1. However, breath-held acquisitions are challenging for many children and adults. Therefore, free-breathing MRI techniques are needed, and a 3D cones k-space trajectory was investigated for this purpose as it has high sampling efficiency for fast scan times and excellent motion robustness2,3. The goal of this study was to enable free-breathing QSM and R2* mapping of liver iron overload using 3D multi-echo cones MRI (FB Cones) and compare it to breath-held Cartesian (BH Cartesian) CSE-MRI both at 1.5T and 3T clinical scanners.Methods & Materials
3D Multi-Echo Cones Trajectory & QSM/R2* MappingAn RF-spoiled gradient echo (SPGR) sequence with a conical k-space trajectory2 was extended to multi-echo acquisitions as shown in Fig. 1. A spiral-like cone interleaf traverses from the center of k-space along the conical surface and rewinds back to the center with the inverted readout gradients. This readout/rewinding cycle repeats multiple times to acquire multiple echoes in a time-interleaved fashion with multiple excitations. Once this cycle completes, the next cone interleaf is then acquired using the same cycle until the Nyquist sampling criterion is met. The order of cone interleaves is determined using a golden-ratio re-ordering scheme to enhance robustness to motion artifacts3. The k-space raw data is then processed via a QSM/R2* mapping pipeline shown in Fig. 2.
Data Acquisition
With IRB approval and informed consent/assent, 12 subjects (11-62 years old) with known and suspected hepatic iron overload were imaged on 1.5T MRI (Artist, GE Healthcare, Waukesha, WI) and 3T MRI scanners (MR750, GE Healthcare, Waukesha, WI) using FB Cones and BH Cartesian with 32-channel body/torso coils. Six out of 12 subjects were imaged both on 1.5T and 3T, and the other six subjects underwent either 1.5T or 3T. The 3D GRE imaging parameters for BH Cartesian at 3T and 1.5T in parentheses were: acquired matrix size = 256 (224) × 256 (224) × 20-36, acquired in-plane res = 1.17 × 1.17 to 1.64 × 1.64 mm2, slice thickness = 6 mm, FA = 3° (5°), initial TE/ΔTE/TR = 1.1/0.9 (2)/7.3 (14) ms, ETL/#shots = 3/2 (6/1), NEX = 0.75, rBW = ±125 (110) kHz, ACC = 2 × 2, scan time = ~19 sec with a single breath-hold. 3D SPGR imaging parameters for FB Cones at 3T and 1.5T in parentheses were: acquired matrix size = 256 (224) × 256 (224) × 20-36, acquired in-plane res = 1.17 × 1.17 to 1.78 × 1.78 mm2, slice thickness = 6 mm, FA = 3°, initial TE/ΔTE/TR = 0.036/0.9 (1.2)/9.6 (12) ms, ETL/#shots = 3/2, readout duration = ~1 ms, #cone readouts = ~10,000, no acceleration, scan time = ~4 min with free breathing.
ROI Analysis
Circular ROIs with the radius of 10 voxels (~3 cm of diameter) were taken from axial mid-liver to perform Bland-Altman and linear regression analysis.
Results
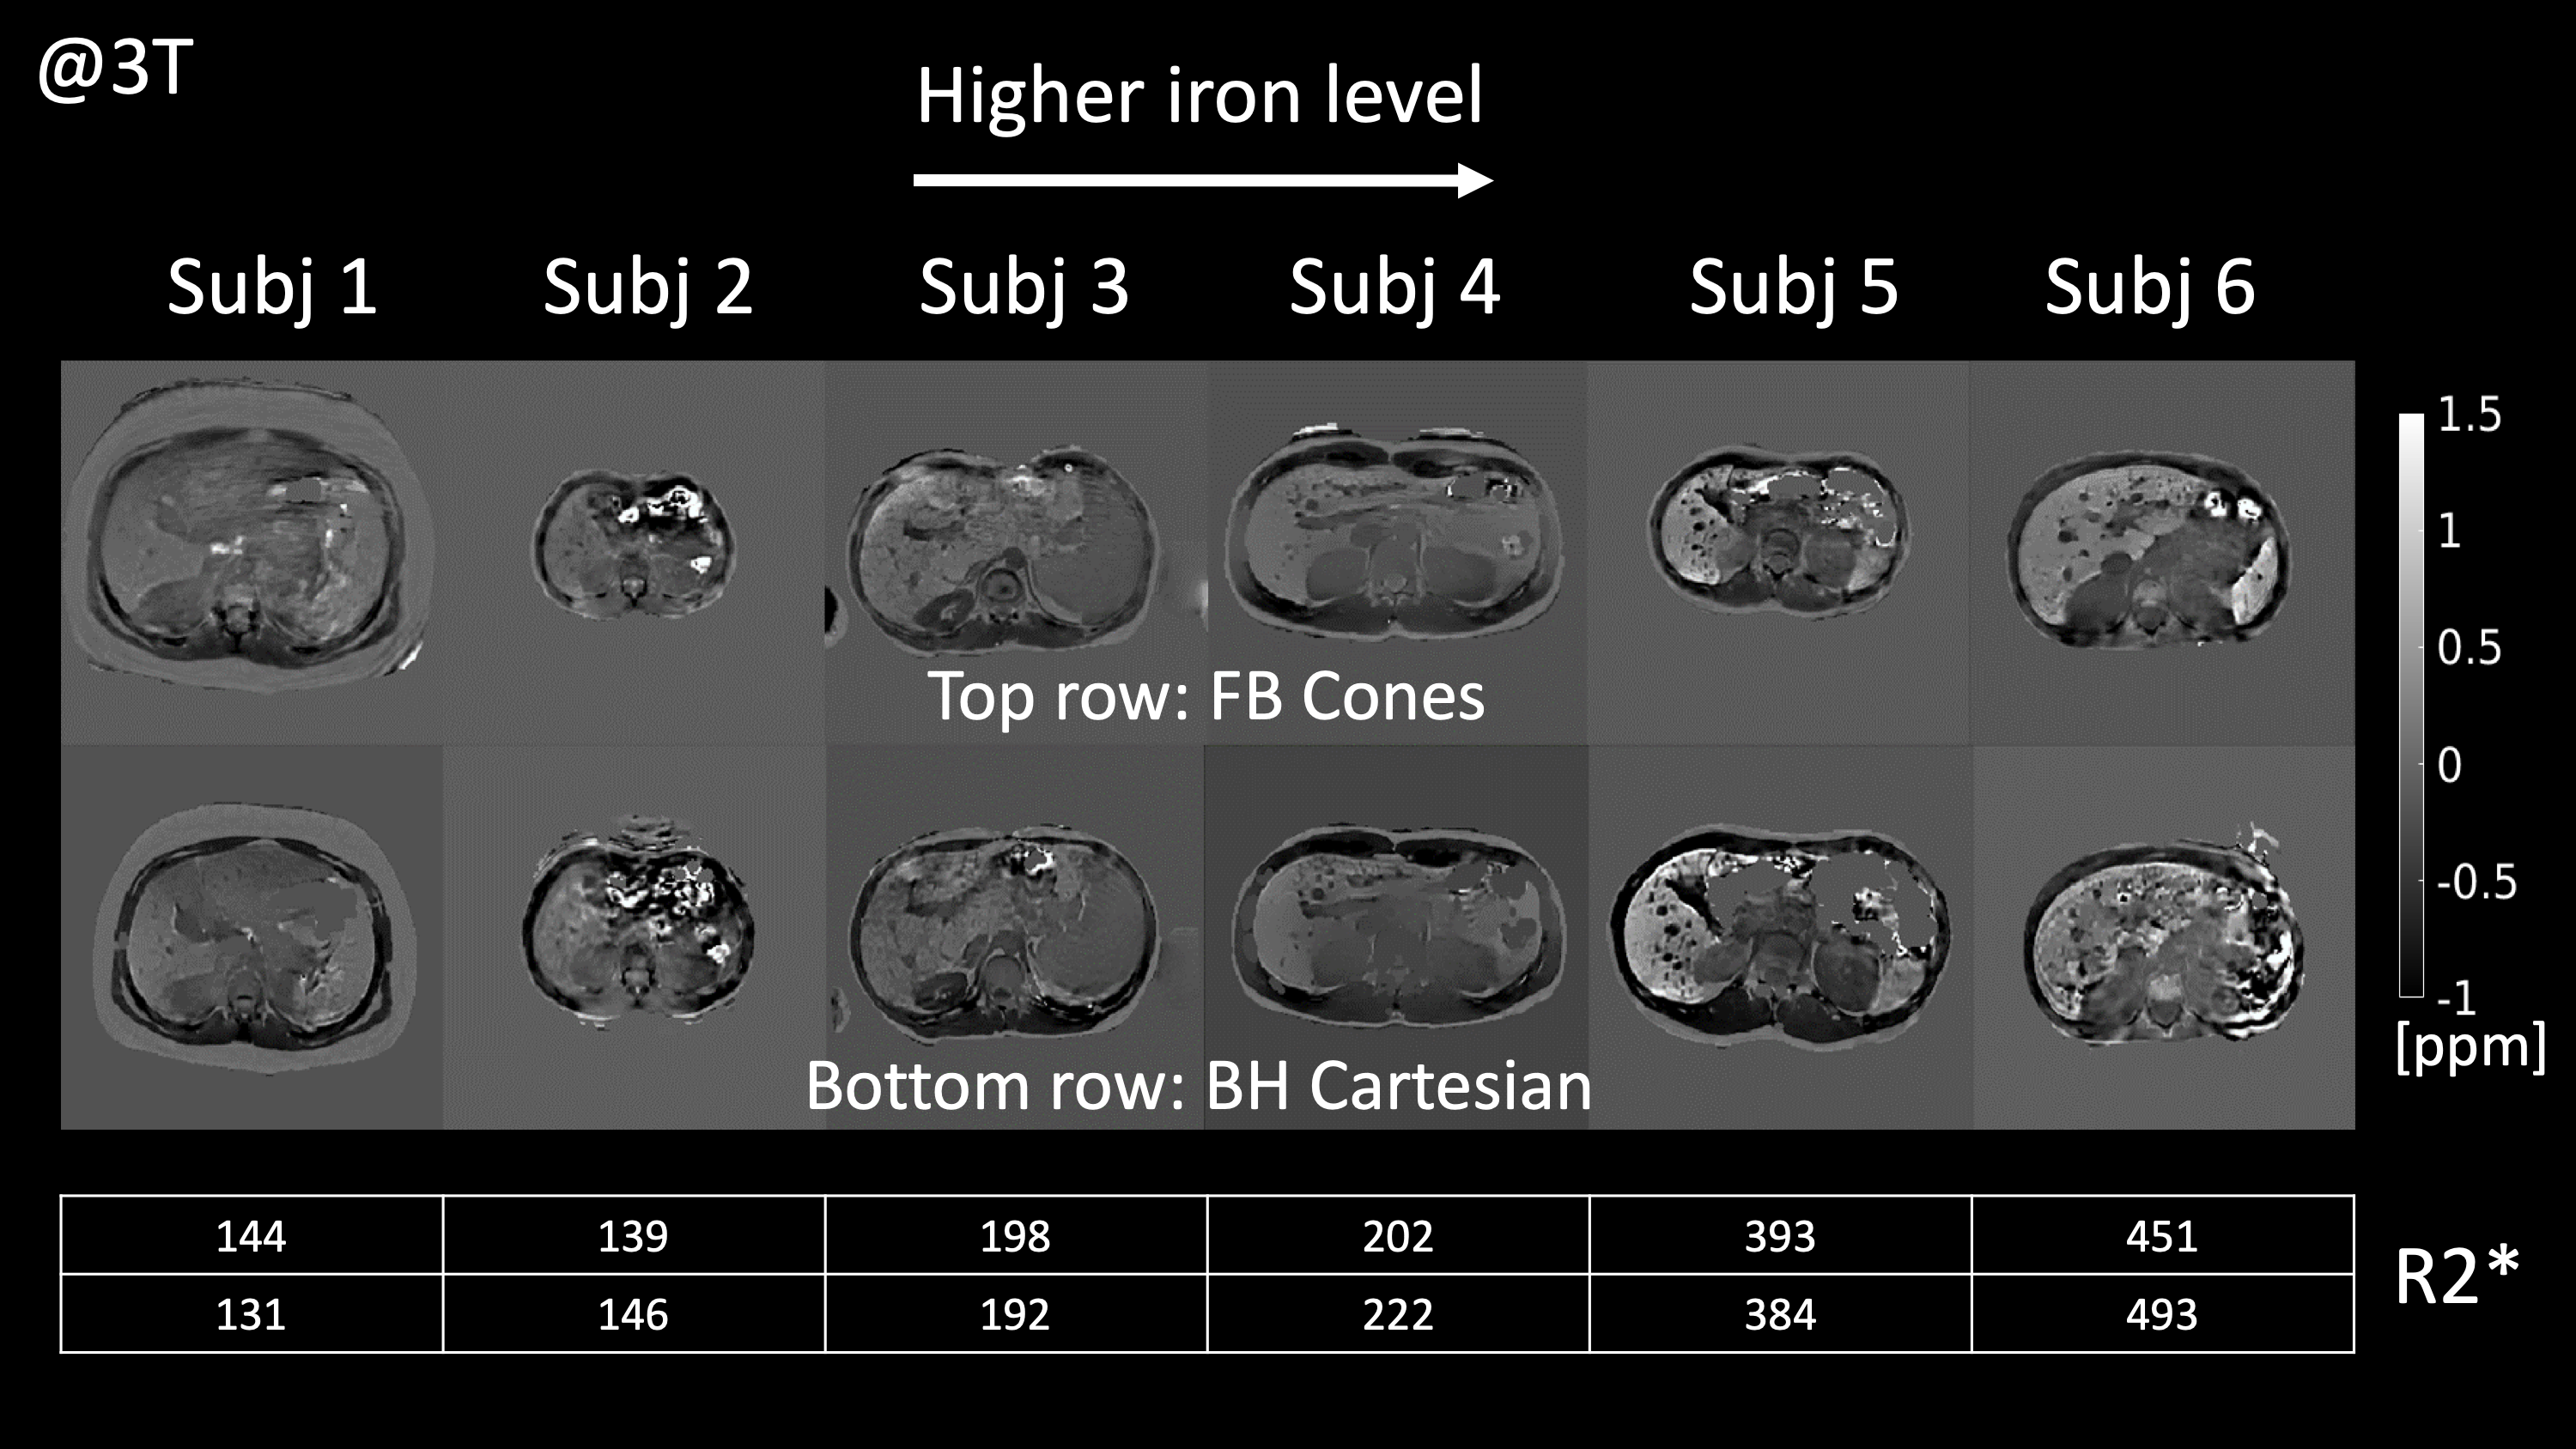
FB Cones and BH Cartesian exhibited similar image quality and contrast in QSM and R2* as shown in Fig. 3. ROI-based Bland-Altman plots and linear regression plots are shown in Fig. 4. Differences in R2* at 1.5T and 3T were all within 95% confidence interval from the mean difference (MD), suggesting good agreement between FB Cones and BH Cartesian across the range of 100-500 s-1 at 3T and 75-300 s-1 at 1.5T. Linear correlation analysis shows that R2* of FB Cones and BH Cartesian had a strong linear correlation within the range (R2 = 0.986). QSM of 6 subjects with different iron level (assessed by their R2*) is shown in Fig. 5, suggesting a good visual agreement with their iron level in R2*.Discussion
In this study, the feasibility of free-breathing QSM and R2* mapping using 3D multi-echo cones acquisition was demonstrated both at 1.5T and 3T clinical scanners. Although FB Cones showed good agreement with BH Cartesian, the current FB Cones has some limitations. First, FB Cones shows a wider range of spatial variation in R2* compared to BH Cartesian. The major sources of this variation may be eddy currents and aliasing through the slab-selective direction, which is the lowest resolution axis (6mm). This may be addressed by investigating the robustness of cones trajectory in isotropic and anisotropic resolution together with the slab profile of the RF pulse. Second, ROI-based analysis for QSM was not performed due to the current unoptimized QSM algorithm. This will be performed with carefully selected reference susceptibility typically in the subcutaneous fat. Lastly, typical imaging time of FB cones is currently ~4 min compared to ~19 sec in BH Cartesian. The FB Cones imaging time can be shortened by extending the cone readout durations to require significantly less TRs to satisfy the Nyquist criterion. Further acceleration may also be achieved through undersampling combined with parallel imaging and compressed sensing.Conclusion
Free-breathing QSM and R2* mapping of liver iron overload is feasible with a 3D multi-echo cones trajectory, showing good agreement with breath-held Cartesian. Further optimization for QSM and quantitative analysis of computed susceptibility are required.Acknowledgements
We thank Timothy Delhagen at Lucile Packard Children's Hospital for coordinating clinical schedules, and Catherine J. Moran, Frank Ong, Zhitao Li, John Pauly, and Dwight G. Nishimura at Stanford University for fruitful discussions. This work was supported by the R01DK100651, R01DK117354, and R01EB009690 NIH grants.
References
1. Sharma SD, Fischer R, Schoennagel BP, et al. MRI-based quantitative susceptibility mapping (QSM) and R2* mapping of liver iron overload: Comparison with SQUID-based biomagnetic liver susceptometry. Magn Reson Med. 2017 Jul;78(1):264-270.
2. Gurney PT, Hargreaves BA, Nishimura DG. Design and analysis of a practical 3D cones trajectory. Magn Reson Med. 2006 Mar;55(3):575-82.
3. Zucker EJ, Cheng JY, Haldipur A, et al. Free-breathing pediatric chest MRI: Performance of self-navigated golden-angle ordered conical ultrashort echo time acquisition. J Magn Reson Imaging. 2018 Jan;47(1):200-209.
4. Walsh DO, Gmitro AF, Marcellin MW. Adaptive reconstruction of phased array MR imagery. Magn Reson Med. 2000 May;43(5):682-90.
5. Hernando D, Kellman P, Haldar JP, Liang ZP. Robust water/fat separation in the presence of large field inhomogeneities using a graph cut algorithm. Magn Reson Med. 2010 Jan;63(1):79-90.
6. Liu T, Khalidov I, de Rochefort L, et al. A novel background field removal method for MRI using projection onto dipole fields (PDF). NMR Biomed. 2011 Nov;24(9):1129-36.
7. Liu J, Liu T, de Rochefort L, et al. Morphology Enabled Dipole Inversion for Quantitative Susceptibility Mapping Using Structural Consistency Between the Magnitude Image and the Susceptibility Map. Neuroimage. 2012 Feb 1; 59(3): 2560–2568.
8. Liu Z, Spincemaille P, Yao Y, et al. MEDI+0: Morphology enabled dipole inversion with automatic uniform cerebrospinal fluid zero reference for quantitative susceptibility mapping. Magn Reson Med. 2018 May;79(5):2795-2803.
Figures
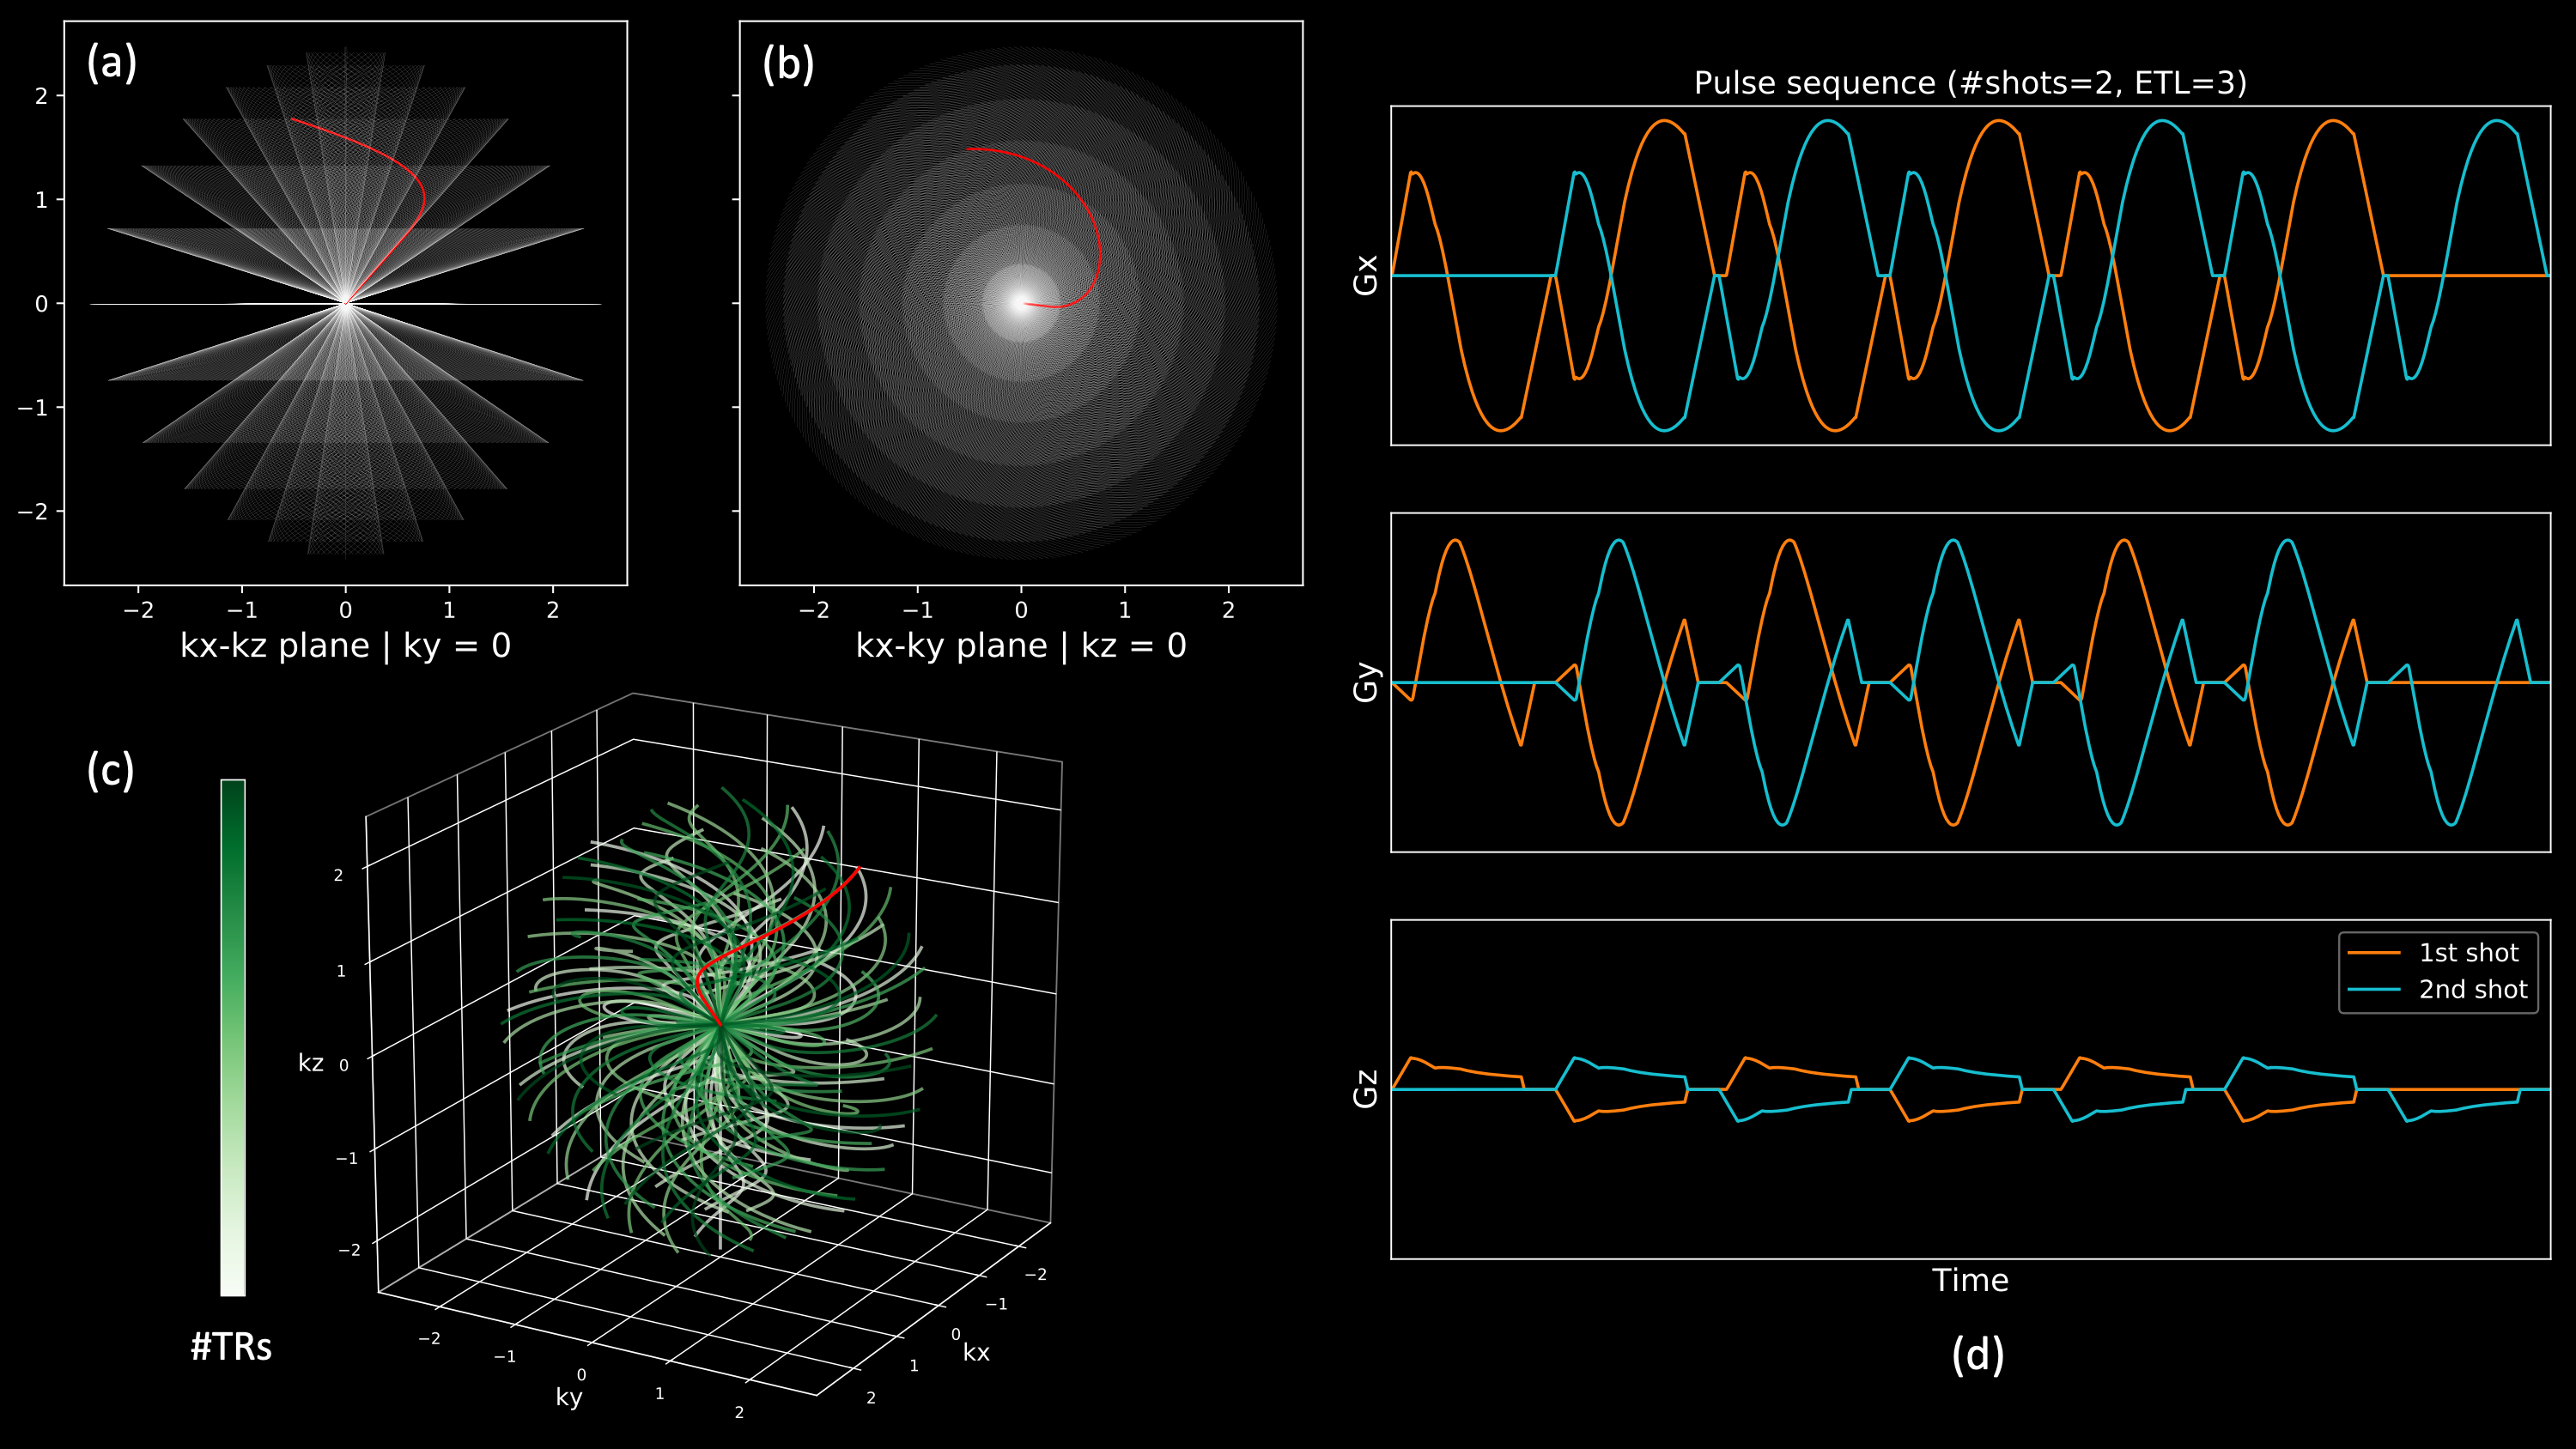
Fig. 1: 3D multi-echo cones trajectory with a golden-ratio re-ordering scheme. A set of conical surfaces is determined in k-space for a given FOV and resolution (a, b). Then, the number of cone interleaves is determined to meet the Nyquist sampling criterion, which traverse from the center of k-space along the conical surfaces. These cone interleaves are re-ordered with the golden-ratio (c). Multi-echo gradient waveforms for the red trajectory is shown in (d).
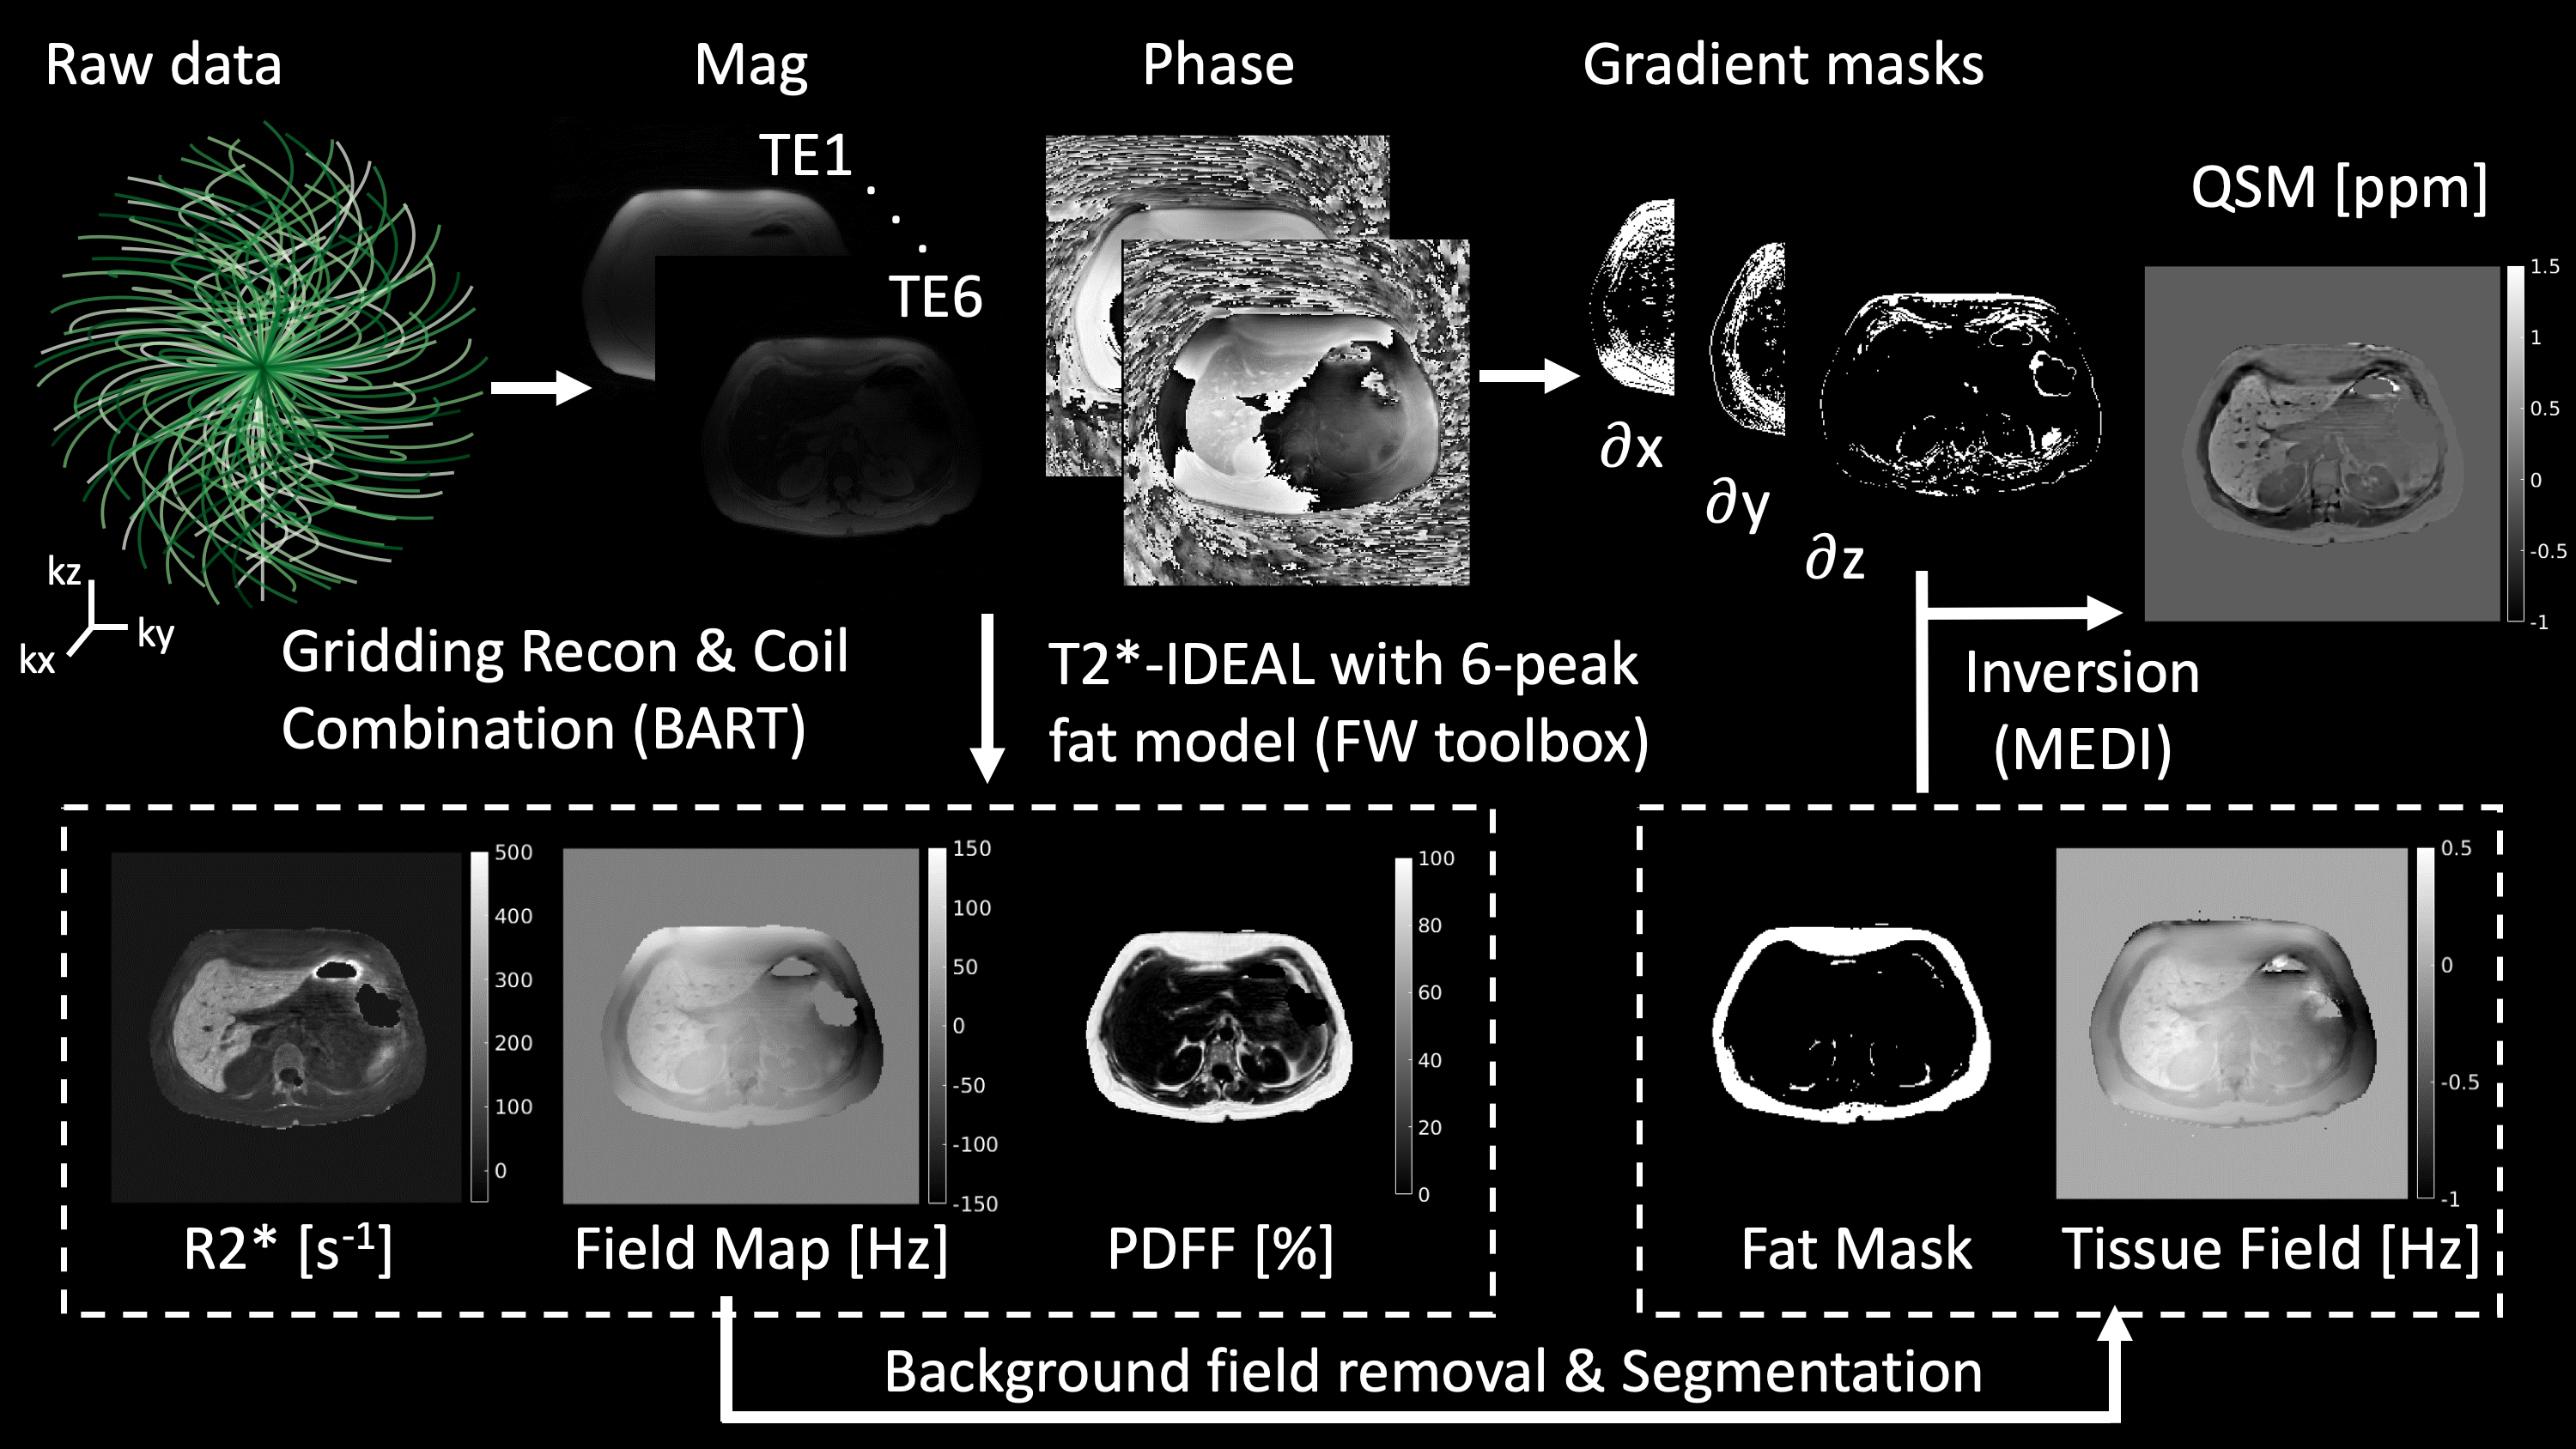
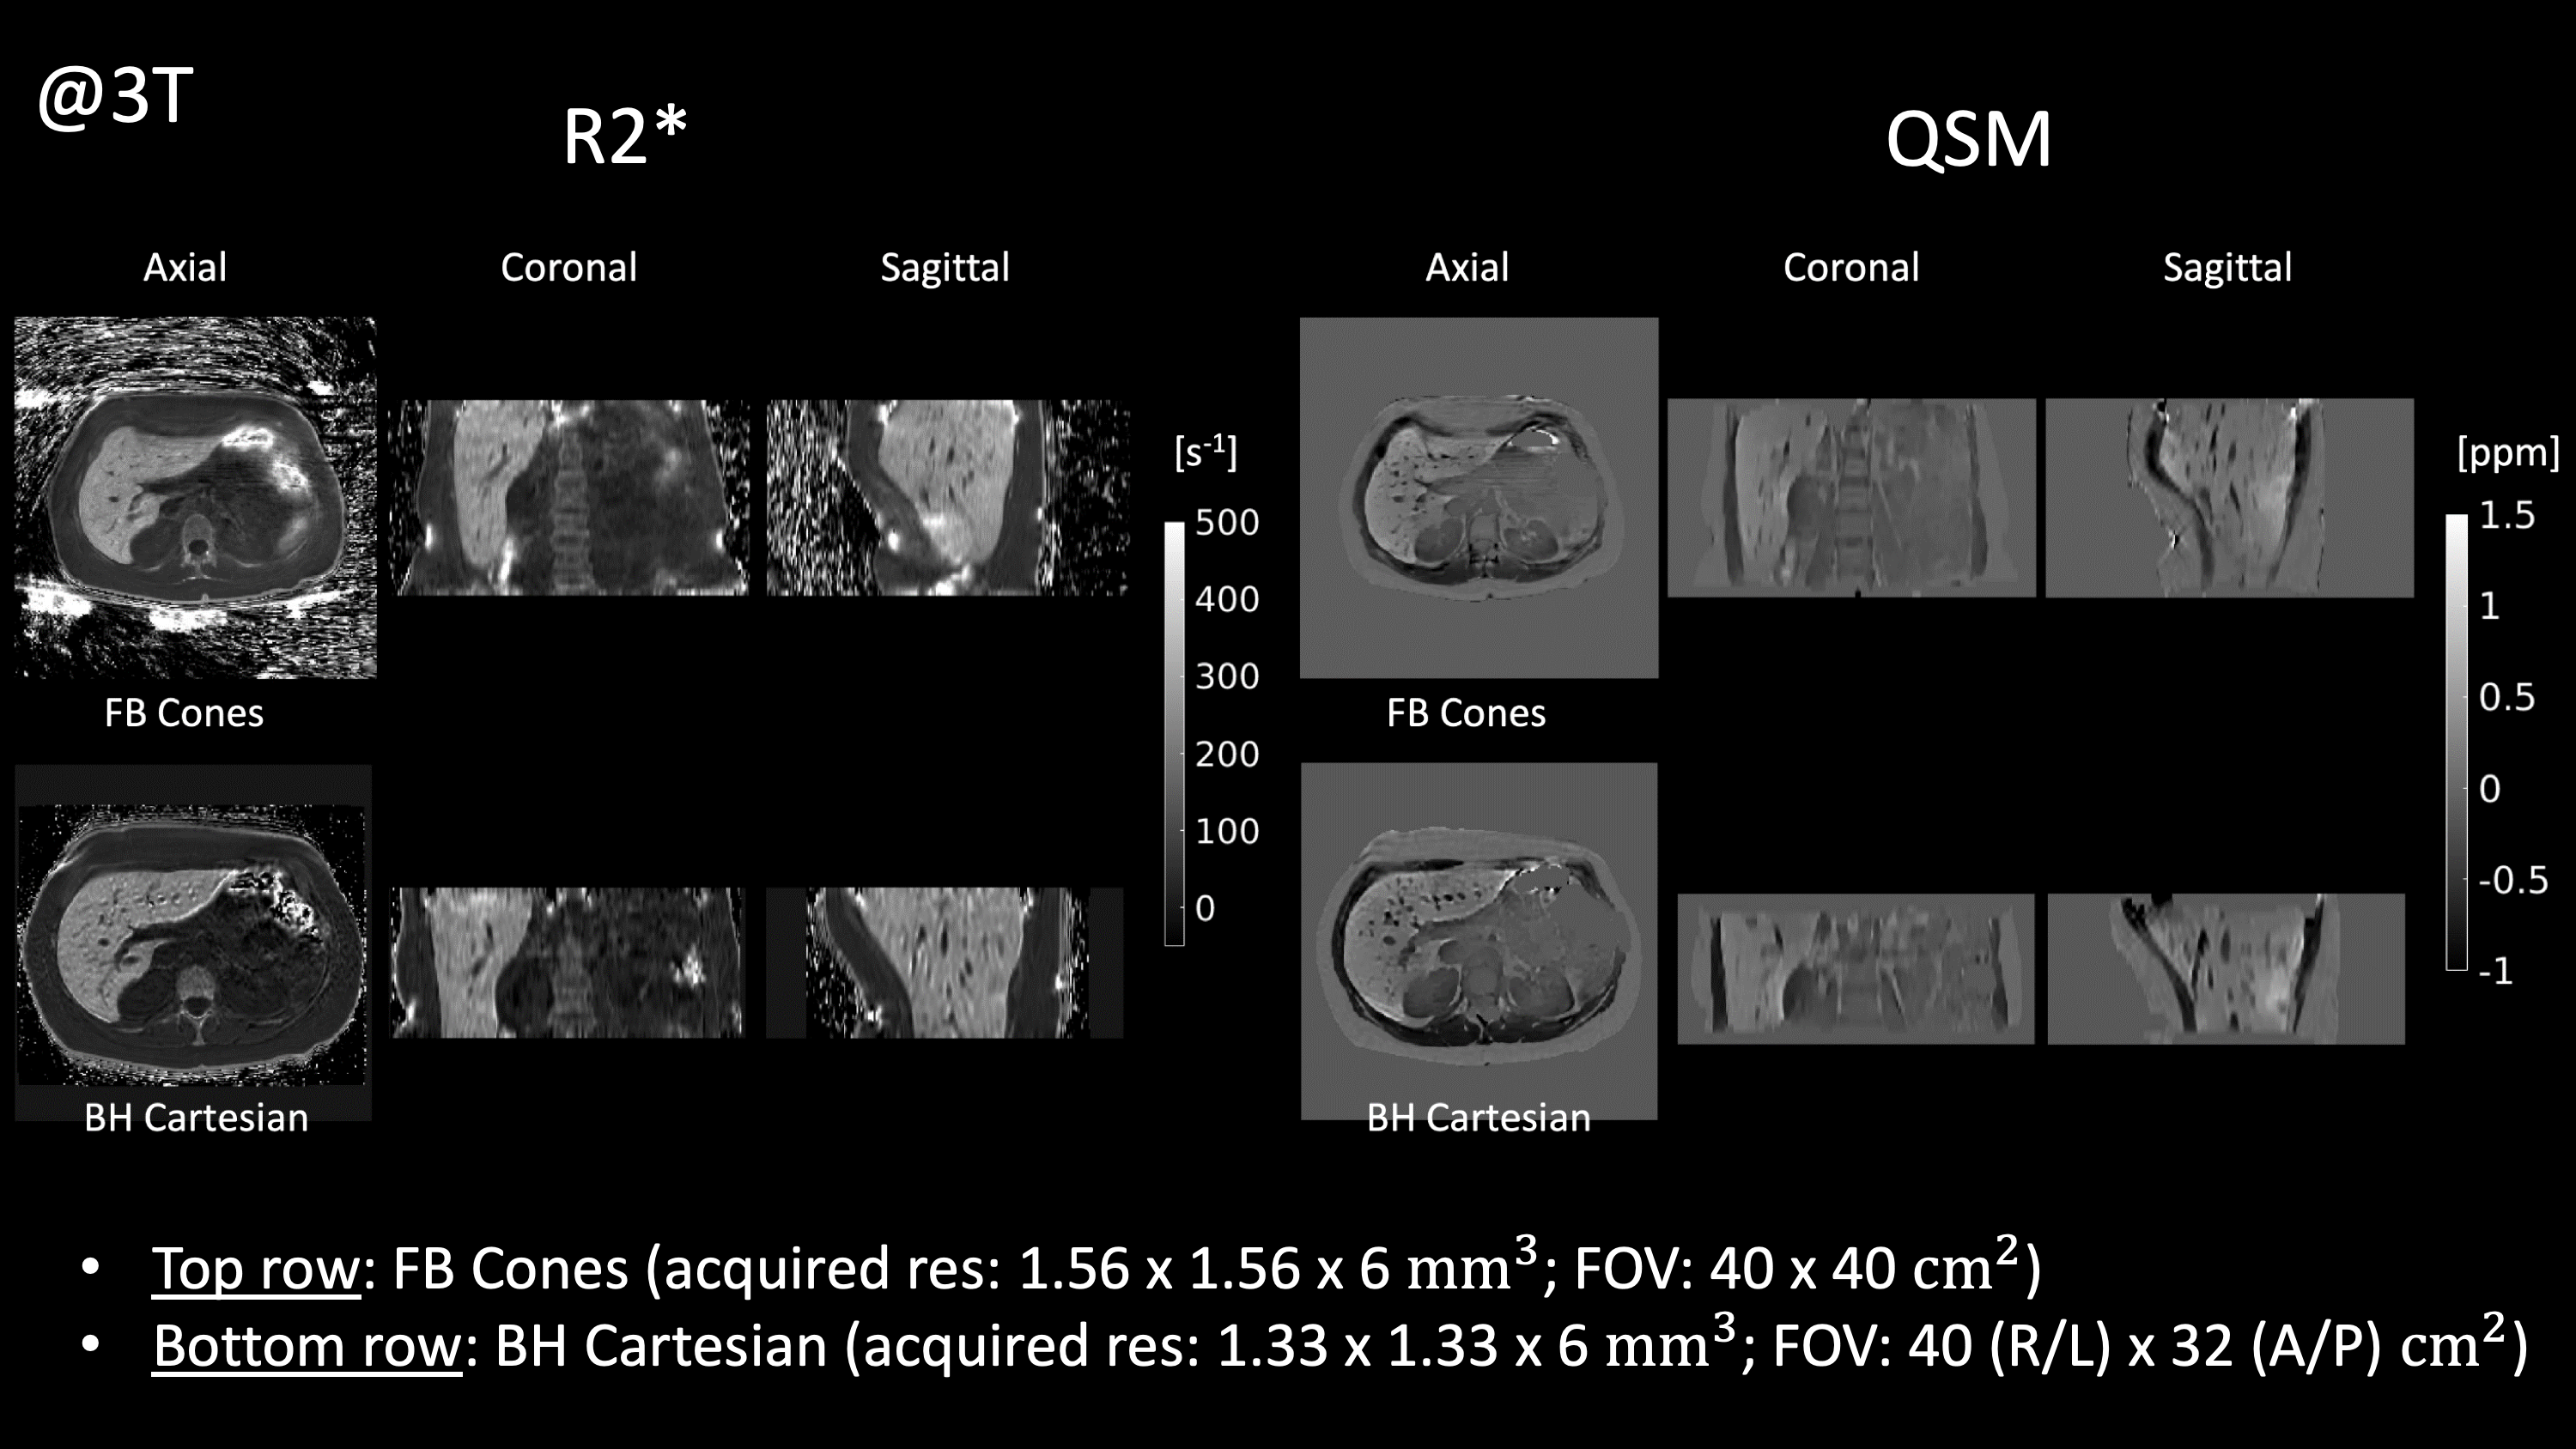
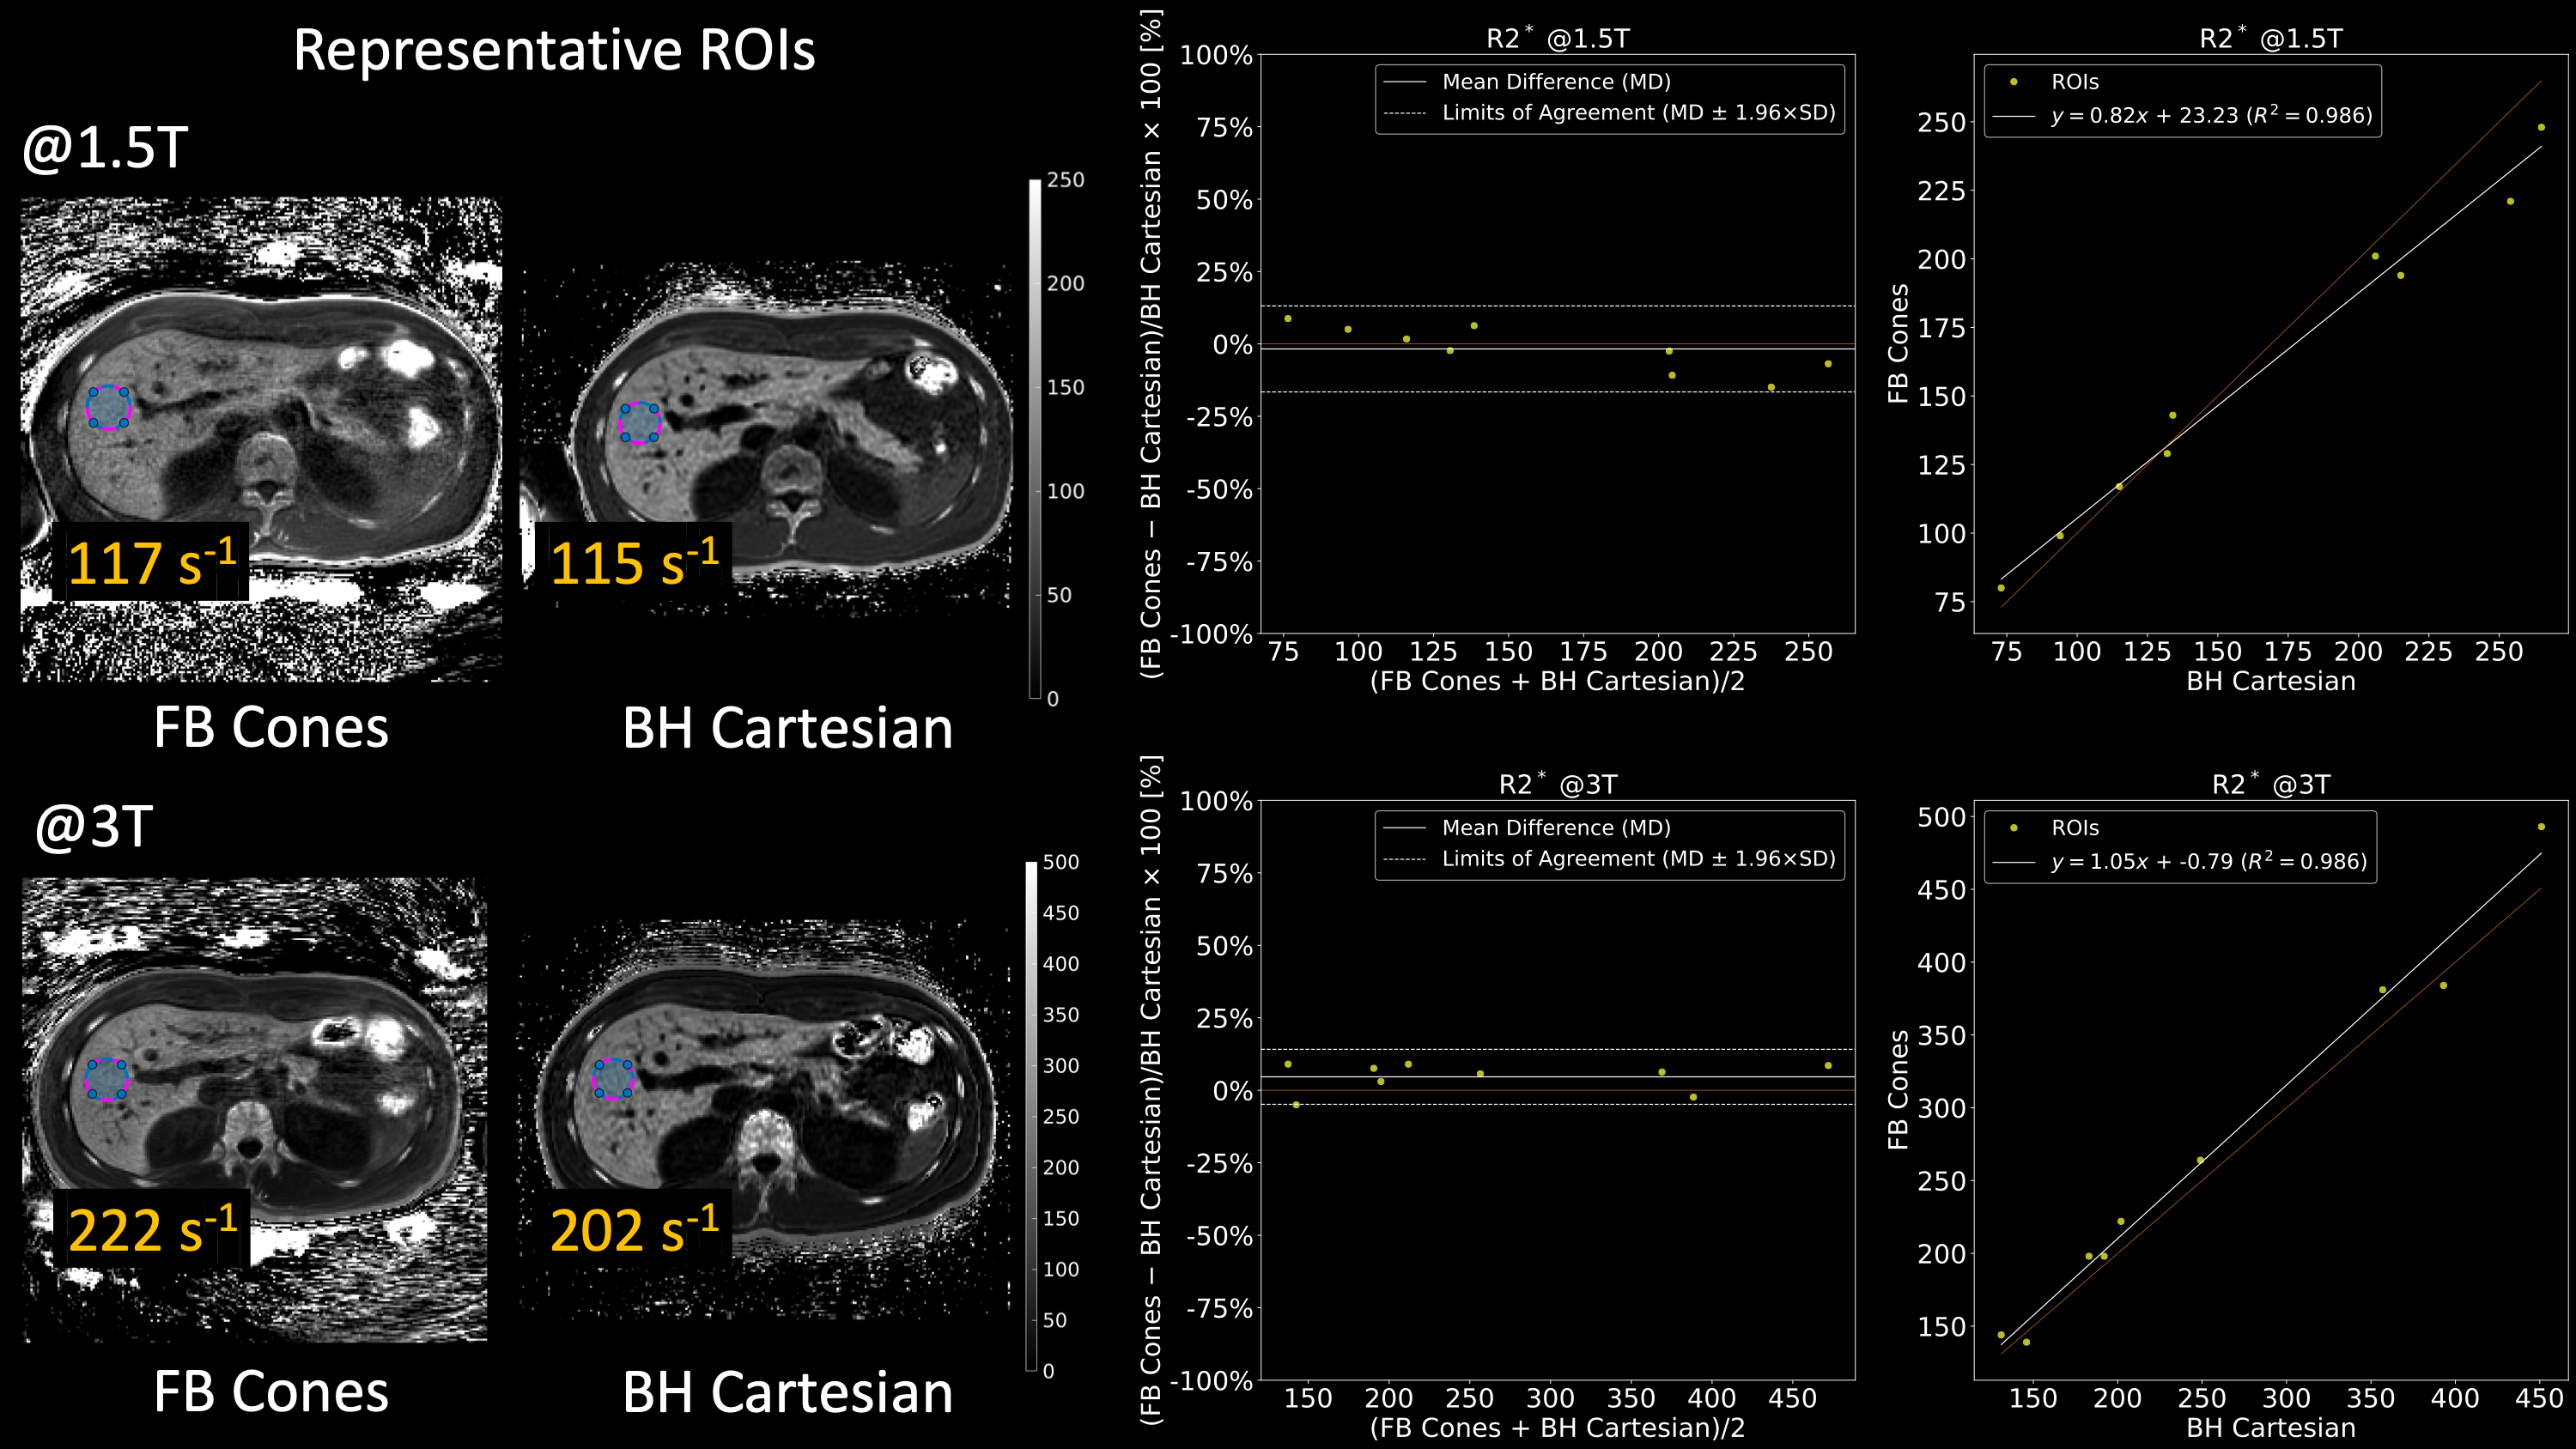
Fig. 4: Bland-Altman and linear correlation plots. R2* maps of a representative subject who underwent both 1.5T and 3T scanners are shown on the left with specified ROIs. On the right, ROI-based Bland-Altman plots with relative differences in percentage and linear correlation plots between FB Cones and BH Cartesian are shown.