2526
Quantitative analysis with T2 mapping in the differentiation between uterine submucous myoma and endometrial polyps1Xiamen Branch, Zhongshan Hospital, Fudan University, Xiamen, China, 2MR Research China, GE Healthcare, Beijing, China
Synopsis
It is challenging to differentiate between uterine submucous myoma and endometrial polyps, due to a high similarity of their manifestations in conventional MRI. Meanwhile, T2 mapping is an objective and stable technique which has been applied to diagnosis of many diseases. Here we evaluate the value of quantitative measurements derived from T2 mapping and DWI in differentiating between uterine submucous myoma and polyps. We found a descending order of T2 values from healthy endometrium, endometrial polyp to submucous myoma group. We concluded that T2 mapping can be used as a quantitative tool in the differentiation between submucous myoma and polyps.
Introduction
With the rapid development of magnetic resonance imaging (MRI) technologies and big data era, the diagnosis of lesions is no longer limited to imaging manifestations, and can benefit from the quantitative measurements[1]. As one of the MR quantitative technologies, T2 mapping is objective, reproductive and stable. It has been applied to a number of diseases including prostate tumors, breast tumors, and uterine endometrial carcinoma[2-5], except osteoarthritis and myocardial edema. This study aimed to explore the value of quantitative measurements derived from T2 mapping with eight echo time and DWI with three b values in the differentiation between uterine submucous myoma and polyps.Methods
Twelve healthy adults, twelve patients with uterine submucous myoma, and fifteen patients with endometrial polyps confirmed by pathological results were enrolled in this study after getting institutional review board approval. All participants underwent contrast enhanced MR examinations including routine T1-weighted imaging (T1WI) and T2-weighted imaging (T2WI) acquisitions, T2 mapping (TR=1500, eight TE: 9.1 to 72.6 ms, step by 9.05 ms) and DWI (three b values: 0, 50, 800 s/mm2) acquisitions on a 3.0T MR scanner (GE Discovery MR750w, GE Healthcare, Milwaukee, WI, USA). T2 relaxation value was calculated by exponential fitting using the Levenberg-Marquardt algorithm implemented in MATLAB ( MathWorks, Natick, MA, USA). Apparent diffusion coefficient (ADC) value was acquired on GE AW4.6 Workstation. T2 relaxation values and ADC values in a total of 50 ROIs (submucous myoma: n = 14, polyps: n = 15, healthy endometrium: n = 12) were then extracted. Mann-Whitney U test was used to compare the mean value difference of each parameter between endometrial polyps and healthy endometrium, and between endometrial polyps and uterine submucous myoma. In additional, receiver operating characteristic (ROC) analysis was used to assessed the diagnostic performance of each parameter in differentiating between endometrial polyps and uterine submucous myoma by the area under the curve (AUC).Results
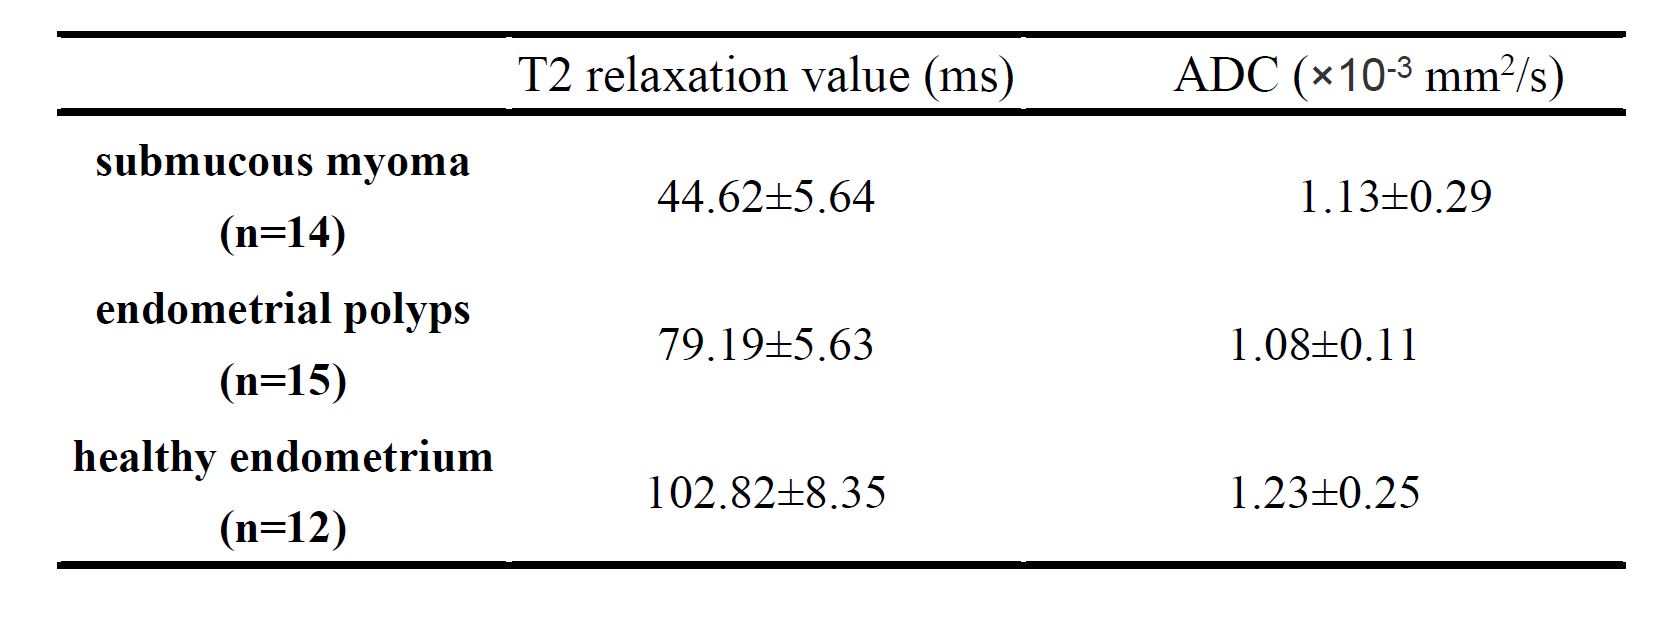
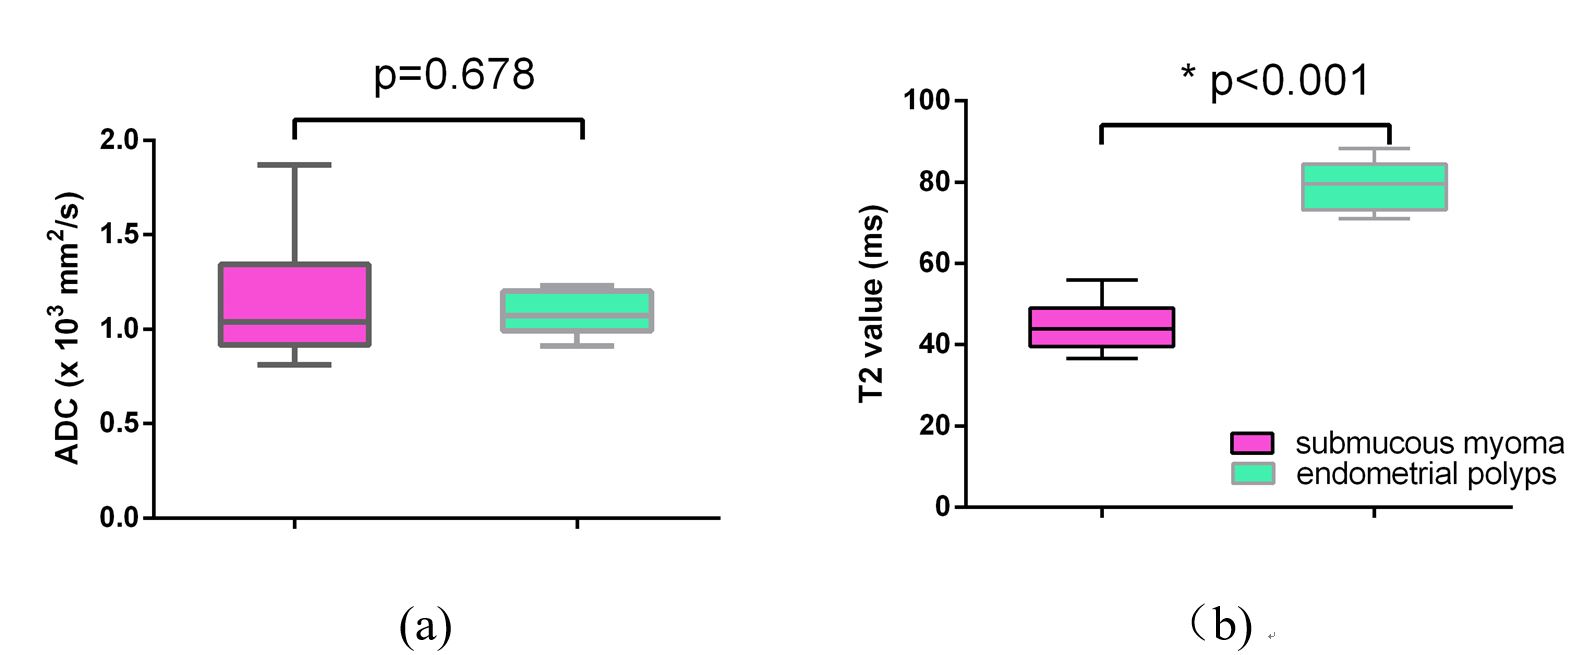
We found that T2 values in endometrial polyps group (79.19±5.63 ms) were significant higher than those in uterine submucous myoma group (44.62±5.63 ms), while no significant difference was found between their ADC values (1.08±0.11 ×10⁻³ mm2/s vs. 1.13±0.29 ×10⁻³ mm2/s)(Table 1 and Figure 1). In the comparison between healthy endometrium group and endometrial polyps group, T2 and ADC values in the former group (102.82±8.35 ms, 1.23±0.25 ×10⁻³ mm2/s) were both significantly higher than those in the latter group (p<0.05)(Table 1 and Figure 1). In the ROC analysis, the AUC of T2 and ADC values were 0.98 and 0.582 respectively, and were significantly different (p<0.05). The sensitivity and specificity of T2 value were 99% and 96.5% respectively in differentiating between endometrial polyps group and uterine submucous myoma group.Discussion
Uterine submucous myoma was a kind of myoma that protrudes into the uterine cavity, while endometrial polyp was caused by local hyperplasia of the endometrium. In current clinical routine, it is still challenging to differentiate between these two kind of diseases, due to a high similarity of their manifestations in conventional MRI. In theory, the T2 value is mainly affected by the content of water in tissues. The water content of uterine myoma was much lower than that of endometrium histologically. Our results corroborated with this histological fact by showing a descending order of T2 values from healthy endometrium group, endometrial polyp group to submucous myoma group. DWI is based on the diffusion characteristics of water molecules, reflecting the diffusivity of water molecules in tissue. When the diffusion of water molecules was limited due to some causes, the ADC value of the tissue was decreased. In our study, the ADC value offered by DWI had difficulty in distinguishing endometrial polyp from submucous myoma, suggesting that the diffusivity of water molecules in these two groups were similar.Conclusion
Overall, we demonstrated that T2 mapping can be used as a quantitative tool in the differentiation between submucous myoma and polyps, and can be a compensation to the conventional MRI.Acknowledgements
No acknowledgement found.References
[1]. Garcia-Reyes K, Passoni NM, Palmeri ML, et al. Detection of prostate cancer with multiparametric MRI(mpMRI): effect of dedicated reader education on accuracy and cofidence of index and anterior cancer diagnosis. Abdom Imaging 2015;40:134–142.
[2]. Van Houdt PJ, Agarwal HK, van Buuren LD, et al. Performance of a fast and high-resolution multi-echo spin-echo sequence for prostate T2 mapping across multiple systems. Magn Reson Med 2018;79:1586-1594.
[3]. Liu L, Yin B, Shek K, et al. Role of quantitative analysis of T2 relaxation time in differentiating benign from malignant breast lesions. Int Med Res, 2018, 46(5): 1928-1935.
[4]. Ghosh A, Singh T, Bagga R, et al. T2 relaxometry mapping in demonstrating layered uterine architecture: parameter optimisation and utility in endometrial carcinoma and adenomyosis: A feasibility study. Br J Radiol, 2017, 91(1081):20170377.
[5]. Yamada I , Yoshino N , Hikishima K , et al. Colorectal carcinoma: Ex vivo evaluation using 3-T high-spatial-resolution quantitative T2 mapping and its correlation with histopathologic findings. Magnetic Resonance Imaging, 2017, 38:174-181.
Figures