2524
Can T2 mapping be used to differentiate endometrial cancer from benign lesion?1radiology, shandong provincial hospital, JINAN, China, 2shandong provincial hospital, JINAN, China, 3shandong provincial hospital, jinan, China, 4MR Scientific Marketing,Diagnostic Imaging, Siemens Healthcare Ltd, beijing, China
Synopsis
This study aimed to investigate the feasibility of T2 mapping in differentiating endometrial cancer (ECA) from benign endometrial lesions (BEL), as well as to evaluate the histopathological stages, grades and types of ECA.We measured the mean T2 values of 51 endometrial cancer,12 benign endometrial lesions and 23 normal endometrium of volunteers.We found the mean T2 values were signifcantly different among ECA, BEL and normal volunteers, and could be used to distinguish different types of ECA, but could not distinguish different stages or grades of ECA.
Synopsis
This study aimed to investigate the feasibility of T2 mapping in differentiating endometrial cancer (ECA) from benign endometrial lesions (BEL), as well as to evaluate the histopathological stages, grades and types of ECA.We measured the mean T2 values of 51 endometrial cancer,12 benign endometrial lesions and 23 normal endometrium of volunteers.We found the mean T2 values were signifcantly different among ECA, BEL and normal volunteers, and could be used to distinguish different types of ECA, but could not distinguish different stages or grades of ECA.Introduction
The purpose of this study was to investigate whether the T2 mapping could be used to differentiate endometrial cancer (ECA) from benign endometrial lesions (BEL), as well as to assess the aggressiveness, including histopathological stages, grades and types, of ECA.Method
Sixty-three patients (ECA, 51; BEL, 12) and 23 normal volunteers were included in this study. Data were collected on a whole-body 3T MR scanner (MAGNETOM Verio, Siemens Healthcare, Erlangen, Germany) with eight-channel phased-array surface body coil and integrated spinal coils. The sagittal T2 mapping were performed using multi-echo turbo spin echo (TSE) prior to dynamic contrast enhancement (DCE) imaging, with the following parameters of repetition time (TR), 1500 ms; echo time (TE), 20, 40, 60, 80 and 100 ms; field of view (FOV), 20cm×20cm, matrix, 256×256; slice thickness, 3 mm; slice gap, 0.6 mm; acquisition time, 4min 8s. The mean T2 values were compared among ECA, BEL and normal endometrium (NE). The mean T2 values of type I and II ECA were also compared. The receiver operator curve (ROC) analysis and Youden index was calculated to distinguish different types of ECA. The relationship between mean T2 values of ECA and pathological characteristics was analyzed.Result
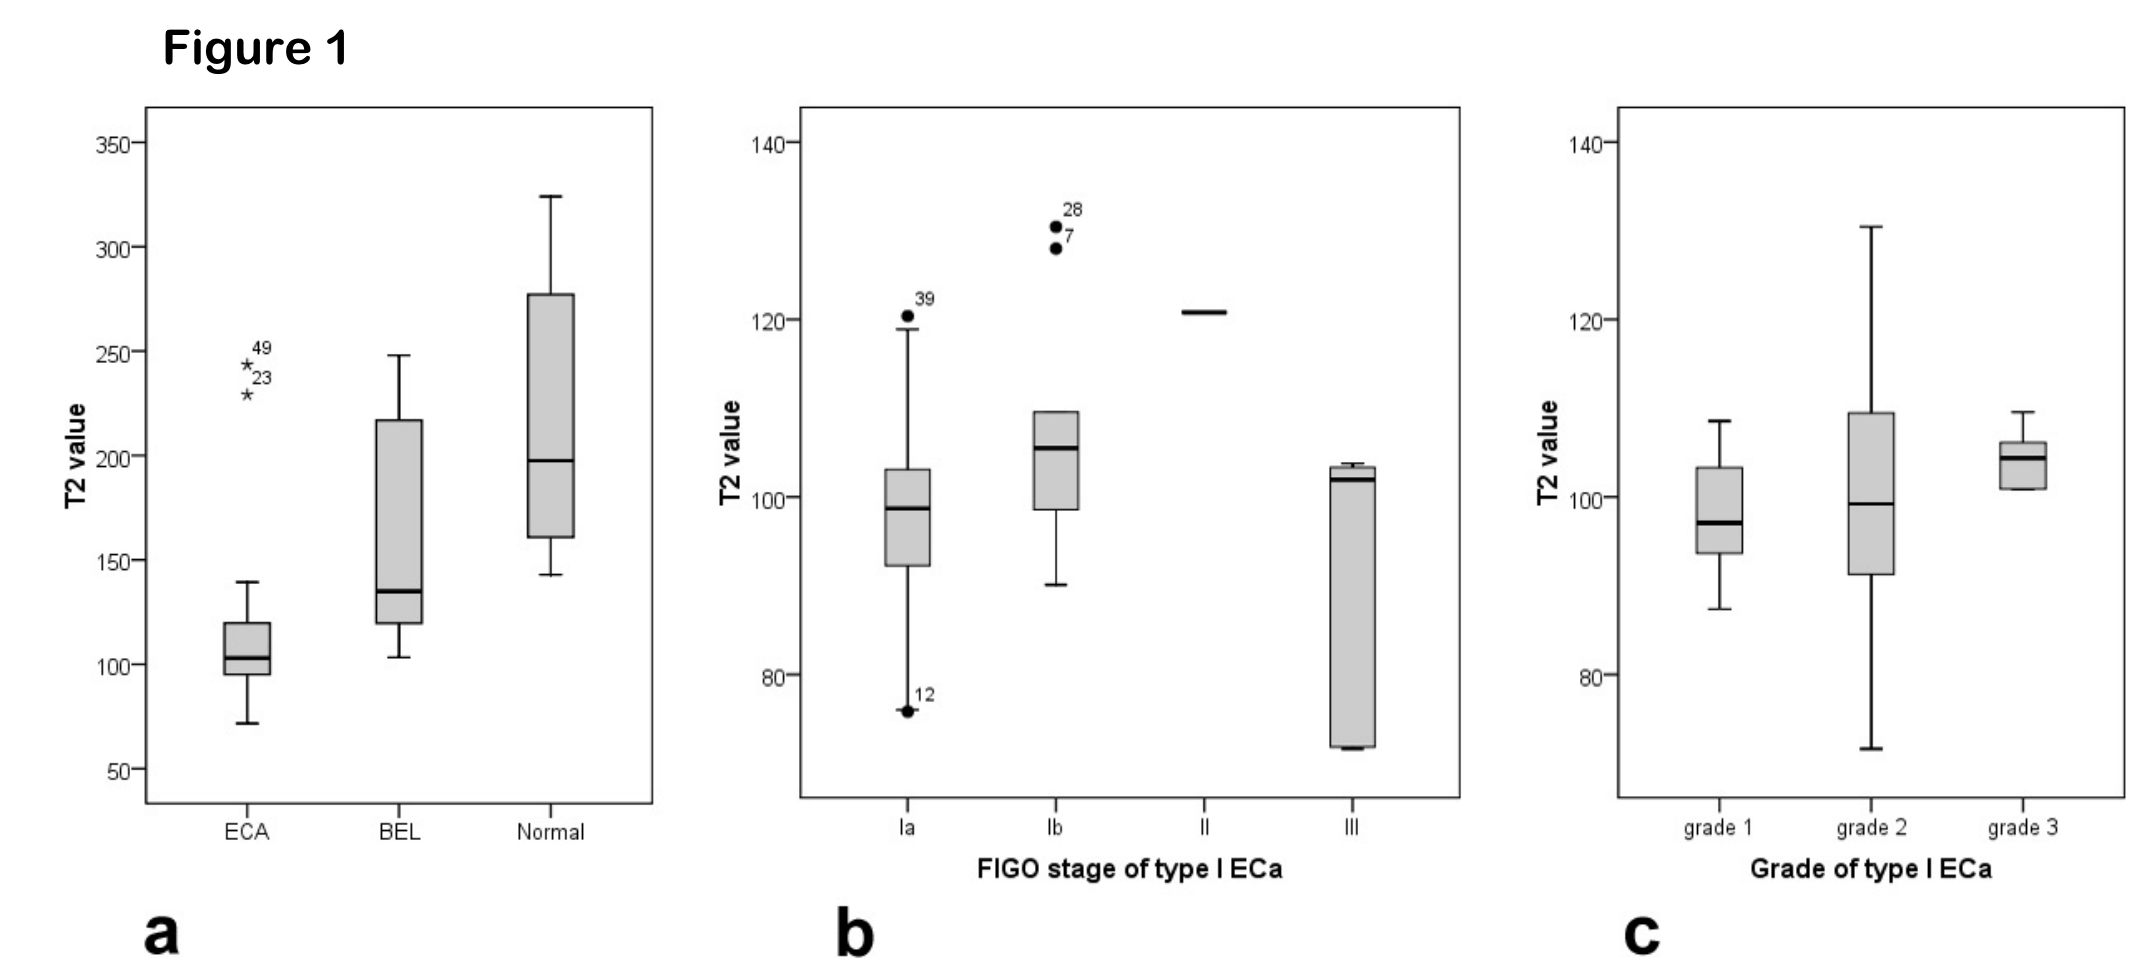
Figure 1 shows that the mean T2 values of ECA, BEL and NE were 109.6±30.2 ms, 162.7± 54.5 ms and 213.1 ±62.3 ms (P<0.001), respectively. The mean T2 values of type I ECA (100.2±13.6 ms) were significantly lower than those of type II ECA (148.0±47.0 ms) (P=0.011). The area under the curve (AUC) from ROC analysis was 0.959. When the threshold of T2 value was selected as 119.3 ms, the sensitivity and specificity of discriminating type II and type I ECA were 0.902 and 1 (see Figure 2), respectively. Different stages (P=0.091) or grades (P=0.686) show no statistical differences among ECA, BEL and NE.Discussion
In recent studies, some quantitative parameters could be used distinguish ECA from benign lesions and identify different types of ECA and different FIGO staging. In our previous study, Jiezhang et al. found Mean Cho/water from MR spectroscopy could differentiate ECA from benign lesions and the type of ECA, and they found Cho/water was positively correlated with the FIGO stage of ECA [1]. Takayama Y et al found that the APT signal intensity was positively correlated with the histologic grades of endometrial adenocarcinoma [2]. Nougaret S et al. reported the combination of whole tumor volume and ADC can be used to predict tumor grade, lymphovascular invasion, and depth of myometrial invasion [3]. However, there were no reports to identify ECA or to study its invasiveness with T2 values. Our study prospectively investigated ECA with T2 mapping, and obtained significant results.The mean T2 value could differentiate ECA, BEL and NE. It is also feasible in indentification between type II and type I ECA. However, it is incapable to differentiate different stages or grades of ECA.
Acknowledgements
This study has received funding by Primary Research & Development Plan of Shandong Province (No. 2016GSF201095).References
1. Zhang J, Cai S, Li C et al (2014) Can magnetic resonance spectroscopy differentiate endometrial cancer? Eur Radiol 24:2552–2560.
2. Takayama Y, Nishie A, Togao O, et al (2018) Amide Proton Transfer MR Imaging of Endometrioid Endometrial Adenocarcinoma: Association with Histologic Grade. Radiology 286:909-917.
3. Yue W, Meng N, Wang J et al (2019) Comparative analysis of the value of diffusion kurtosis imaging and diffusion-weighted imaging in evaluating the histological features of endometrial cancer. Cancer Imaging 19:9.
Figures