2521
Clinical value of N-acetyl mucinous compounds and lipid peaks in differentiating benign and malignant ovarian mucinous tumors by MR spectroscopy1Department of Radiology, Tokushima University, Tokushima, Japan, 2Department of Radiological Technology, Tokushima Bunri University, Sanuki-city, Japan
Synopsis
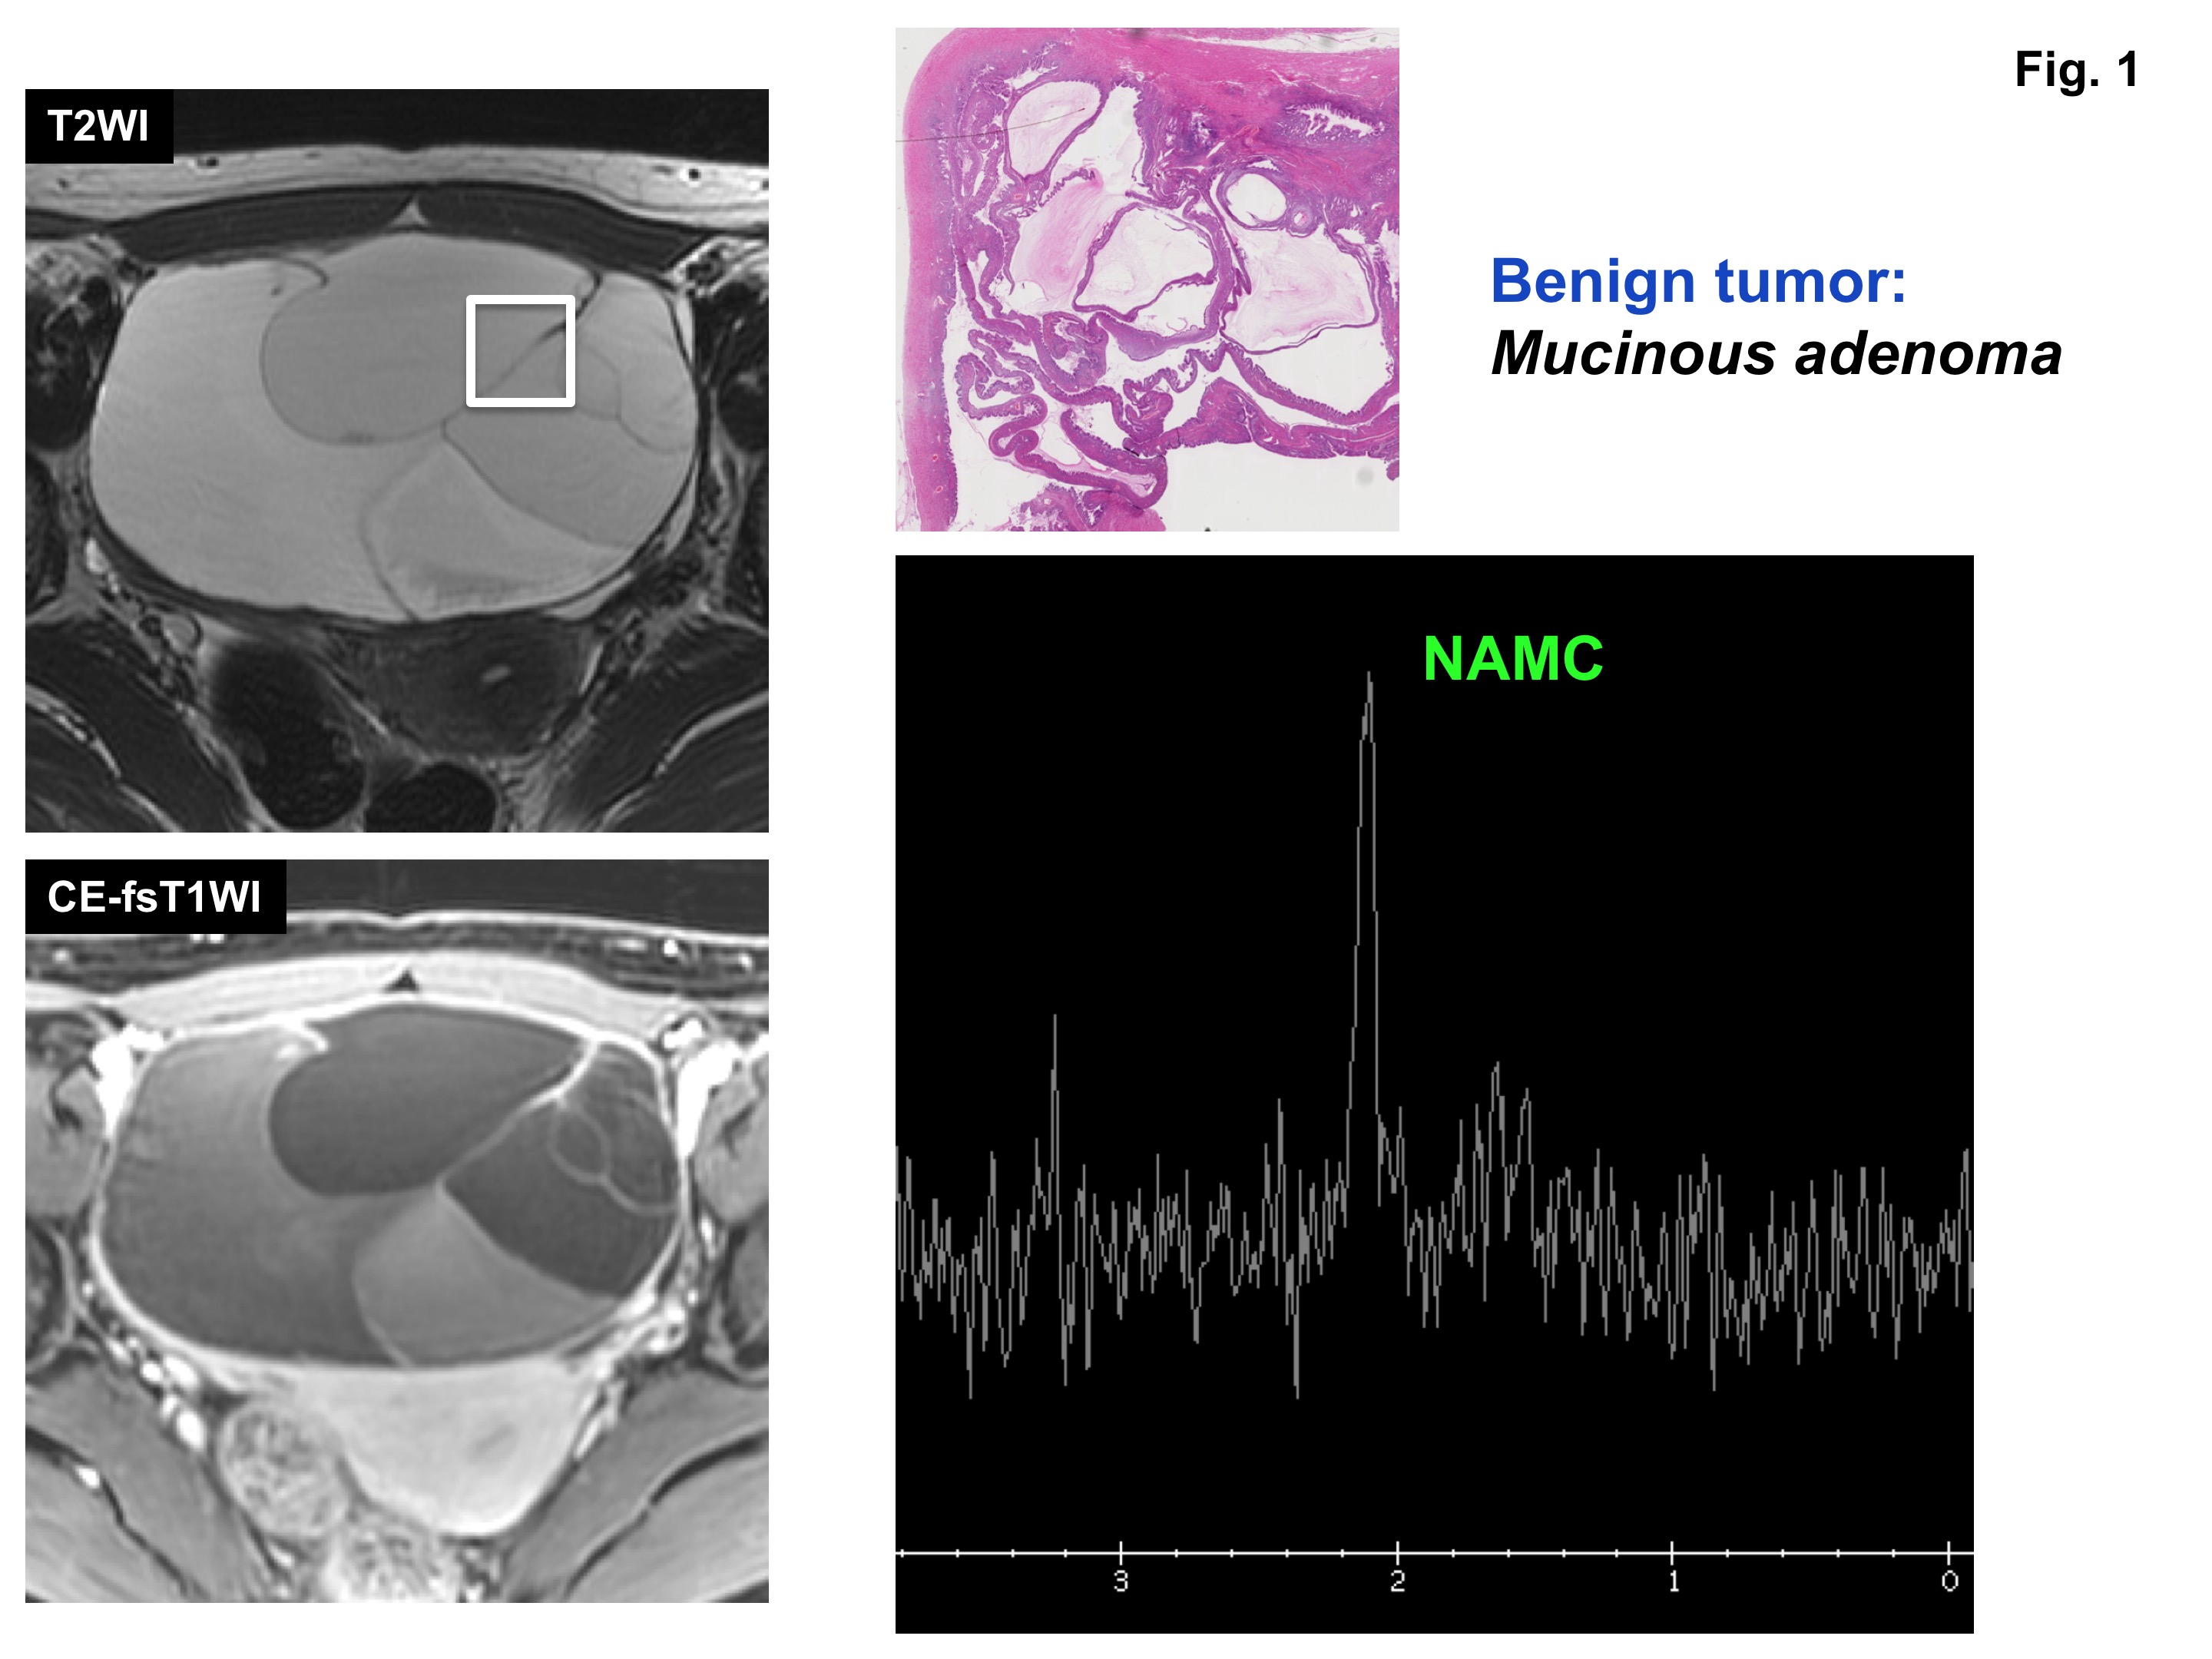
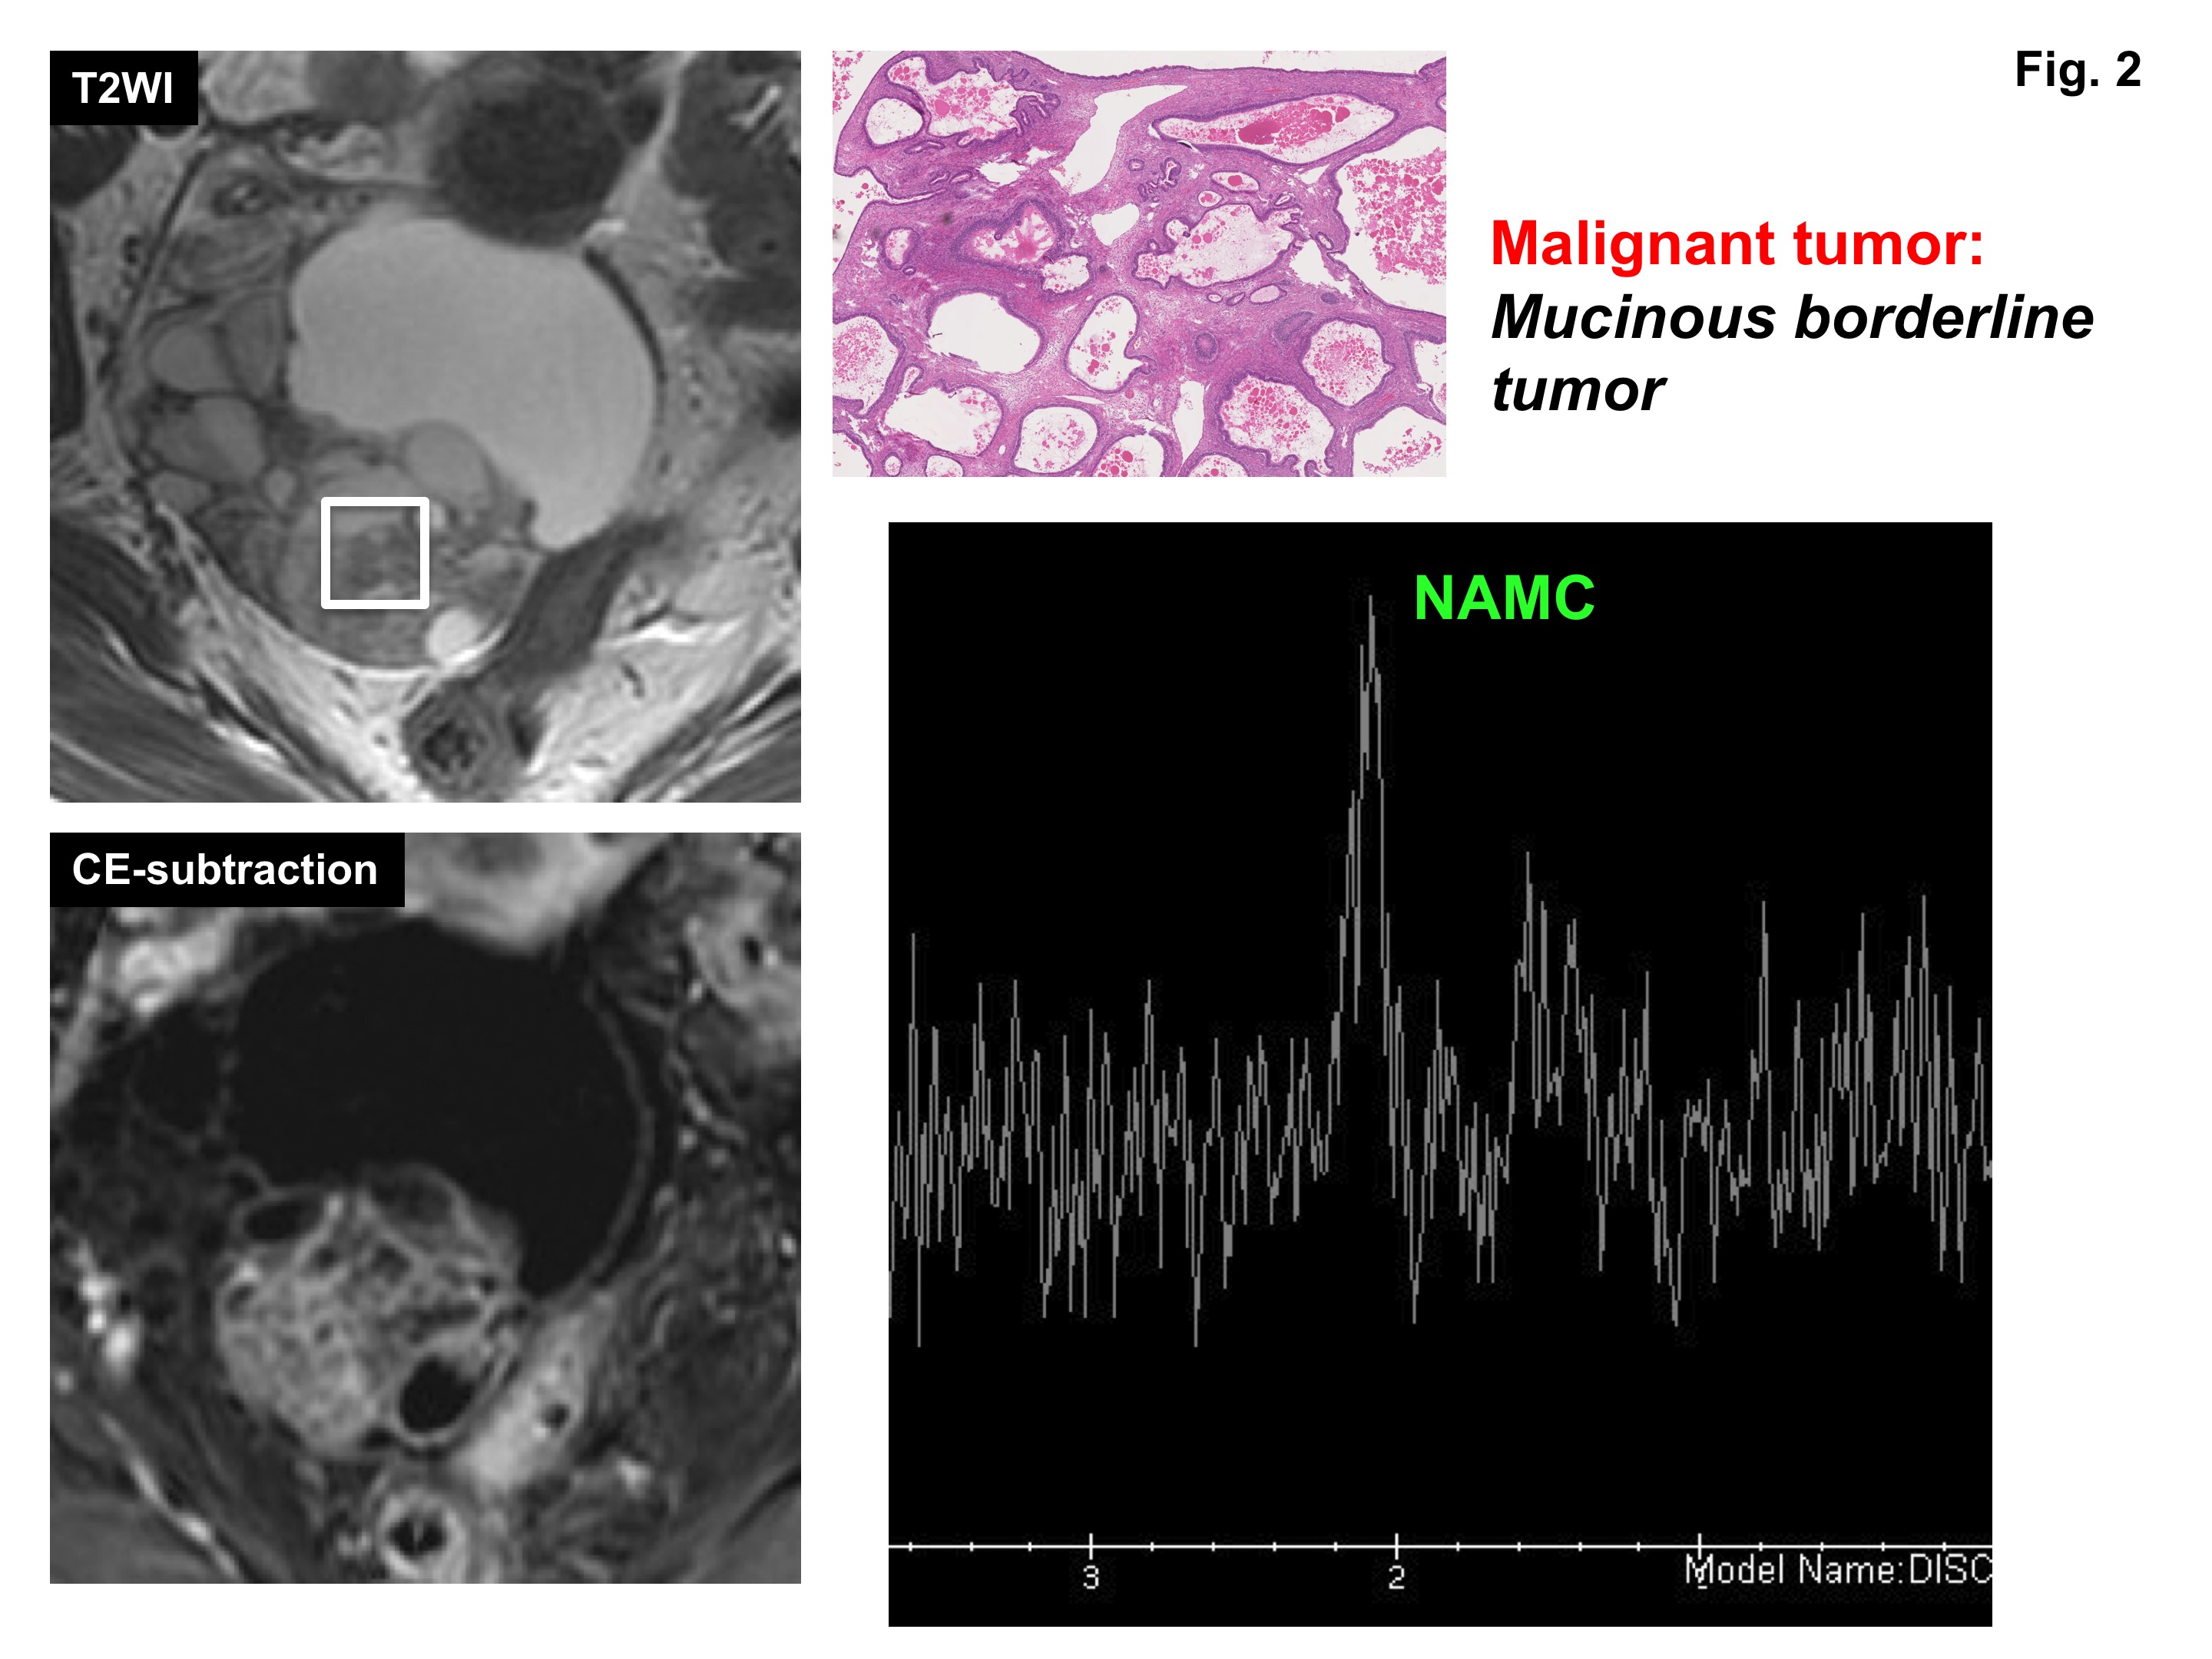
MR spectroscopy of pathologically proven 26 ovarian mucinous tumors (9 benign and 17 malignant) was retrospectively evaluated. N-acetyl mucinous compounds (NAMC) peak at 2 ppm was observed in all 26 lesions. Lipid peak was observed in 1 of 9 benign tumors (11%) and 12 of 17 malignant tumors (71%). The presence of lipid peak for the diagnosis of malignancy had a sensitivity of 71%, specificity of 89%, PPV of 92%, and NPV of 62%. We conclude that the bimodal peaks of NAMC and necrosis-associated lipid are suggestive of malignant mucinous tumors.
Introduction
Ovaries are located deeply in the pelvic cavity and biopsy is not routinely recommended for ovarian tumors. Because subtypes of ovarian cancers respond differently to chemotherapy and mucinous carcinomas may show poor response to chemotherapy, to diagnose the mucinous subtypes of ovarian cancers on MRI may contribute to the adequate treatment 1. Okamoto et al. reported that malignant ovarian mucinous tumors tend to appear as cystic masses with large number of loculi, and rarely with large solid components 2. Proton MR spectroscopy (MRS) provides metabolic information, and may add valuable information for the diagnosis. Takeuchi et al. reported that the presence of mucinous material containing N-acetyl mucinous compounds (NAMC) at 2 ppm is helpful for the diagnosis of ovarian mucinous tumors 3. Cho et al. observed intense lipid peaks at 1.3 ppm in most malignant ovarian tumors but not in benign epithelial tumors 4. The purpose of this study was to evaluate the capability of MRS in differentiating benign and malignant ovarian mucinous tumors.Methods
Pathologically proven 42 ovarian mucinous tumors who had undergone MRS were retrospectively evaluated. All patients were studied using 3T superconducting MRI with body coil transmission and an phased-array receiver. A single square spectroscopic volume of interest (VOI) (2×2×2 cm3) was prescribed within the ovarian tumors so as to contain septa or solid components (if present) as much as possible by referring T1WI, T2WI and DWI. All patients were studied using PRESS sequence (TE=144 ms) with an automated shimming method. The presence of NAMC peak (2 ppm) and lipid peak (1.3 ppm) was visually evaluated. The metabolite concentration level was classified into three classes, in comparison with the noise level by visual estimation: that is, twofold higher than the average noise level (high), higher than the average noise level but lower than a twofold higher noise level (low), and the same as the average noise level (none). Signals in spectra were analyzed by using LCModel, and the quantification of the metabolite level at 2 ppm was calculated. 26 cases (16 to 80 years of age, mean 56 years) with a %SD <20% were included in this study (9 benign mucinous adenoma/adenofibromas, 10 mucinous borderline tumors, and 7 mucinous carcinomas). The median lesion size, which was the longest diameter measured at by MRI was 115 mm (range, 47–301 mm).Results and Discussions
NAMC peak was visually observed in all 26 ovarian mucinous tumors (22 high:, 4 low). NAMC concentration in malignant mucinous tumors (20.2 +/− 21.3 mM) was significantly higher than that in benign mucinous tumors (11.5 +/−16.2 mM) (p<0.05). However, there were some overlaps between the NAMC concentration in the malignant and benign mucinous tumors. Lipid peak was observed in 13 of 26 tumors: 1 of 9 benign tumors (11%) and 12 of 17 malignant tumors (7 of 10 borderline malignancy and 5 of 7 carcinomas) (71%). The presence of lipid peak for the diagnosis of malignant mucinous tumor had a sensitivity of 71%, specificity of 89%, PPV of 92%, and NPV of 62%. Choline peak may reflect the metabolic activity of tumor cells, and tends to show higher peaks in solid malignant tumors 5. However, choline concentration is not suitable for the evaluation of cystic tumors. Lipid peaks observed on MRS may arise from triglycerides and cholesterol esters in neutral lipid droplets, and are considered to be important biomarkers in the diagnosis of malignant tumors. Lipid peaks observed in malignant tumors owing to stress-induced intracellular lipid droplets in tumor cells, and lipid droplets which leaked out from damaged cells into necrotic or cystic spaces 6. Takeuchi et al. reported that the high lipid peak was observed in both viable and necrotic areas of the high-grade uterine malignant tumors 7. In the current study, the presence of lipid peak was suggestive for malignancy with high specificity and PPV. However, 5 of 17 malignant tumors (29%) showed no lipid peaks in this study. That may be because mucinous tumors tend to be large, mulitilocular cystic masses, malignant foci within the mass might be apart, and/or be separated from VOIs in the malignant mucinous tumors without lipid peaks.Conclusion
We conclude that the bimodal peaks of NAMC at 2 ppm and necrosis-associated lipid at 1.3 ppm are suggestive of malignant mucinous tumors, and may be useful in distinguishing benign from malignant ovarian mucinous tumors.Acknowledgements
No acknowledgement found.References
- Hess V, et al. Mucinous epithelial ovarian cancer: a separate entity requiring specific treatment. J Clin Oncol. 2004;22:1040-1044.
- Okamoto Y, et al. Malignant or borderline mucinous cystic neoplasms have a larger number of loculi than mucinous cystadenoma: a retrospective study with MR. J Magn Reson Imaging. 2007;26:94-99.
- Takeuchi M, et al. Preliminary observations and clinical value of N-acetyl resonances in ovarian tumours using in-vivo proton MR spectroscopy at 3T. Eur Radiol. 2011;21:2640-2646.
- Cho SW, et al. In-vivo proton magnetic resonance spectroscopy in adnexal lesions. Korean J Radiol. 2002;3:105-112.
- Glunde K, et al. Choline metabolism in cancer: implications for diagnosis and therapy. Expert Rev Mol Diagn. 2006;6:821-829.
- Delikatny EJ, et al. MRvisible lipids and the tumor microenvironment. NMR Biomed. 2011;24:592-611.
- Takeuchi M, et al. Preliminary observations and clinical value of lipid peak in high-grade uterine sarcomas using in vivo proton MR spectroscopy. Eur Radiol. 2013;23:2358-2363.
Figures


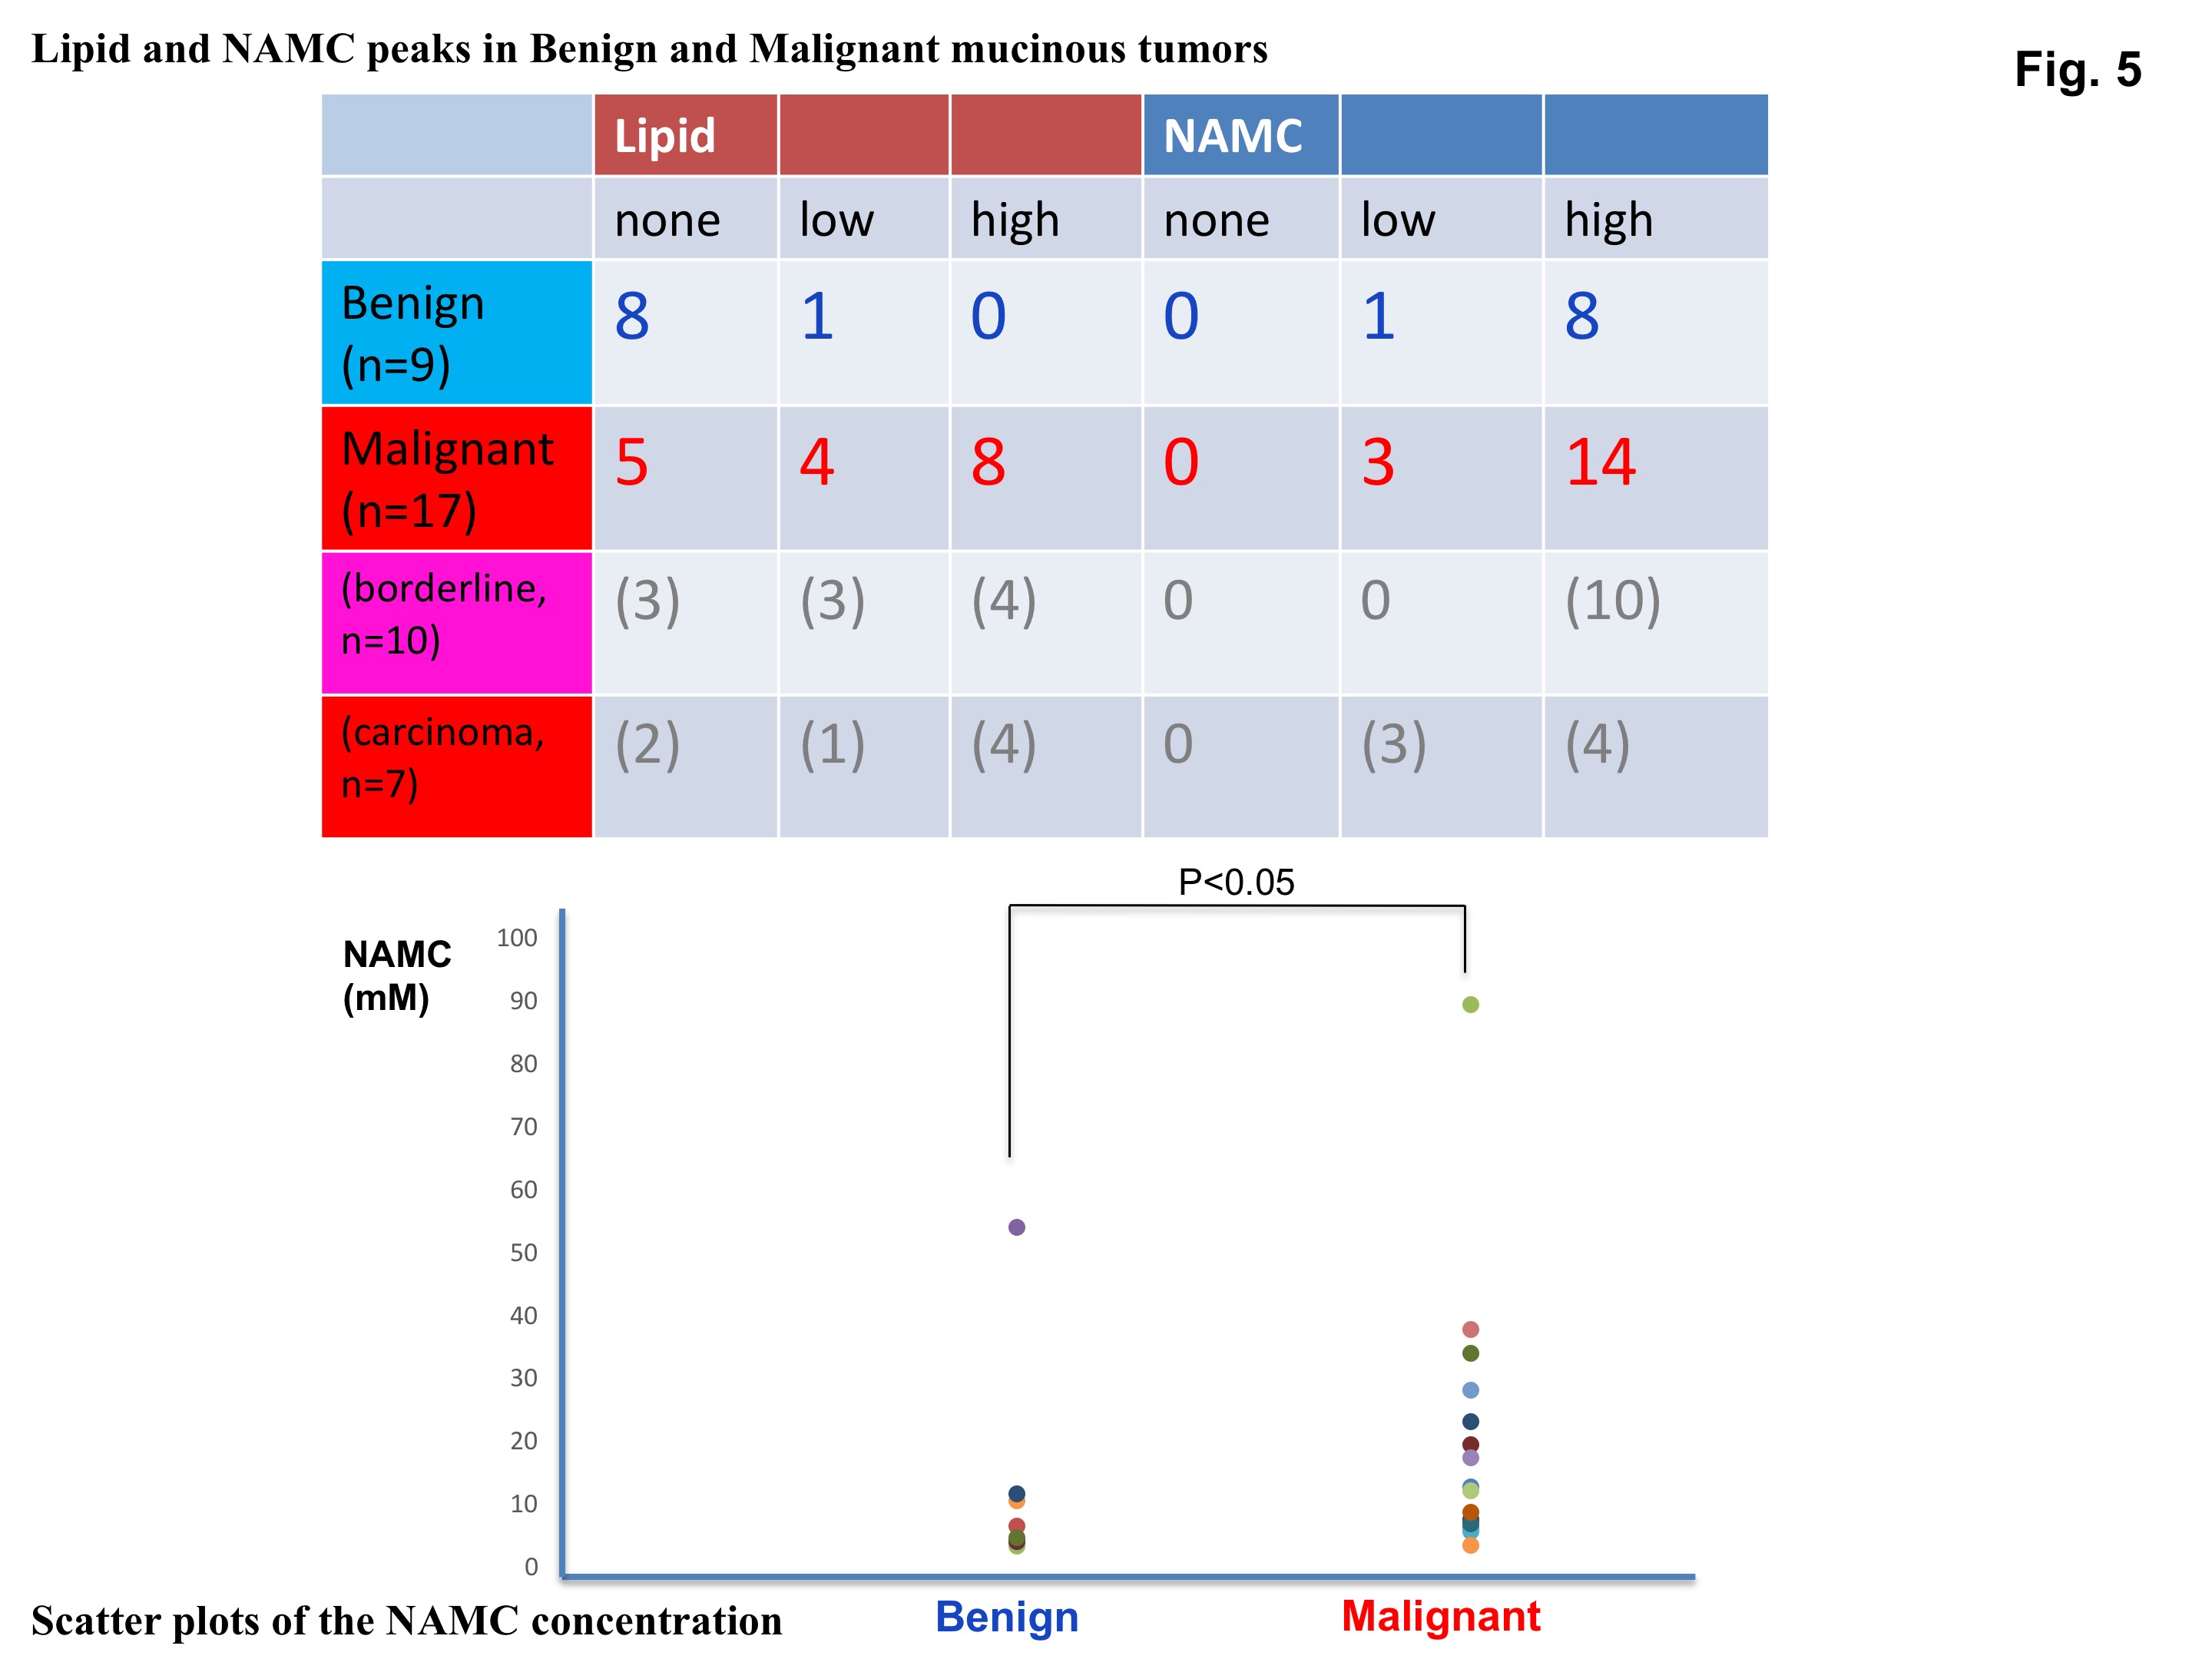
Visual evaluation of lipid and NAMC peaks in benign and malignant mucinous tumors are summarized in the Table.
Scatter plots of the NAMC concentration: Scatter plots of the NAMC at 2 ppm concentration obtained in benign and malignant (borderline malignancy and carcinoma) mucinous ovarian tumors. The NAMC concentration in malignant mucinous tumors is significantly higher than that in benign mucinous tumors (p<0.05), however, there were some overlaps.