2519
Why you shouldn’t report pancreas MRI-PDFF ‘for free’ from a liver scan1Department of Engineering Science, University of Oxford, Oxford, United Kingdom, 2Perspectum Diagnostics, Oxford, United Kingdom
Synopsis
The proximal locations of the liver and pancreas in the abdomen make it tempting to report the PDFF of both in a single scan. However, published methods for liver fat measurement need revision before they accurately measure pancreatic fat. UK Biobank scans were used to quantify the quality of fits of a method developed previously for liver PDFF when applied to the pancreas. Pancreas fits were an order of magnitude lower than fits in the liver or the spleen. This could be due to a suboptimal acquisition or because the liver fat model does not approximate well to the pancreas.
Introduction
Nonalcoholic fatty pancreatic disease (NAFPD) is increasingly common, consistent with the increasing worldwide prevalence of obesity. NAFPD has similar manifestations to nonalcoholic fatty liver disease (NAFLD), the latter begins with the abnormal accumulation of fat deposits (steatosis), coexists with inflammatory processes, and progresses to fibrosis and in many cases to hepatocellular cancer1. NAFPD is an area of active investigation for its hypothesized relationship with diabetes and metabolic syndrome.While biopsy is the recognized gold standard to measure pancreatic fat, ‘virtual’ biopsies of the pancreas through noninvasive quantitative imaging are an appealing alternative that is under development. Magnetic resonance imaging (MRI), and particularly chemical-shift encoding (CSE) water-fat separation, is well established for measuring liver proton density fat fraction (PDFF) and is a priori a natural candidate for the quantification of pancreatic steatosis. However, there are published limitations in CSE-MRI for measuring pancreatic fat deposition which, upon resolving, might help improving PDFF estimation in the pancreas and shed light into inconclusive studies over the relationship between pancreas PDFF, diabetes, pancreatitis, and pancreatic cancer. One major area of concern is inaccurate fat spectral modelling, which has been shown to bias PDFF estimates and could mislead clinical decision-making2.
In this study, we show that the adaptation to pancreas of current acquisition and reconstruction approaches for liver PDFF measurement (readily available) is fundamentally limited, necessitating modification before pancreatic PDFF can be reported with confidence. In this abstract, we quantify the effect of inaccurate modelling of pancreas fat on PDFF measurements in a set of nominally healthy volunteers from the UK Biobank study.
Methods
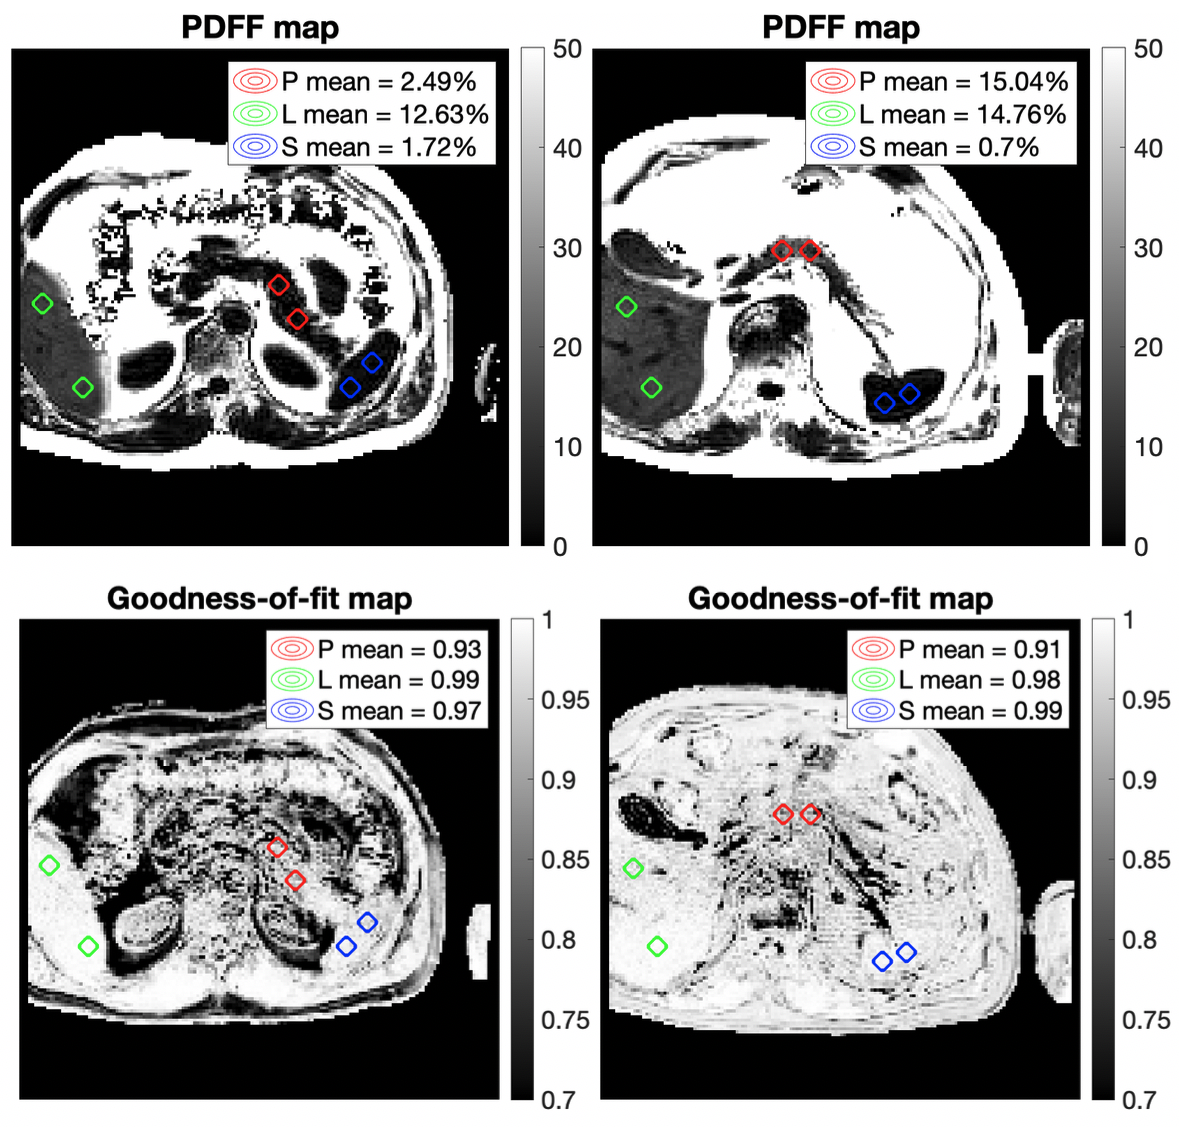
We gathered a total of 110 multiecho gradient echo single-slice acquisitions from the UK Biobank study targeting the upper abdominal region (Siemens Aera, 1.5T, TE1=DTE=2.38 ms, slice thickness=6 mm). From those we selected N=59 where all of the liver, pancreas and spleen could be identified in a single axial slice of the raw data. The raw data was fitted for PDFF using our previously-reported magnitude-based CSE-MRI method that resolves the water-fat ambiguity previously thought to be intrinsic when fitting magnitude data only3. T2* maps and goodness-of-fit maps (r-squared) were also generated as part of the model fitting.An experienced operator placed two circular regions of interest (ROIs) on the reconstructed PDFF map in each of the three organs (Fig. 1). The pooled mean PDFF and r-squared ROI values were reported for each organ. We compared the goodness-of-fit distributions between liver and pancreas, using splenic values as control.
Results
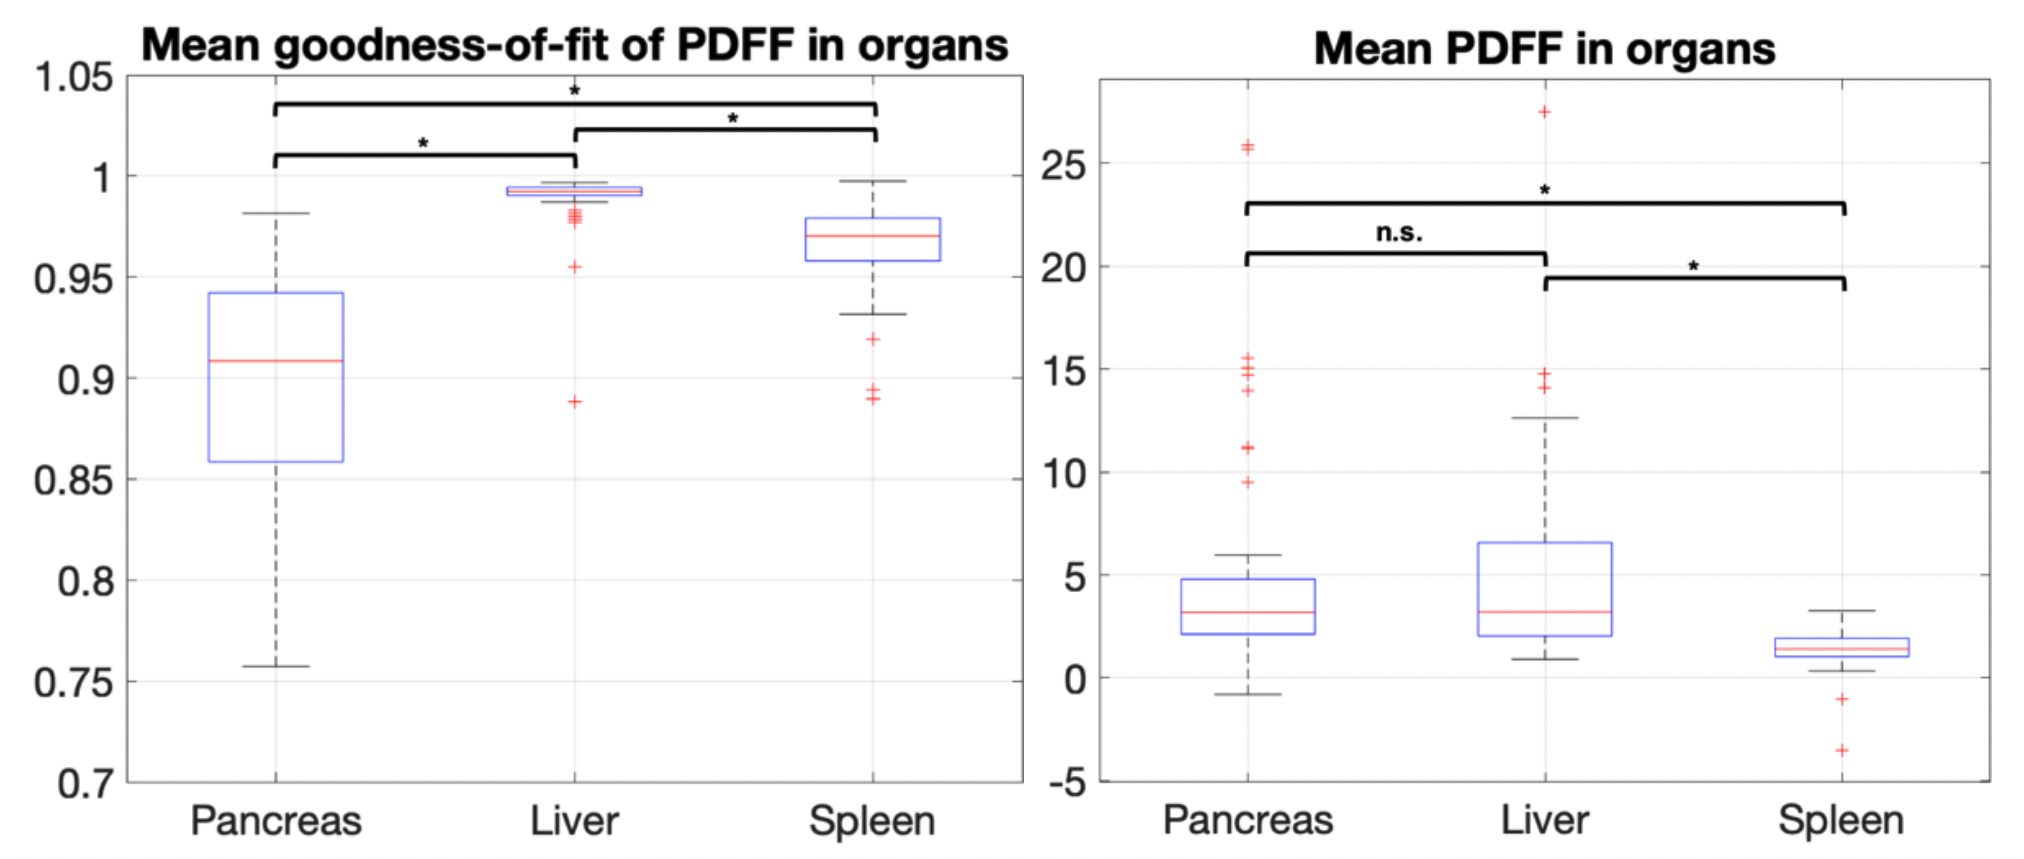
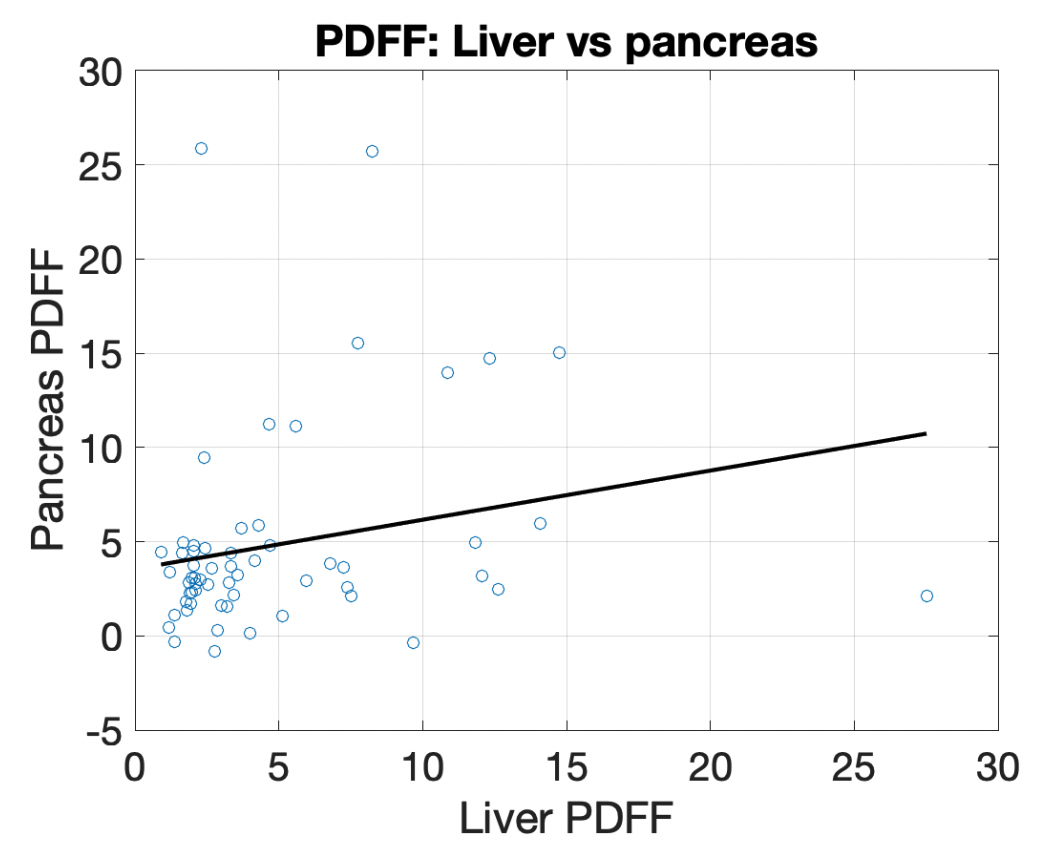
The distribution of r-squared values between organs across individuals showed the liver had the best reported fits (median 0.992, std 0.015), followed by the spleen (median 0.970, std 0.021) and the pancreas (median 0.908, std 0.058). Two-sample t-tests reported statistically significant differences between population r-squared values in the liver vs pancreas (p<0.001), spleen vs pancreas (p<0.001), and liver vs spleen (p<0.001) (Fig. 2).The distribution of PDFF values between organs across individuals showed a statistically significant difference between splenic PDFF (median 1.41, std 0.97) and liver PDFF (median 3.21, std 4.69), as well as a difference between splenic PDFF and pancreas PDFF (median 3.19, std 5.43). No significant difference was observed between pancreas PDFF and liver PDFF (Fig. 2). No correlation was observed between pancreas PDFF and liver PDFF in the individuals (Fig. 3).
Discussion
We routinely expect that both liver, which is assumed to be composed of water, liver fat and iron, and spleen, which contains water but not fat of any kind, will have high r-squared values. It is notable that pancreas r-squared is substantially below the measurements for liver and spleen. This could be due to differences in acquisition and reconstruction, or both. Our approach of selecting axial slices where all three organs could be observed is designed to reduce acquisition differences, though organ-inherent partial volume or motion susceptibility remain. Using a purely magnitude-based method in the fitting removed the impact of phase errors, which could have dominated in regions of sharp tissue boundaries such as near the pancreas. Slightly non-zero spleen PDFF results have been explained in the past as the reconstruction of noise, independently of the fitting method used4. We expect that the pancreas fits will improve once a more tailored model is used –this is work in progress– though the nominal improvement might still not be acceptable for PDFF reporting, and acquisition might need to be reexamined as well.Conclusion
MRI-PDFF maps obtained as outputs from reconstructing upper abdominal scans should be treated with care. Currently used fat spectral models are only valid for liver tissue, where the processes are clear, tissue is more homogeneous and MRI-PDFF has been consistently validated. Future work will incorporate a pancreatic fat model –measured using MRS– into the reconstruction procedure, in order to improve the quality of pancreas fat measurements.The approach we are developing first segments, then fits for PDFF incorporating priors for said organs. In our opinion, accurate fat modelling, together with acquisition improvements and validation studies will establish MRI as the method of choice for pancreas fat measurement in the clinic.
Acknowledgements
Perspectum
Diagnostics for providing funding, data and counseling, as well as the Engineering
and Physical Sciences Research Council (EPSRC) for providing funding. This
research has been conducted using the UK Biobank Resource under Application Number
9914.
References
1. Tariq, Hassan, et al. "Non-alcoholic fatty pancreatic disease: a review of literature." Gastroenterology research 9.6 (2016): 87.
2. Sakai, Naomi S., Stuart A. Taylor, and Manil D. Chouhan. "Obesity, metabolic disease and the pancreas—Quantitative imaging of pancreatic fat." The British journal of radiology 91.1089 (2018): 20180267.
3. Triay Bagur, Alexandre, et al. "Magnitude‐intrinsic water–fat ambiguity can be resolved with multipeak fat modeling and a multipoint search method." Magnetic resonance in medicine 82.1 (2019): 460-475.
4. Hong, Cheng William, et al. "Measurement of spleen fat on MRI-proton density fat fraction arises from reconstruction of noise." Abdominal Radiology (2019): 1-9.
Figures