2517
Quantification of pancreatic fat content: A Comparison of freehand regions of interest placement and threshold-based segmentation1The First Affiliated Hospital of Dalian Medical University, Dalian, China, 2Philips Healthcare, Beijing, China
Synopsis
The diagnosis pancreatic fat infiltration is commonly performed with consideration of histopathology in combination with CT /MRI images. This study evaluated the performance of two fat content measurement methods using 3D mDIXON Quant images, based on interest-based hand-drawn area (ROI) placement and threshold-based segmentation. Results by the two methods show good agreement, indicating that both of the two methods can be reliable for evaluation of the pancreas fat content. While, the method based threshold segmentation is recommended in this study, since it can provide a full evaluation of fat contents across the pancreas and can be more convenient in implementation.
Introduction
Pancreatic fatty infiltration refers to excessive triglyceride deposition in pancreatic acinar and islet cells, or the replacement of the pancreatic parenchyma with adipose tissue. There have been more and more studies indicated the correlations of pancreatic fatty infiltration (PFI) to cardiovascular diseases, metabolic syndrome and its various components. Therefore, quantitative detection of pancreatic fat has important clinical significance 1-3. The advanced mDixon Quant sequence 2, with acceleration of compressed sensing sensitivity encoding (CS-SENSE), can achieve water only images, fat only images, fat fraction (FF) maps, and T2* maps within a single breath-hold scan. This study aims to evaluate the consistency between pancreatic fat contents determined by the freehand region of interest (ROI) placement and the threshold-based segmentation on 3D mDIXON Quant FF maps.Purpose
To evaluate the consistency of pancreas fat contents determined by the freehand region of interest (ROI) placement and the threshold-based segmentation on 3D mDIXON Quant fat fraction (FF) maps.Materials and Methods
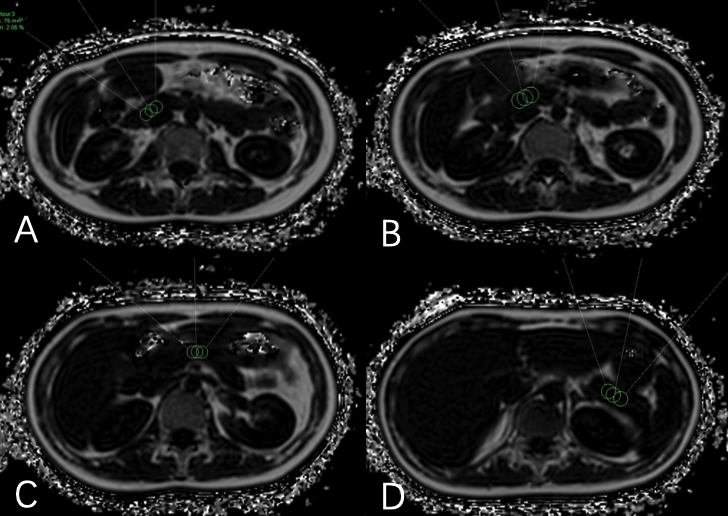
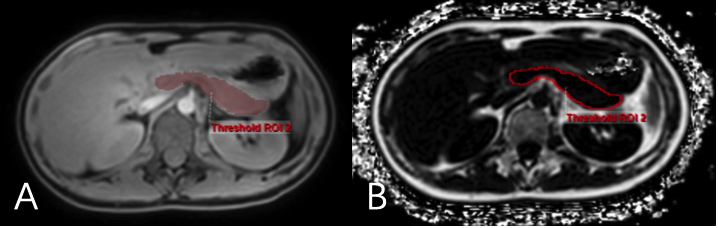
11 healthy volunteers ( 4 males and 7 females, mean age 24.91±1.64 years, age range 22-27years, BMI range 17.71-28.73kg/m2, mean BMI 21.75±3.35 kg/m2) were scanned on a 3.0 T MR (Ingenia CX, Philips Healthcare, Best, the Netherlands) with the 3D mDIXON Quant sequence using a 16-channel phase-arrayed coil (dS dorso, Philips Healthcare, Best, the Netherlands). Scanning parameters included: field of view = 375 × 300 × 168 mm3, TR = 6 ms, layer thickness = 5.0 mm, layer spacing = 2.5 mm, CS-SENSE factor = 2, and echo number = 6. Measurement of pancreatic fat contents was performed on a dedicated state-of-the-art software tool (IntelliSpace Portal, Philips). Three ROIs were placed at head-neck, body and tail regions of the pancreas, respectively on FF images during the uncinate process. All ROIs were placed within the interested tissue by avoiding blood vessels, pancreatic duct and abdominal adipose tissue (Fig.1). The mean value of FF values recorded from each ROI were used, and average of all the three-region mean FF values were used as the whole pancreatic fat fraction. Each ROI was with an area of approximately 25-64 mm2. The pancreas masks were generated by the threshold-based segmentation on water images. Then, the masks were used on fat images for determination of the fat fraction of pancreas (Fig.2). The time costs of the two methods were recorded. Two observers performed measurements of the pancreas fat fraction using the double-blind method. The intraclass correlation coefficient (ICC) was used to test the measurement consistency between the two observers. This study has been approved by the local IRB.Results
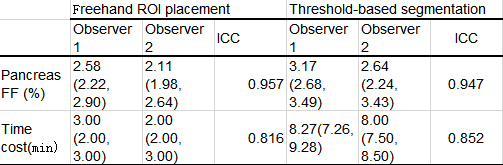
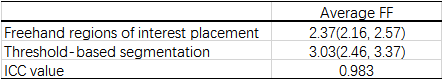
The pancreas FF measurements show good agreements between the two observers with two methods (0.957 for measurement based on the freehand ROI placement, and 0.947 for measurements based on the threshold-based segmentation, Table 1). Measurements between the two methods are also in good agreement (ICC = 0.983) (Table 2).Discussion
Advantages of the 3D mDIXON Quant technique lie majorly in that: 1) a threshold fitting method can be used for full pancreatic-volume fat quantification; 2) the scan duration can be significantly reduced (about 15 seconds) with introduction of the CS-SENSE technique. This study is to explore performance of different methods for pancreatic fat quantification on the 3D mDIXON Quant images. For the conventional ROI-based method, the fat content of whole pancreas is represented by fat contents from several specific areas, and it can be limited to the representative regions of drawing in clinical practice, especially for those patients with inhomogeneous distribution of pancreatic fat 4. Therefore, it is more feasible to use the automatic threshold fitting method for entire pancreas measurements.Conclusion
Both the freehand ROI placement and the threshold-based segmentation can be reliable for determination of pancreas fat contents on the 3D mDIXON Quant images. The threshold-based segmentation is recommended, since it can give a full pancreas evaluation and is more convenient in implementation.Acknowledgements
No acknowledgement found.References
1. Ozturk K, Dogan T, Celikkanat S, et al. The association of fatty pancreas with subclinical atherosclerosis in nonalcoholic fatty liver disease. Eur J Gastroenterol Hepatol. 2018;30:411-417.
2. Singh RG, Yoon HD, Wu LM, et al. Ectopic fat accumulation in the pancreas and its clinical relevance: A systematic review, meta-analysis, and meta-regression. Metabolism. 2017;69:1-13.
3. Weng S, Zhou J, Chen X, et al. Prevalence and factors associated with nonalcoholic fatty pancreas disease and its severity in China. Medicine (Baltimore). 2018;97:e11293.
4. Kawamoto S, Siegelman SS, Bluemke DA, et al. Focal fatty infiltration in the head of the pancreas: evaluation with multidetector computed tomography with multiplanar reformation imaging. J Comput Assist Tomogr. 2009;33:90-95.
Figures