2516
Explore the relationship between liver and pancreatic fat contents through 3D mDIXON Quant1The First Affiliated Hospital of Dalian Medical University, Dalian, China, 2Philips Healthcare, Beijing, China
Synopsis
In recent years, population of non-alcoholic fatty liver diseases (NAFLD) have shown a trend of increasing. Besides, studies have reported that NAFLD was associated with pancreatic fat infiltration. 3D mDixon Quant has been widely used for evaluation of fat fraction in various organs/tissues. In the present study, the 3D mDixon Quant sequence was employed to assess the relationship between liver and pancreatic fat contents. Results suggested that there was a significant positive correlation between liver and pancreatic fat contents (r=0.624, P<0.05), which may be helpful for clinical diagnoses.
Introduction
Liver is the best-known site for ectopic fat accumulation. The well-characterized NAFLD is becoming the most common cause of chronic liver diseases in children and adolescents1. Studies have also reported that NAFLD was associated with the pancreatic fat infiltration, which is closely related to insulin resistance and metabolic syndrome, and may lead to poor prognoses of pancreatitis and pancreatic cancer, etc. Accurate quantification of fat contents can benefit early prevention, diagnosis, treatment, efficacy evaluation, and prognosis evaluation of relevant diseases2-3. This study aims to explore the relationship between liver and pancreatic fat contents, which can be of great clinical value, based on 3D mDIXON Quant images.Materials and Methods
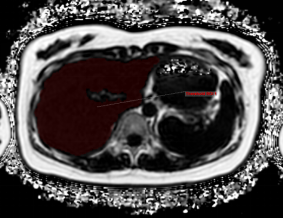
24 volunteers (15 males and 9 females)were recruited and underwent MR scans on a 3.0 T MR scanner (Ingenia CX, Philips Healthcare, Best, the Netherlands) using the 3D mDIXON Quant sequence. Scanning parameters were used as: FOV = 375 × 300 × 168 mm3, TR = 6 ms, layer thickness and spacing = 5.0/2.5 mm, CS-SENSE factor = 2, and Echo number = 6. Pancreatic fat and liver fat measurements were performed at the vendor-provided IntelliSpace Portal workstation using a single-layer ROI drawing overlay volume measurement technique (Figure1, Figure2). All data were statistically analyzed on SPSS v19.0 (IBM, Chicago, III). The Spearman test was used to analyze the correlation between liver and pancreatic fat contents. This study has been approved by the local IRB.Results
The liver and pancreas were measured with fat contents of 3.69 (3.06, 5.36) and 2.72 (2.34, 4.71), respectively, and a significant correlation was observed between liver and pancreatic fat contents (r = 0.624, P < 0.05).Discussion
Abnormal deposition of liver fat can lead to insulin resistance, and then develop into type 2 diabetes, while obesity, insulin resistance and other relevant metabolic signs may also mean the occur of cirrhosis and even liver cancer 4-5. The pathological process of pancreatic fat infiltration is similar to that of liver fat infiltration3. In addition, pancreatic fat infiltration is also associated with obesity, type 2 diabetes, NAFLD, abnormal glucose metabolism, and metabolic diseases, etc. Pancreatic fat infiltration is also a predisposing factor for pancreatic cancer, and can make lymph node metastasis more likely to occur in patients with pancreatic cancer and increase the incidence of postoperative pancreatic fistula2. Ultrasound examinations such as Uygun6 found that about 50% of patients with NAFLD confirmed by tissue biopsy had pancreatic fat infiltration. The study conforms a positive correlation between fat contents in liver and pancreas. So we can draw a conclusion that the average fat scores of the pancreas and pancreas were higher in the patients with NAFLD than in normal subjects. This is consistent with the findings of van Geenen et al7, who also believe that pancreatic fat infiltration occurs earlier than fatty liver.Conclusion
A significant correlation has been observed between liver and pancreatic fat contents, that may help clinical diagnoses of relevant diseases.Acknowledgements
No acknowledgement found.References
1 Della Corte C, Mosca A, Majo F, et al. Nonalcoholic fatty pancreasdisease and nonalcoholic fatty liver disease: More than ectopic fat. Clin Endocrinol (Oxf). 2015;83:656-662.
2 Alempijevic T, Dragasevic S, Zec S, et al. Non-alcoholic fatty pancreas disease. Postgrad Med J. 2017;93:226-230.
3 Tariq H, Nayudu S, Akella S, et al. Non-alcoholic fatty pancreaticdisease: A review of literature. Gastroenterol Res. 2016;9:87-91.
4Lewis JR, Mohanty SR. Nonalcoholic fatty liver disease: A review andupdate. Dig Dis Sci. 2010;55:560-578.
5Vuppalanchi R, Chalasani N. Nonalcoholic fatty liver disease andnonalcoholic steatohepatitis: Selected practical issues in their evaluation and management. Hepatology, 2009;49:306-317.
6Uygun A, Kadayifci A, Demirci H, et al. The effect of fatty pancreason serum glucose parameters in patients with nonalcoholic steatohepatitis. Eur J Intern Med. 2015;26:37-41.
7 van Geenen EJ, Smits MM, Schreuder TC, et al. Nonalcoholic fattyliver disease is related to nonalcoholic fatty pancreas disease. Pancreas, 2010, 39;1185-1190.
Figures

