2514
Quantification of pancreatic volume and clinical correlations in patients with hemoglobinopathies
Antonella Meloni1, Massimiliano Missere2, Gennaro Restaino2, Laura Pistoia1, Vincenzo Positano1, Emanuele Grassedonio3, Nicolò Schicchi4, Giuseppe Peritore5, Francesco Massei6, Nicola Dello Iacono7, Angelica Barone8, and Alessia Pepe1
1MRI Unit, Fondazione G. Monasterio CNR-Regione Toscana, Pisa, Italy, 2Fondazione di Ricerca e Cura "Giovanni Paolo II", Campobasso, Italy, 3Policlinico "Paolo Giaccone", Palermo, Italy, 4Azienda Ospedaliero-Universitaria Ospedali Riuniti "Umberto I-Lancisi-Salesi", Ancona, Italy, 5"ARNAS" Civico, Di Cristina Benfratelli, Palermo, Italy, 6Azienda Ospedaliero Universitaria Pisana – Stabilimento S.Chiara, Pisa, Italy, 7Ospedale Casa Sollievo della Sofferenza IRCCSOspedale Casa Sollievo della Sofferenza IRCCS, San Giovanni Rotondo, Italy, 8Azienda Ospedaliero-Universitaria di Parma, Parma, Italy
1MRI Unit, Fondazione G. Monasterio CNR-Regione Toscana, Pisa, Italy, 2Fondazione di Ricerca e Cura "Giovanni Paolo II", Campobasso, Italy, 3Policlinico "Paolo Giaccone", Palermo, Italy, 4Azienda Ospedaliero-Universitaria Ospedali Riuniti "Umberto I-Lancisi-Salesi", Ancona, Italy, 5"ARNAS" Civico, Di Cristina Benfratelli, Palermo, Italy, 6Azienda Ospedaliero Universitaria Pisana – Stabilimento S.Chiara, Pisa, Italy, 7Ospedale Casa Sollievo della Sofferenza IRCCSOspedale Casa Sollievo della Sofferenza IRCCS, San Giovanni Rotondo, Italy, 8Azienda Ospedaliero-Universitaria di Parma, Parma, Italy
Synopsis
In patients with hemoglobinopathies fat infiltration is a common finding and pancreatic volume is significantly lower than in normal subjects but it is not associated to age or gender. Pancreatic iron overload is present in the 74% of the patients and it is associated with reduced pancreatic volume. Patients with diabetes have a lower pancreatic volume.
Introduction
We described the magnetic resonance imaging (MRI) features of pancreas in patients with hemoglobinopathies, investigating the association of pancreatic volume (PV) with pancreatic iron and diabetes.Methods
We considered 95 patients (44 F, mean age 38.81±8.83 years) consecutively enrolled in the E-MIOT (Extension-Myocardial Iron Overload in Thalassemia) project and 10 healthy subjects.All MRI examinations were performed with a 1.5T scanner. T2* measurements were performed over pancreatic head, body and tail and global value was the mean.1 PV was measured in non-gadolinium FSPGR T1-weighted in phase and out of phase images in two different ways: including and excluding the visible fat (PV-fat and PV-nofat, respectively). PV volume was normalized by body surface area.
Results
Due to complete fatty infiltration, pancreatic volume was non analyzable in 9 patients, all females, all with pancreatic iron load (global pancreas T2*<26 ms), and significantly older. So, we had a final population of 86 patients.In 17 patients there was visible fatty infiltration and PV-fat was significantly higher than PV-no fat (33.85±17.44 cm3 vs 29.72±13.21 cm3/m2; P=0.001). PV was not associated to age or gender.
Mean pancreatic volume in healthy subjects was 46.28±9.19 cm3/m2, significantly higher than the value detected in the patients, both including and excluding fat (P=0.002 and P<0.0001, respectively).
The 74.0% of the patients had pancreatic iron (global pancreas T2*<26 ms). PV-fat was comparable between patients with and without pancreatic iron, while PV-no fat was significantly lower in patients with pancreatic iron (Figure 1).
The 7.0% of the patients had diabetes. PV-fat was comparable between patients with and without pancreatic iron, while PV-nofat was significantly lower in patients with pancreatic iron (Figure 2).
Conclusions
Patients with hemoglobinopathies showed a reduced pancreatic volume in comparison to the healthy population, also without the exclusion of the infiltrate fat, a really common finding. Moreover, among patients PV was more reduced in presence of pancreatic iron overload and diabetes.Acknowledgements
No acknowledgement found.References
1. Meloni A, De Marchi D, Positano V, et al. Accurate estimate of pancreatic T2* values: how to deal with fat infiltration. Abdom Imaging 2015;40(8):3129-3136.Figures
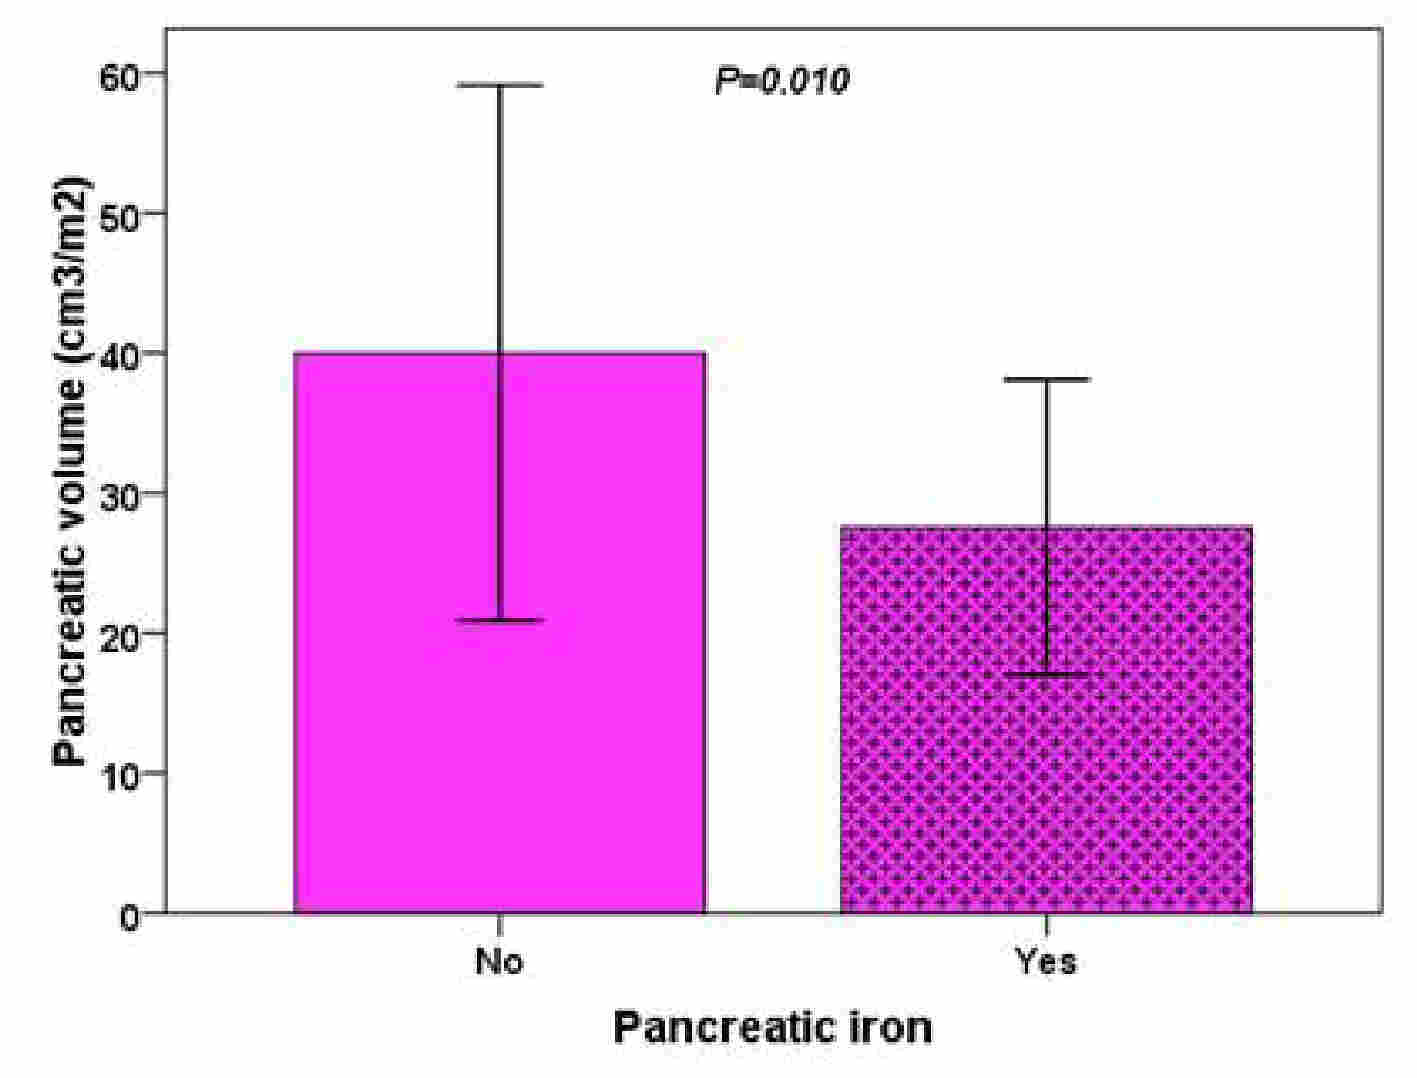
Figure 1
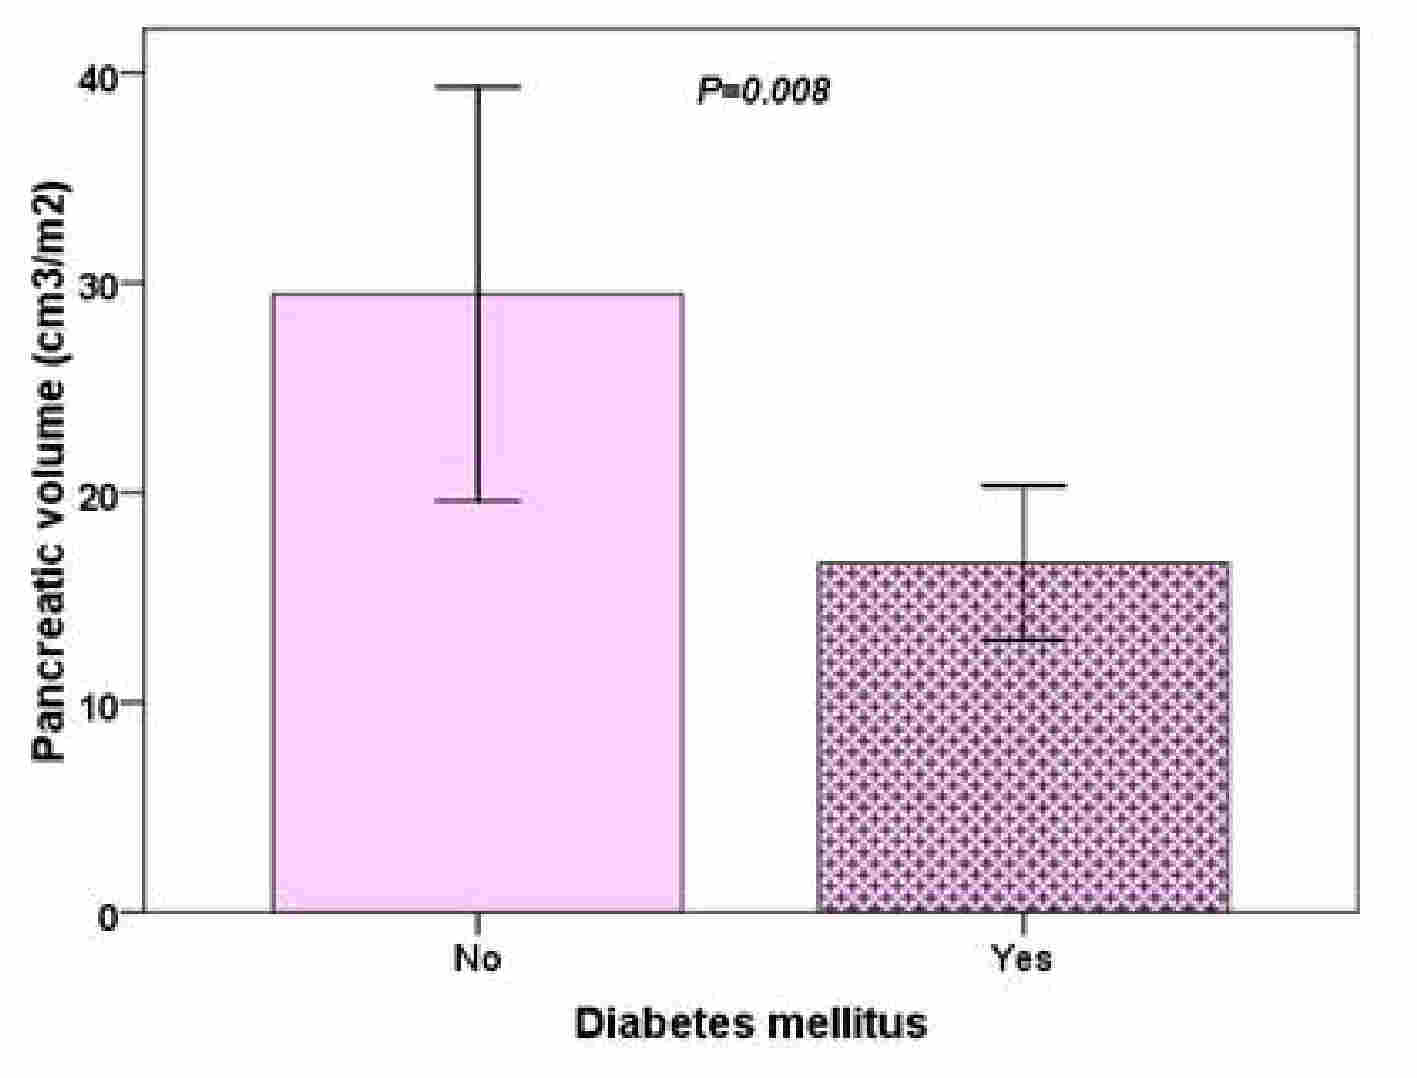
Figure 2