2511
MRI Relaxometry: Pancreatic R2* Values in Relation to Hepatic and Splenic R2* with Respect to Transfusion Frequency1Dept. for Diagnostic and Interventional Radiology, Ulm University, Medical Center, Ulm, Germany, 2Section for Experimental Radiology, Ulm University, Medical Center, Ulm, Germany, 3Siemens Healthcare GmbH, Erlangen, Germany, 4Dept. for Pediatric and Adolescent Medicine, Ulm University, Medical Center, Ulm, Germany
Synopsis
To study pancreatic iron accumulation in liver overloaded patients in relation to hepatic and splenic iron content, 90 patients were investigated at 1.5 T MRI with a prototype breath hold volumetric 3D GRE sequence with in-line R2* calculation. Mean R2* values were determined in liver, spleen and pancreas by manually drawn ROIs. Pancreatic R2* values were related to hepatic and splenic R2* by multiple linear regression, yielding significant correlation in two subgroups: a) frequently transfused patients, and b) regular transfused patients. Correlation, and therefore, ability to predict pancreatic R2*, improved by including splenic R2* compared to solely hepatic R2*.
Purpose
To study pancreatic iron accumulation in relation to hepatic and splenic iron in iron overloaded patients, divided in subgroups according to transfusion frequency.Methods
89 patients (41 f, 48 m, age range 2 to 60 years, mean ± SD: 19.9 ± 13.7 years) suspected for liver iron overload were investigated with 1.5 T MRI (MAGNETOM Avanto, Siemens Healthcare, Erlangen, Germany) in a study approved by our local ethics committee. Patients after splenectomy were excluded from this study. By means of a breath hold 3D GRE protocol, fifty-six transversal partitions of 4 mm thickness (no gap) at 2.5x2.5 mm voxel size were acquired at minimum TE and TE spacing of 1.2 ms for the first five echoes (TE=1.2 to 6 ms), while a sixth echo was acquired at TE of 9 ms. CAIPIRINHA technique (Controlled Aliasing In Parallel Imaging Results IN Higher Acceleration) 1 was used with an acceleration factor of three to enable acquisition in a single breath hold of 13 sec. The prototype implementation of this sequence determined R2* in-line for each voxel, accounting for signal modulation by fat/water-dephasing 2. To obtain mean hepatic, splenic and pancreatic R2* values for each patient, three regions of interest (ROI) were manually placed in tissue free of vessels and artifacts of each organ. Patients were divided into four subgroups according to transfusion frequency: 1) no transfusion, 2) frequent transfusion, 3) regular transfusion, and 4) after bone marrow transplant (condition after transfusion). Multiple linear regression parameters, i.e. coefficient of determination R2, slope and intercept of splenic and hepatic R2* vs. pancreatic R2* were determined, and linear regression was tested for significance. For comparison, linear regression between solely hepatic and pancreatic R2* was also evaluated. Finally, accuracy of pancreatic R2* calculation based on hepatic and splenic R2* was evaluated.Results
In group 1 of patients with no transfusion (13 patients), we found splenic R2* values between 15 and 39 s-1 with two exceptions (78 and 110 s-1), pancreatic R2* varied between 18 to 41 s-1, while hepatic R2* ranged up to 486 s-1. No significant correlation of splenic and hepatic R2* vs. pancreatic R2* was found (p > 0.05). A highly significant correlation (R2=0.83, p<0.001) of pancreatic R2* (14-80 s-1) vs. liver R2* (32-750 s-1) and splenic R2* (39-469 s-1) was observed in group 2 of frequently transfused patients (11 patients). For regular transfused patients (group 3, 51 patients), pancreatic R2* values of 16-496 s-1, hepatic R2* of 36-930 s-1 and splenic R2* between 12 and 381 s-1 were found with a moderate correlation (R2 = 0.41, p < 0.001). In patients with previous blood transfusions (group 4, 14 patients), pancreatic R2* was below 67 s-1 with two exceptions, independent of hepatic R2* (104-790 s-1) and splenic R2* (58-634 s-1; p > 0.05).Compared to relationship of pancreatic R2* with merely hepatic R2* in group 2 and 3, correlation improved when incorporating splenic R2*, cf. Table 1. In sporadic and frequently transfused patients, analysis of linear correlation between liver and pancreas yielded R2=0.66 and p=0.002, in the group receiving regular transfusion we got R2=0.37 at p<0.001. Linear correlation between pancreatic and only splenic R2*, shown in Table 1, was even worse.
For a scatterplot of pancreatic R2* values calculated based on hepatic and splenic R2* and the associated regression line, refer to Fig. 1.
Discussion
Pancreatic R2*, reflecting pancreatic iron accumulation, is an important clinical parameter. Yet, a correlation to exocrine and endocrine function has not been proven. R2* can be determined with 3D Multi-GRE imaging and in line R2* calculation, but, due to its anatomy, it is challenging to get reliable pancreatic values. This is much easier in spleen and liver. We proposed a method which allows to estimate pancreatic R2*, and thereby pancreatic iron content, from hepatic and splenic R2*. Yet, reliable results can be achieved only in the group of frequently transfused patients, suffering from leukemia (n=4), anemia (n=4), or MDS (n=3).Further studies are needed to evaluate probable relation of pancreatic R2* to its exocrine and endocrine function. Furthermore, in analogy to 3, it may be evaluated whether cardiac R2*, which can be determined directly, but requires lengthy MR procedures due to heart motion, can be calculated from R2* values obtained in spleen and liver.
Acknowledgements
No acknowledgement found.References
1. Breuer FA, Blaimer M, Mueller MF, et al. Controlled aliasing in volumetric parallel imaging (2D CAIPIRINHA). Magn Reson Med. 2006; 55(3): 549-556
2. Zhong X, Nickel MD, Kannengiesser SA,et al. Liver fat quantification using a multi-step adaptive fitting approach with multi-echo GRE imaging. Magn Reson Med. 2014; 72(5): 1353-1365
3. Noetzli LJ, Papudesi J, Coates TD, et al. Pancreatic iron loading predicts cardiac iron loading in thalassemia major. Blood 2009; 114(19): 4021-4026
Figures
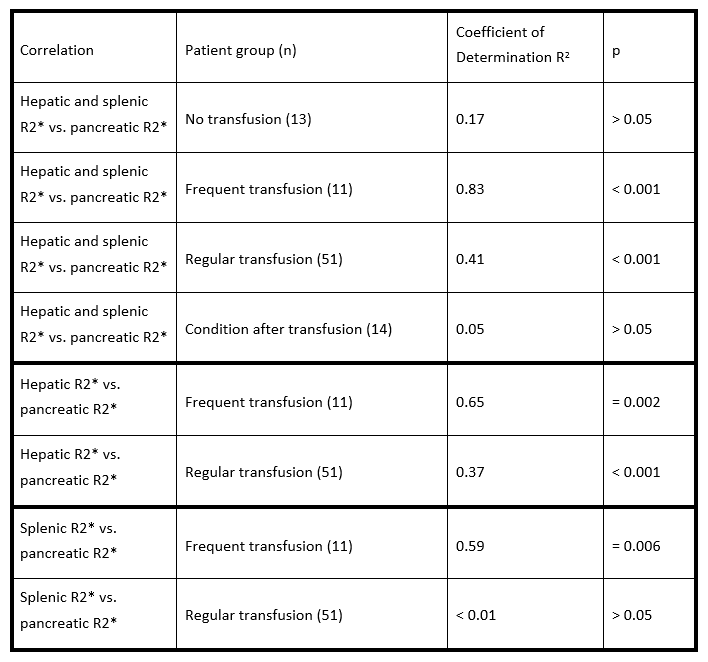
Table 1.
Summary of different correlations in patient groups.
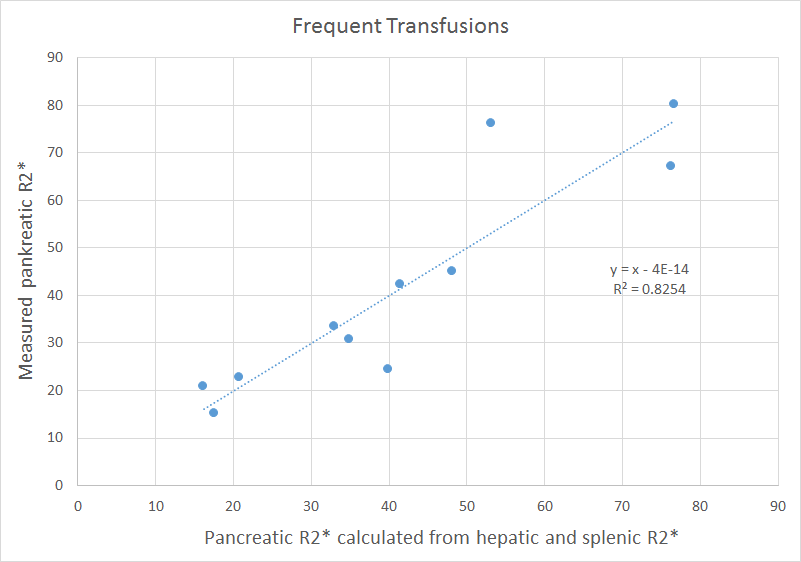
Figure 1.
Scatterplot of measured vs. calculated pancreatic R2* values. Included are the regression line and its equation. This level of correlation was only observed in the group of frequently transfused patients, suffering from leukemia, anemia, or MDS.