2510
Quantitative study on DWI, T1 mapping, T2 mapping, APT, IVIM and 3D mDIXON-quant of pancreas in fatty liver patients1Department of Radiology, the First Affiliated Hospital of Dalian Medical University, Dalian, Dalian, China, 2Dalian medical university, Dalian, China, 3Department of Radiology, the First Affiliated Hospital of Dalian Medical University, Dalian, China, 4Philips Healthcare, Beijing, China
Synopsis
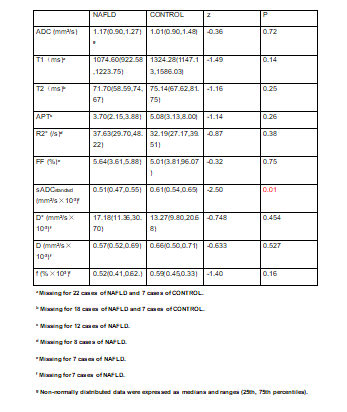
At present study, ADC, T1, T2, APT, sADC, D*,D, f, FF and R2* of pancreas in patients with fatty liver and control subjects were measured. This study viewed that there was a significant difference in sADC between two groups (P=0.01). This may illustrate that fatty liver has an impact on the function of pancreas.
Introduction
At present, clinical pancreatic fibrosis is an important pathological process of pancreatic injury repair caused by acute and chronic pancreatitis, pancreatic tumor and other pancreatic diseases[1]. Novel quantitative MR imaging techniques provide in vivo characterization of tissues and have potential to be a non-invasive biomarker to diagnose certain solid organ pathologies, such as DWI, IVIM, 3D mDIXON-Quant[2-3]. Quantitative imaging metrics can also be used to monitor the course of therapy in clinical trials. However, data on the quantitative study of pancreatic DWI, IVIM, T1 mapping, T2 mapping and 3D mDIXON-Quant in patients with fatty liver are insufficient.Purpose
The purpose of this study was to quantify the DWI, APT, IVIM, T1 mapping, T2 mapping and 3D mDIXON-Quant parametric maps of the pancreas in patients fatty liver.Materials and method
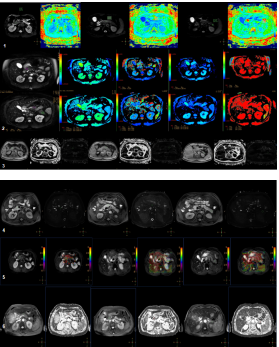
26 patients with fatty liver and 13 normal subjects were included in this study and divided into NAFLD and normal groups respectively. All subjects underwent upper abdomen MRI scans including 3D mDIXON Quant for fat fraction (FF) and R2* maps, DWI for ADC map, IVIM for D, D* and f maps, T2 mapping and T1 mapping on a 3.0 T MR scanner (Ingenia CX, Philips Healthcare, the Netherlands). 3D mDIXON-Quant sequence scanning parameters: FOV=375mm, TR/TE=6.0/1.05ms, voxel size 2.3mm×1.8mm, slice thick 5.0/-2.5. DWI sequence scanning parameters: FOV=450mm, TR/TE=7700/74ms, voxel size 3.7mm×6.3mm, slice thick 6.0/0. IVIM sequence scanning parameters: FOV=400mm, TR/TE=3000/91ms, voxel size 3.0mm×2.5mm, slice thick 7.0/1.0. T2 mapping scanning parameters: FOV=400mm, TR/TE=1200ms, voxel size 2.0mm×2.2mm, slice thick 7.0/1.0.T2 mapping scanning parameters:FOV=400mm,TR/TE=2/1ms, voxel size 1.6mm×2.2mm, slice thick 10.0.APT scanning parameters:FOV=130mm,TR/TE=6500/8ms, voxel size 2.0mm×1.5mm, slice thick 7.0On ISP workstation (IntelliSpace Portal, Philips healthcare), 2D region of interest (ROI) were placed on the head, body and tail of pancreas in DWI (Fig.1), IVIM (Fig.2), 3D mDIXON-Quant (Fig.3), T2 mapping (Fig.4), APT (Fig.5), and T1 mapping (Fig.6), respectively. The mean value of three ROIs was calculated as the value of the whole pancreas. Area of ROIs were approximately 25-100 mm2. All ROIs were placed within the interested tissue by avoiding blood vessels, pancreatic duct and abdominal adipose tissue as much as possible. The Mann-Whitney U analysis was used to test the difference between two groups. This study has been approved by the local IRB.Results
There were no significant difference between DWI, APT, T1 mapping, T2 mapping and 3D mDixon-Quant (P>0.05) parametric maps. The noticeable difference was sADC(p=0.01).Discussion
In cirrhosis patients with fatty liver, the sADC value of the pancreas is lower than that of normal people, suggesting that cells are densely packed and the extracellular space is reduced, resulting in limited water diffusion. This study suggests that patients with fatty liver may also have pancreatic fibrosis, and attention should be paid to the pancreas. Although the value of FF,T1,T2,and APT value is not statistically significant, the pancreatic fat infiltration in patients with fatty liver is higher than that in normal people. There is a certain trend in the parametric maps between NAFLD and control groups, but the current findings may be limited by the the small sample size. We will expand the sample size for future study.Conclusion
This study showed that there was significant difference of sADC (P=0.01) between NAFLD and normal groups. This may illustrate the impact fatty liver on the function of pancreas.Acknowledgements
No acknowledgementReferences
1. Temel Tirkes, Dhiraj Yadav,et al. Magnetic resonance imaging as a non invasive method for the assessment of pancreatic fbrosis (MINIMAP): a comprehensive study design from the consortium for the study of chronic pancreatitis, Abdominal Radiology (2019)44:2809–2821.
2. Christophe Cassinotto, Matthieu Feldis, et al.MR relaxometry in chronic liver diseases: Comparison of T1 mapping, T2 mapping, and diffusion-weighted imaging for assessing cirrhosis diagnosis and severity, European Journal of Radiology 84 (2015) 1459–1465.
3. Yoon Jeong Hee, Lee Jeong Min, Lee Kyung Bun et al. Pancreatic Steatosis and Fibrosis: Quantitative Assessment with Preoperative Multiparametric MR Imaging[J]. Radiology, 2016, 279: 140-50.
Figures