2506
Histogram Analysis of T1 relaxation time in the rotating frame and Apparent Diffusion Coefficient for Diagnosis of Liver Fibrosis1Zhujiang Hospital, Southern Medical University, Guangzhou, China, 2Shenzhen People’s Hospital, Clinical Medical College of Jinan University, Shenzhen, China, 3Phlips Healthcare, Guangzhou, China, 4The Third Affiliated Hospital of Southern Medical University, Guangzhou, China, 5Guangdong Provincial Key Laboratory of Medical Image Processing, School of Biomedical Engineering, Southern Medical University, Guangzhou, China
Synopsis
To
explore the potential of histogram analysis to evaluate the liver fibrosis
stages, histogram of T1rho and ADC were acquired from liver fibrosis model
built in seventy-five rats by injecting 50% carbon tetrachloride and olive oil.
In this study, we found that the parameters of histogram analysis showed strong
correlations with liver fibrosis stages, as well as inflammatory activity,while T1rho is regarded to be better than ADC.
Introduction
Early diagnosis and staging of liver fibrosis are vital clinical components[1]. Both T1 relaxation time in the rotating frame (T1rho) and apparent diffusion coefficient (ADC) have been employed and play a valuable role in differentiating liver fibrosis stages[2, 3]. However, routine MR signal measurements in previous studies only provide mean values, which may less effectively reflect spatial distribution underlying the MR signal. Histogram analysis is a new method to obtain the heterogeneity within region of interests (ROIs)[4, 5]. Therefore, we aim to investigate the diagnosis value of both T1rho and ADC histogram analysis in evaluating and quantifying liver fibrosis, as well as the potential influence of inflammatory activity.Material and Method
Seventy-five male Sprague-Dawley rats were randomly divided into four experimental group (n=57) and one control group (n=18). Liver fibrosis model was established by subcutaneous injection of 50% carbon tetrachloride (CCl4) and olive oil. T1rho and ADC (gradient factor b-values of 0 and 800 s/mm2) were performed with a 3.0T clinical scanner(Achieva 3.0T TX, Philips Healthcare, Best, Netherlands), using an animal coil. T1rho was performed using turbo field echo (TFE) sequence, scanning parameters were as follow: TR/TE=4.2ms/2.1ms; FOV=60mm*60mm; slice thickness=2mm; number of slice=5; flip angle=10°, matrix=100*100; spinlock frequency=500Hz; spin lock time=0, 27, 54ms respectively. The liver tissue was sampled for pathological test and liver fibrosis staging. The histograms were derived from T1rho relaxation map and ADC map. ROIs were drawn manually on axial imaging for 3D volume area, avoiding artifacts and large vessels. Entropy, kurtosis, mean, median, skewness, uniformity and 10th and 90th percentiles were generated and compared according to the liver fibrosis stage and inflammatory activity.Results and Discussion
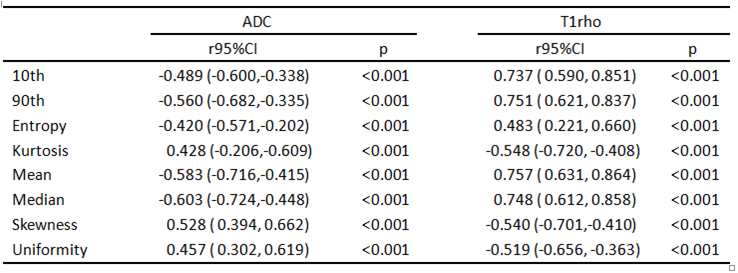
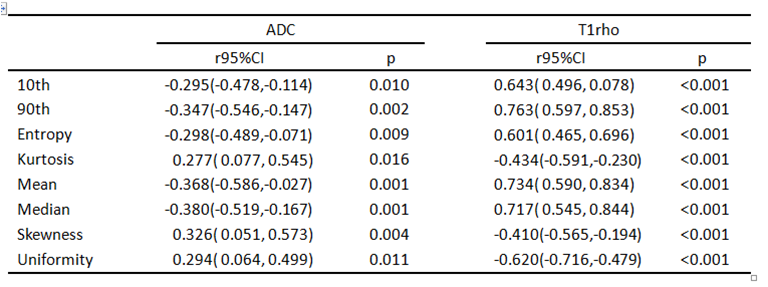
75 rats were included in total, and 18, 18, 17, 11, and 11 rats were diagnosed as F0-F4. Entropy, kurtosis, mean, median, skewness, uniformity and 10th and 90th percentiles of both T1rho and ADC demonstrated significant correlation with fibrosis stage(r=-0.603 to 0.757, p<0.001) and inflammatory activity (r=-0.620 to 0.763, p<0.001 to p=0.016) (Table1,2). To distinguish the fibrosis stage F≥1 and F≥4, 90th percentiles of T1rho map acquired AUCs of 0.988 and 0.892, and at the same time 0.823 and 0.712 for median of ADC map. ROC curves showed that 90th percentiles of T1rho map achieved remarkably higher AUCs than median of ADC map, and statistical significance existed in pairwise comparisons (p=0.0006 and p=0.013) (Fig 3).Conclusion
Histogram analysis of both T1rho and ADC exhibited significant correlations with the stages of liver fibrosis and inflammatory activity, while the former is considered superior to the latter one in staging liver fibrosis.Acknowledgements
References
[1]. Marcellin, P., et al., Regression of cirrhosis during treatment with tenofovir disoproxil fumarate for chronic hepatitis B: a 5-year open-label follow-up study. Lancet, 2013. 381(9865): p. 468-75.
[2]. Hu, G., et al., Assessment of liver fibrosis in rats by MRI with apparent diffusion coefficient and T1 relaxation time in the rotating frame. J Magn Reson Imaging, 2016. 43(5): p. 1082-9.
[3]. Hu, G., et al., Comparison of T1 Mapping and T1rho Values with Conventional Diffusion-weighted Imaging to Assess Fibrosis in a Rat Model of Unilateral Ureteral Obstruction. Acad Radiol, 2019. 26(1): p. 22-29.
[4]. Sheng, R.F., et al., Histogram Analysis of Diffusion Kurtosis Magnetic Resonance Imaging for Diagnosis of Hepatic Fibrosis. Korean J Radiol, 2018. 19(5): p. 916-922.
[5]. Hu, X.X., et al., Whole-tumor MRI histogram analyses of hepatocellular carcinoma: Correlations with Ki-67 labeling index. J Magn Reson Imaging, 2017. 46(2): p. 383-392.
Figures