2505
Assessment of fibrosis grades in chronic liver disease using liver heterogeneity and nodularity quantification program
Tae-Hoon Kim1, Ji Eon Kim1, Jong-Hyun Ryu1, SeungJin Kim2, Min-Gi Pak2, Chang-Won Jeong1, and Kwon-Ha Yoon1,3
1Medical Convergence Research Center, Wonkwang University, Iksan, Korea, Republic of, 2Medical Science, Wonkwang University, Iksan, Korea, Republic of, 3Radiology, Wonkwang University, Iksan, Korea, Republic of
1Medical Convergence Research Center, Wonkwang University, Iksan, Korea, Republic of, 2Medical Science, Wonkwang University, Iksan, Korea, Republic of, 3Radiology, Wonkwang University, Iksan, Korea, Republic of
Synopsis
Liver fibrosis is a hallmark of chronic liver disease (CLD) characterized by the excessive accumulation of extracellular matrix proteins. To diagnose and grade the liver fibrosis, liver biopsy is the reference standard, however the method has some limitations, including potential pain, sampling variability, and low patient acceptance. Therefore, there have been efforts to develop noninvasive imaging techniques and quantification softwares for diagnosis, staging, and monitoring of liver fibrosis. This study developed a MRI-suitable quantification program for assessing heterogeneity and nodularity in the liver and compared the difference between fibrosis grades in CLD.
Introduction
Liver fibrosis is a hallmark of chronic liver disease (CLD) characterized by the excessive accumulation of extracellular matrix proteins (for fibrogenesis) [1]. Liver fibrosis may progress to cirrhosis, the end stage, which constitutes the most important risk factor for developing hepatocellular carcinoma [2]. Thus, early detection and treatment of the underlying cause of liver disease is critical because liver transplantation constitutes the only curative therapy for decompensated liver cirrhosis.Although liver biopsy is the gold standard for diagnosis and staging of liver fibrosis, the method has some limitations, including sampling errors, low patient acceptance and complications such as pain, bleeding, infection and rarely death [3]. Hence, there have been considerable efforts to develop noninvasive imaging techniques and quantification programs for diagnosis, staging, and monitoring of liver fibrosis. Recently, several quantification softwares in liver diseases have been introduced for assessing the clinical indication of liver fibrosis using MR images. Heterogeneity program using coefficient of variation (CV) map can help to grade the fibrosis severity in the patients with chronic hepatitis B [4]. Also, liver surface nodularity program using multi-polynomial curve fitting can be useful to differentiate the fibrosis severity in the nonalcoholic fatty liver disease (NAFLD) [5]. Therefore, liver heterogeneity and surface nodularity scores can serve important information to differentially diagnose liver fibrosis in the liver diseases.
In this study, we developed a MRI-suitable quantification software for assessing liver heterogeneity and nodularity and compared hepatic heterogeneity and nodularity according to fibrosis grades in CLD.
Subjects and Methods
Liver heterogeneity (LHet) and (LNod) nodularity quantification program was coded by Matlab (ver. 2016a). The processing procedures (LHet and LNod) were as follows: bias correction, semi-automatic boundary detection, liver segmentation and LHet & LNod measurements in the segmented liver (Fig. 1).The study protocol was approved by the institutional review board (IRB) of University Hospital. A total of 90 patients with CLD divided to three groups according to the serum biomarkers of fibrosis-4 index (FIB-4, equation I) values as follows: G1, non-significant fibrosis group <1.45; G2, significant fibrosis group 1.45-3.25; and G3, advanced fibrosis group >3.25 (see Table 1).
FIB-4 = (Age [year] × AST [U/L] ) / (platelet count [109/L] × square root of ALT[U/L]) -- Eq. I
* The upper limit of normal (ULN) AST was 35 in this study.
All MRI examinations were performed on a 3T MRI scanner (Achieva; Philips, Netherlands) with a 32-channel receiver body matrix coil. The T1WI (repetition time [TR]/TE= 4.2/1.97 ms) were acquired with three-dimensional T1 high-resolution isotropic volume excitation pulse sequence: field of view (FOV)= 38×38×14 cm3, matrix size= 512×512, number of excitation (NEX)= 2, slice thickness= 0.74×0.74×2.0 mm3, number of slices= 70 and scan time= 14 sec. Together with a single breath-hold technique, the imaging plane in the upper abdomen was axial and the sequence was triggered to expiration. Additional multislice T1- and T2-weighted sequences were obtained in sagittal, axial and coronal planes as the liver MRI protocol. Total examination time ranged from 35–45 minutes.
Our LHet and LNod quantification program was used the MR images of DICOM format to generate the heterogeneity and nodularity scores using previously described procedure [4, 5]. The MR images were analyzed from the two radiologists and LNod scores were generated to assure that no sharp turns were falsely provided by the LNod program. At least three and/or four ROI measurements were performed for each subject. A final LNod score was calculated by the program as an averaged value of the individual measurements, with a higher LNod score indicating a higher degree of surface nodularity. LHet and LNod scores among fibrosis grades (G1-G3) were compared by using ANOVA with Tukey’s post-hoc test.
Results and Discussion
The liver heterogeneity and nodularity quantification was extracted as a reference line and two radiologists (with more than 10 years of experience) finally confirmed the liver surface line (Fig. 2). Mean LHet scores in three groups were G1 5.52±1.01, G2 6.78±1.24 and G3 7.55±2.16 (p<0.001; Table 2). In multiple comparison, LHet scores are significantly different from each other (G1 vs G2 (p=0.001); G1 vs G3 (p<0.001); and G2 vs G3 (p=0.001)). Mean LNod scores in three groups were G1 0.95±0.09, G2 1.12±0.12 and G3 1.15±0.17 (p<0.001; Table 2). In multiple comparison, LNod scores are significantly different in G1 vs G2 (p<0.001) and G1 vs G3 (p<0.001), whereas not significant difference between G2 vs G3 (p=0.287). Thus, the LHet and LNod quantification can be a non-invasive technique capable of detecting fibrotic changes in the liver of CLD. Especially, compared with LNod score, LHet score quantified from our CLD data focusing on fibrosis grades of CLD is a useful quantitative imaging biomarker that can be used to diagnose and stage hepatic fibrosis.Conclusion
This study developed a MRI-suitable liver heterogeneity and nodularity quantification software. The findings demonstrate that the quantitative heterogeneity and nodularity scores can help to differentially diagnose fibrosis stage in CLD using clinical MR images.Acknowledgements
This study was supported by the grants of the National Research Foundation of Korea (NRF) (2016M3A9A7918501) and the Korea Health Technology R&D Project through the Korea Health Industry Development Institute (KHIDI), funded by the Ministry of Health & Welfare (HI18C1216).References
- Kim TH, Jeong CW, Jun HY, Lee C, Noh S, Kim JE, Kim S, Yoon KH. Accuracy of proton magnetic resonance for diagnosing non-alcoholic steatohepatitis: a meta-analysis. Sci Rep. 2019; 9(1): 15002.
- Sebastiani G, Gkouvatsos K, Pantopoulos K. Chronic hepatitis C and liver fibrosis. World J Gastroenterol. 2014; 20: 11033–11053.
- Petitclerc L, Gilbert G, Nguyen BN, Tang A. Liver Fibrosis Quantification by Magnetic Resonance Imaging. Top Magn Reson Imaging. 2017; 26(6): 229–241.
- Lee GM, Kim YR, Ryu JH, Kim TH, Cho EY, Lee YH, Yoon KH. Quantitative Measurement of Hepatic Fibrosis with Gadoxetic Acid-Enhanced Magnetic Resonance Imaging in Patients with Chronic Hepatitis B Infection: A Comparative Study on Aspartate Aminotransferase to Platelet Ratio Index and Fibrosis-4 Index. Korean J Radiol. 2017; 18(3): 444-451.
- Kim TH, Kim JE, Ryu JH, Jeong CW. Development of liver surface nodularity quantification program and its clinical application in nonalcoholic fatty liver disease. Sci Rep. 2019; 9(1): 9994.
Figures
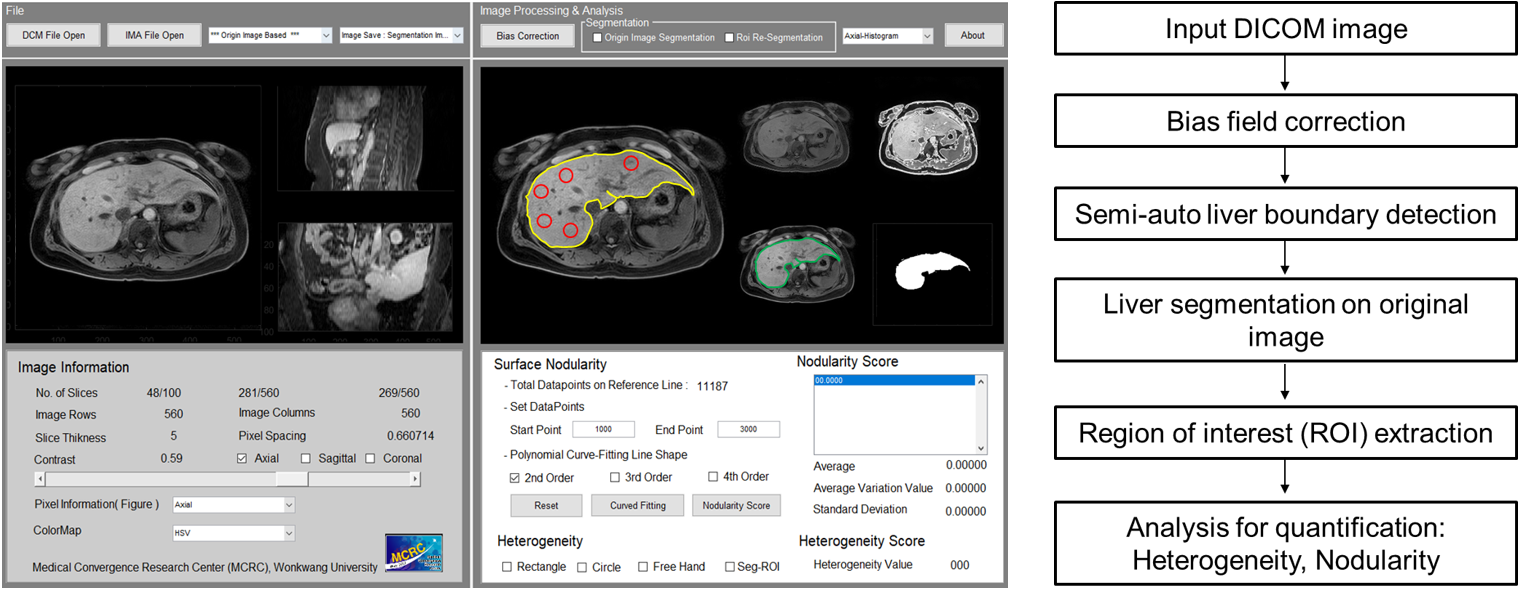
Figure 1. Graphical
user interface (GUI) of a customized quantification software for assessing liver
heterogeneity (LHet) and nodularity
(LNod) (left-side) and flowchart for
quantifying liver fibrosis in chronic liver disease (right-side)
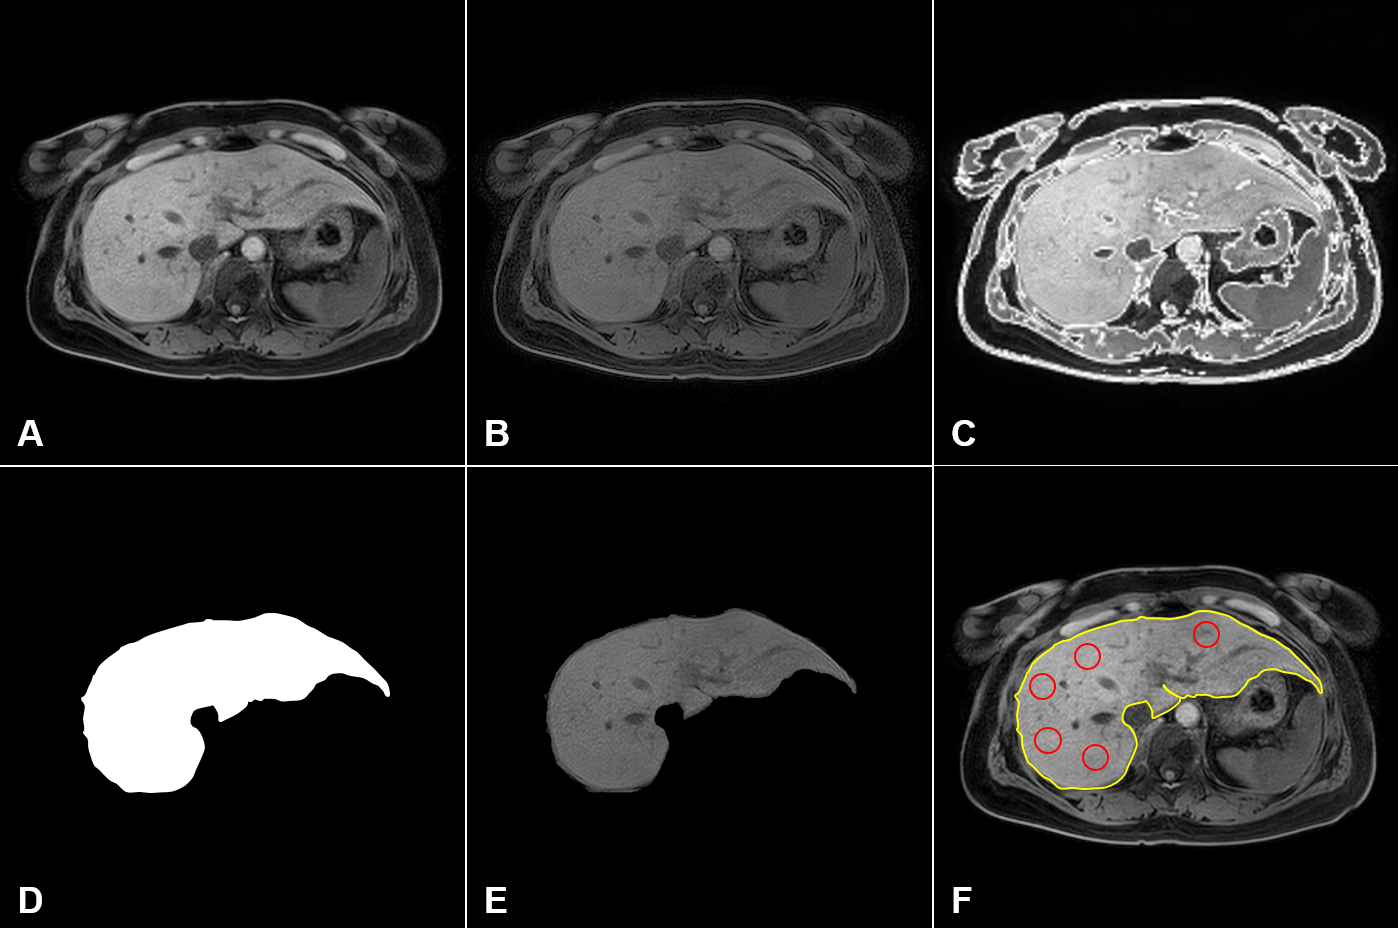
Figure 2. Representative post-processing images for
liver heterogeneity (LHet) and nodularity (LNod) quantification in a CLD patient: (A) raw
MRI data, (B) bias field correction, (C) liver boundary detection, (D) segmented
liver binary image, (E) ROI extraction, and (F) quantification (liver heterogeneity
= 5 red circles; surface nodularity = yellow-line).
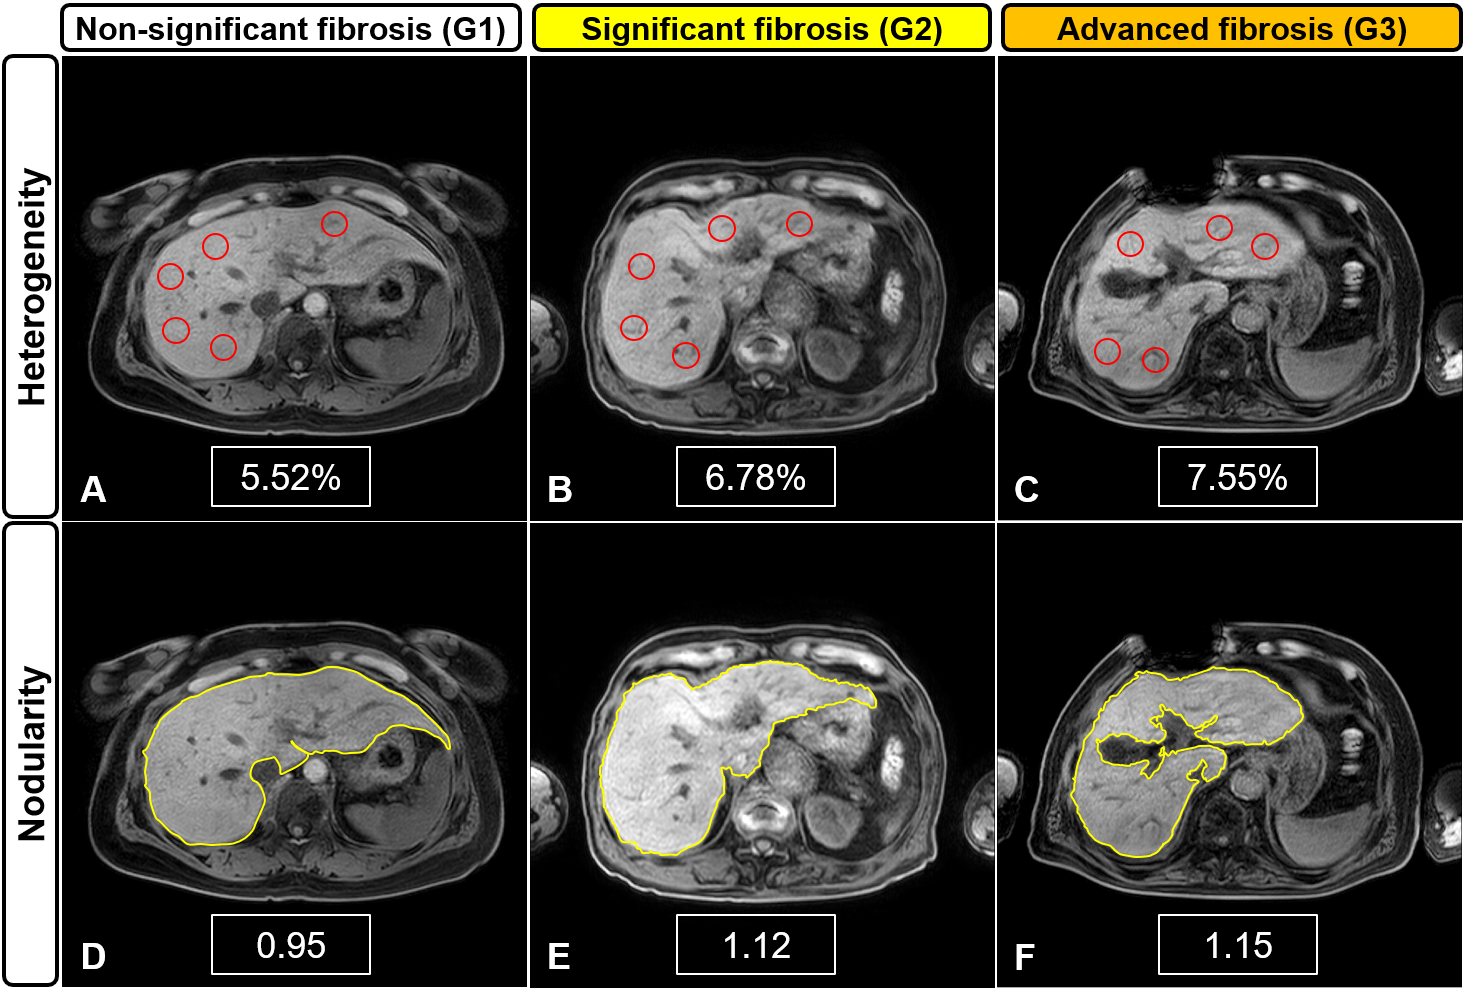
Figure 3. Representative MR images for liver
heterogeneity (LHet)
and
nodularity (LNod)
quantification
according to the fibrosis grades in CLD patients: G1 (A, D), G2 (B, E), and G3
(C, F). Higher heterogeneity and nodularity scores are seen with increased severity
in the fibrotic liver.
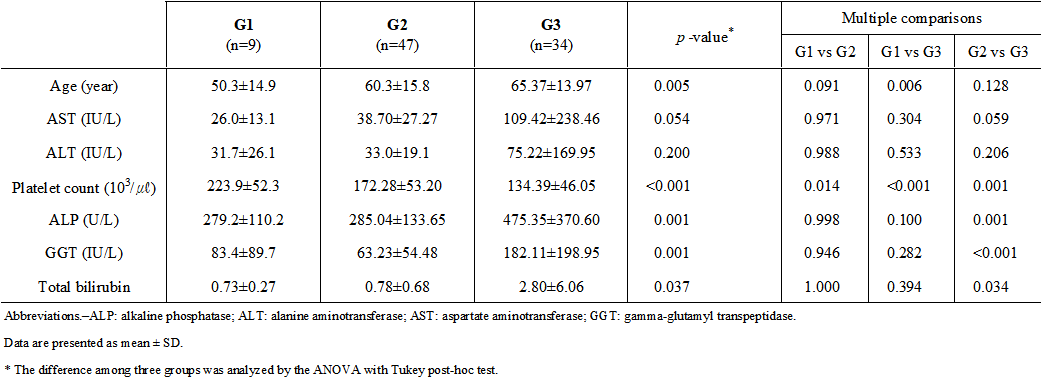
Table 1. Clinical data of serum
biochemistry in subgroups of chronic liver disease.
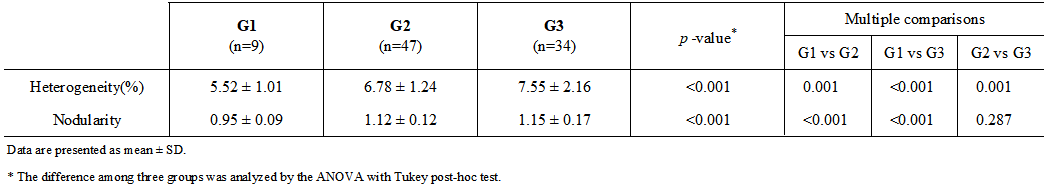
Table 2. Comparison
of liver
heterogeneity (LHet) and nodularity (LNod) scores according to fibrosis grades (G)