2503
Comparison of the degree of R1rho dispersion in liver between healthy volunteers and patients with liver disease
Minori Onoda1, Yu Ueda2, Satoshi Kobayashi1,3,4, Tosiaki Miyati3, Naoki Ohno3, Yudai Shogan1, Tadanori Takata1, Yukihiro Matsuura1, and Toshifumi Gabata4
1Department of Radiological Technology, Kanazawa University hospital, Kanazawa, Japan, 2Philips Japan, Tokyo, Japan, 3Faculty of Health Sciences, Institute of Medical, Pharmaceutical and Health Sciences, Kanazawa University, Kanazawa, Japan, 4Department of Radiology, Kanazawa University Hospital, Kanazawa, Japan
1Department of Radiological Technology, Kanazawa University hospital, Kanazawa, Japan, 2Philips Japan, Tokyo, Japan, 3Faculty of Health Sciences, Institute of Medical, Pharmaceutical and Health Sciences, Kanazawa University, Kanazawa, Japan, 4Department of Radiology, Kanazawa University Hospital, Kanazawa, Japan
Synopsis
In this study, we compared the degree of R1rho dispersion in liver of healthy volunteers and patients with liver disease to better understand the behavior of T1rho in liver. T1rho in normal liver tissue was correlated with the perfusion-independent diffusion coefficient (D) calculated by IVIM analysis, whereas in patients with liver disease, there was no correlation between T1rho and D. Furthermore, there was no significant difference between the R1rho dispersion values in liver between volunteers and patients.
Introduction
Even though liver T1rho has been proposed as a potential imaging biomarker for early detection of liver fibrosis, its clinical feasibility is a debated question. T1rho is sensitive to both slow macromolecular motions and chemical exchange between water and labile protons1. The dispersion of the relaxation rate of R1rho with spin-locking field frequency can be used to quantify parameters of proton exchange processes in tissue. ΔR1rho (the difference in rate between low and high locking fields) largely reflects the contribution of chemical exchange2. The purpose of this study was to compare the degree of ΔR1rho in liver between healthy volunteers and patients with liver disease and to investigate the behavior of T1rho in liver.Methods
Ten healthy volunteers (7 men and 3 women; mean age, 33.3 years) and nine patients with liver disease (2 hepatitis C virus infection, 2 hepatitis B infection, 4 Alcoholic hepatitis, 1 primary biliary cirrhosis) underwent both liver T1rho imaging and intravoxel incoherent motion (IVIM) imaging on a 3.0-T MRI unit (Ingenia CX 3.0T, Philips Medical Systems, Best, Netherlands). T1rho imaging was repeated at different spin-locking field (FSL) frequency of 100, 300, and 500Hz at spin lock times (TSL) of 1, 20, and 40ms. For IVIM analysis, diffusion-weighted images (DWI) with 9 b-values (0, 10, 30, 50, 100, 200, 400, 800, 1000 s/mm2) were used. For each subject, three regions of interest (ROI) were placed on right liver parenchyma that were free of large vessels and imaging artifacts on the same slice and position in each image. The mean of the three ROI measurements was recorded as the T1rho value or signal intensity of the liver in each T1rho image and DWI, respectively. We calculated R1rho by taking the reciprocal of T1rho and defined the difference in R1rho relaxation rate between low and high FSL as ΔR1rho: ΔR1rho = R1rho(100Hz) − R1rho(500Hz). We also calculated the perfusion-related diffusion coefficient (D*) and perfusion-independent diffusion coefficient (D) using IVIM analysis. In the single regression analysis, the coefficient of determination (r2) was used to examine the strength of the associations between T1rho values on the one hand and D* and D on the other. In addition, we used the Mann-Whitney U test to evaluate the ΔR1rho differences between volunteers and patients.Results
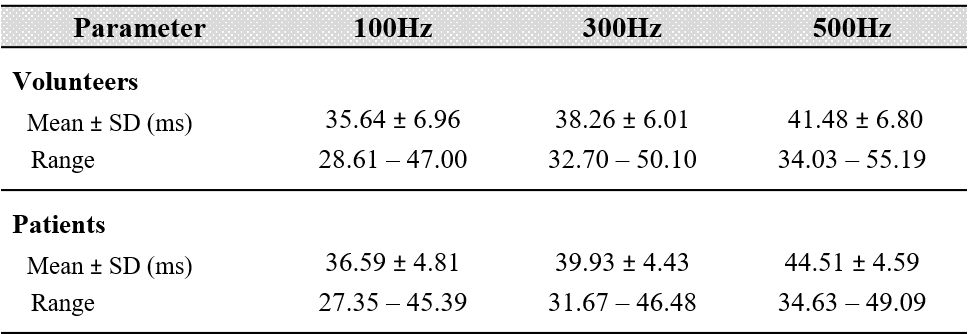
Table 1 shows the mean T1rho values at each FSL frequency in volunteers and patients. T1rho values increased as FSL increased (Fig.1), and the T1rho values of patients were higher than those of volunteers. In healthy volunteers, the T1rho values at each FSL frequency had a strong correlation with D (100Hz, r2 = 0.44; 300Hz, r2 = 0.51; 500Hz, r2 = 0.58) (Fig. 2). In contrast, in patients, there were no correlations between T1rho and D (Fig. 3). No significant correlations were observed between T1rho of all subjects at each FSL frequency and D*. Fig. 4 shows the differences in ΔR1rho between volunteers and patients. The median values of ΔR1rho in volunteers and patients were 3.29Hz and 4.88Hz, respectively. The ΔR1rho values of patients were higher than those of volunteers, but there was no significant difference between these groups (p = 0.28).Discussion
In our study, the mean T1rho values of patients with liver disease were significantly higher than those of healthy volunteers, which confirmed that T1rho imaging is able to distinguish between normal and diseased liver, as observed in other studies3, 4. A previous study reported that T1rho is sensitive to both slow macromolecular motions and chemical exchange2, and the current study showed a strong correlation between T1rho and D in healthy volunteers. Therefore, T1rho reflects restricted molecular diffusion in normal liver. However, although ΔR1rho describes the degree of R1rho dispersion, which can assess the contribution of chemical exchange to relaxation, there was no significant difference in ΔR1rho between volunteers and patients. These results indicate that T1rho values in diseased livers may be affected by factors other than diffusion and chemical exchange, such as nonuniformity of B0 and B15. Further study is needed to understand the behavior of T1rho in liver.Conclusion
Our study showed that T1rho was strongly correlated with D in the livers of healthy volunteers. Although R1rho dispersion values in liver could be measured, there were no differences in ΔR1rho between volunteers and patients.Acknowledgements
This work was supported by JSPS KAKENHI Grant number JP19K17264.References
- Cobb JG, Xie J, Gore JC. Contributions of chemical and diffusive exchange to T1ρ dispersion. Magn Reson Med. 2013; 69(5): 1357-66.
- Wang P, Zhu H, Kang H, et al. R1ρ dispersion and sodium imaging in human calf muscle. Magn Reson Imaging. 2017; 42: 139-143.
- Allkemper T, Sagmeister F, Cicinnati V, ea al. Evaluation of fibrotic liver disease with whole-liver T1ρ MR imaging: a feasibility study at 1.5 T. Radiology. 2014; 271(2): 408-15.
- Rauscher I, Eiber M, Ganter C, et al. Evaluation of T1ρ as a potential MR biomarker for liver cirrhosis: comparison of healthy control subjects and patients with liver cirrhosis. Eur J Radiol. 2014; 83(6): 900-904.
- Chen W. Artifacts correction for T1rho imaging with constant amplitude spin-lock. J Magn Reson. 2017; 274: 13-23.
Figures
Table
1. Liver T1rho values at each spin-locking field frequency in volunteers and
patients.
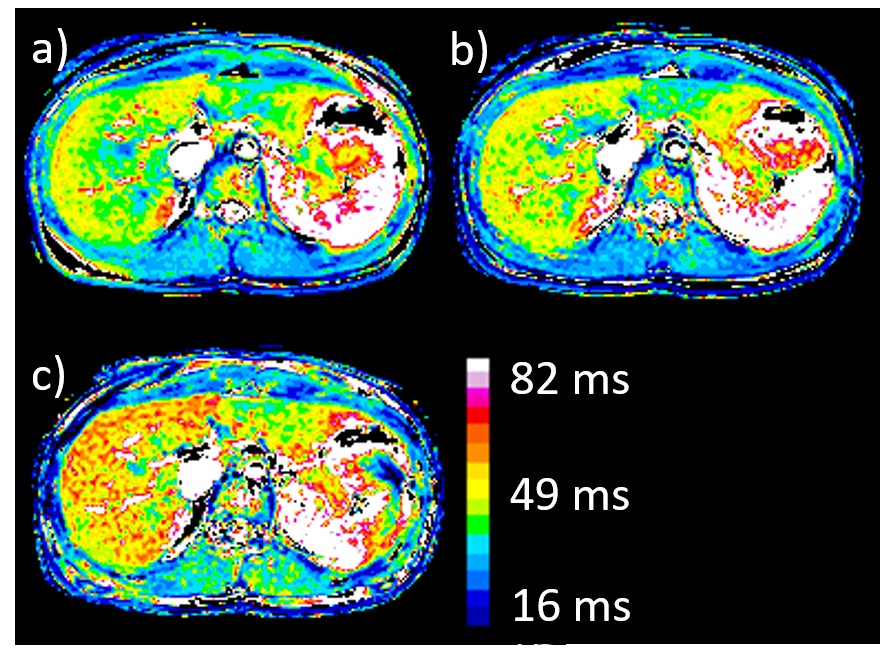
Fig. 1.
T1rho images at spin-locking field frequency of 100 (a), 300 (b) and 500 Hz (c). The
T1rho map image shows the differences in T1rho values as color distributions.
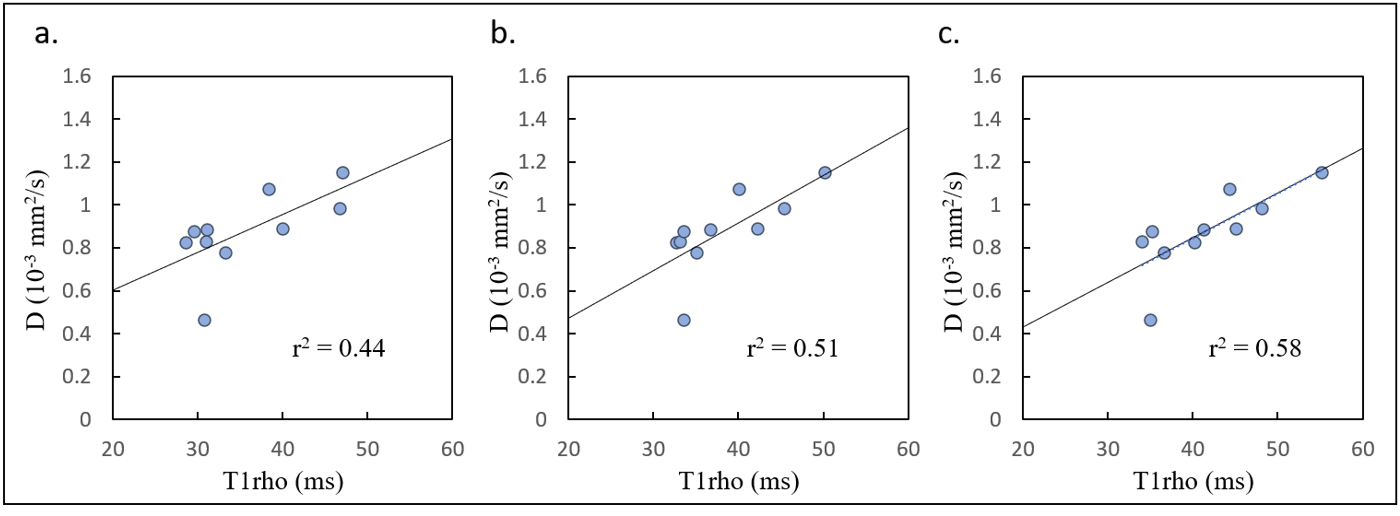
Fig. 2. T1rho at spin-locking field frequency of 100 (a), 300 (b) and 500 Hz (c) in healthy
volunteers. Straight lines are the regression lines.
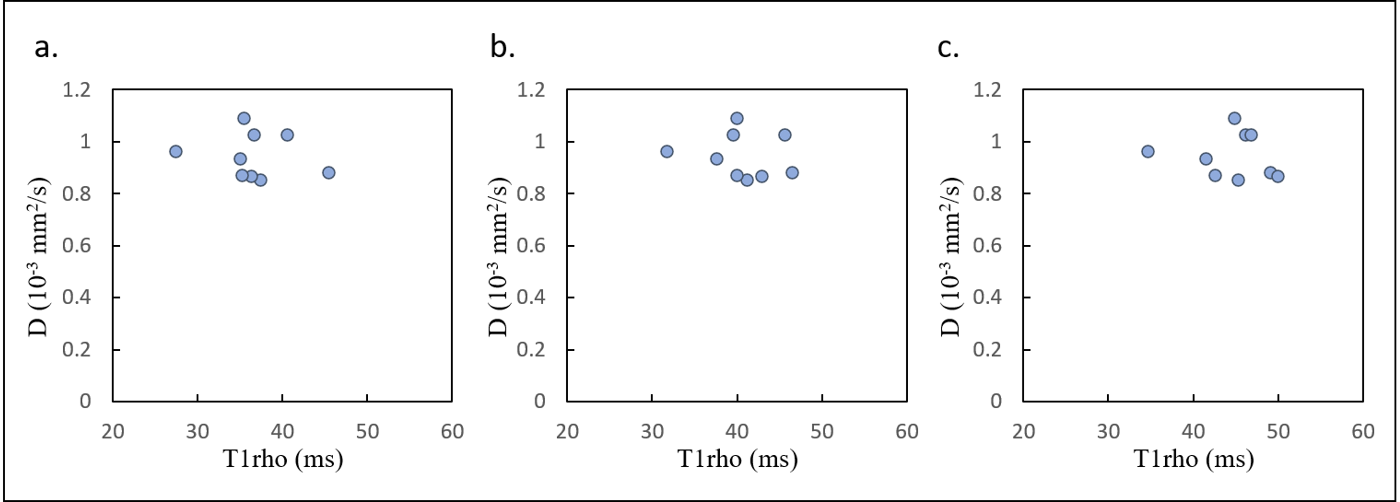
Fig. 3. T1rho at spin-locking field frequency of 100 (a), 300 (b) and 500
Hz (c) in patients.
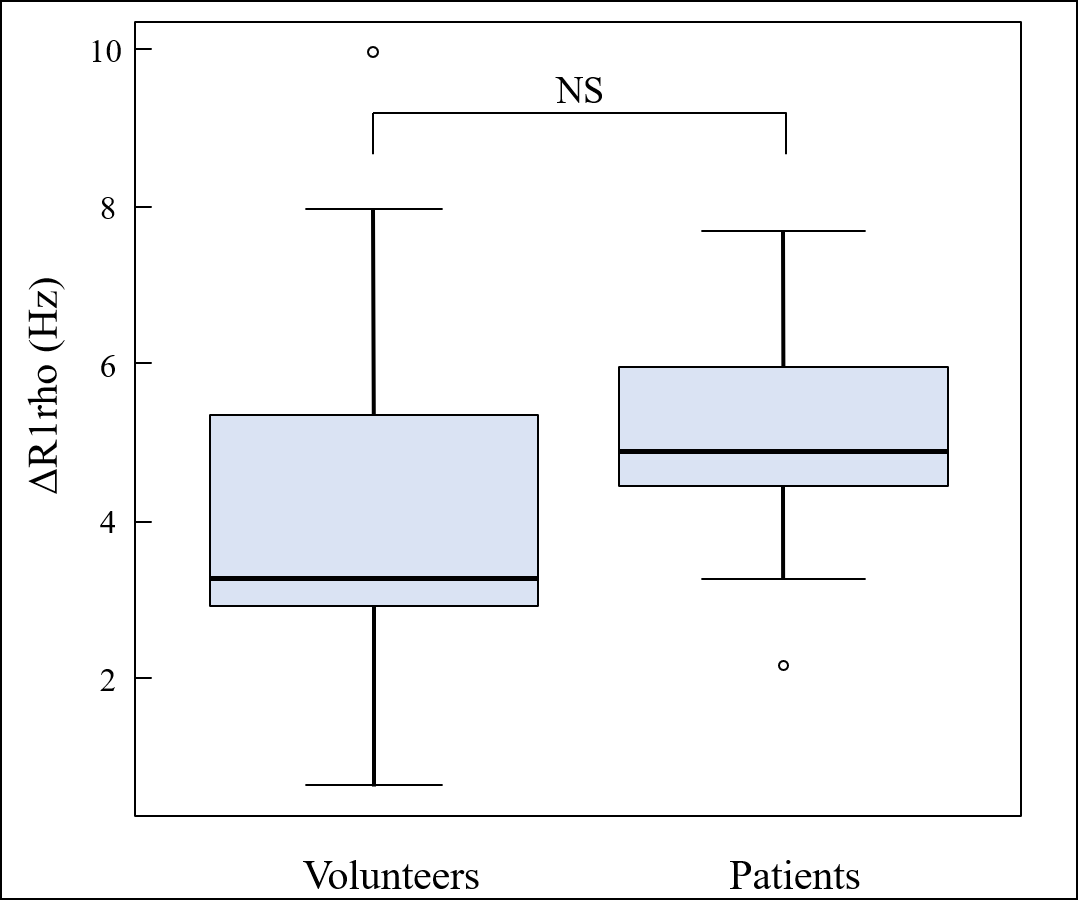
Fig. 4. Comparison
of ΔR1rho between volunteer and patient groups.