2502
Whole-liver apparent diffusion coefficient histogram analysis for the diagnosis and staging of liver fibrosis1First Clinical Medical College of LanZhou University, Lanzhou, Gansu, China, 2Radiology, First Hospital of LanZhou University, Lanzhou, Gansu, China
Synopsis
This study aimed to determine whether whole-liver apparent diffusion coefficient (ADC) histogram parameters can contribute to hepatic fibrosis staging. We evaluated quantitative histogram parameters between different pathological fibrosis stages. And the diagnostic performance of ADC histogram parameters in discriminating stage 1 or greater (≥F1), stage 2 or greater (≥F2), and stage 3 or greater (≥F3) liver fibrosis were compared. The results showed that many histogram parameters (kurtosis, skewness, entropy, mode, 75th and 90th percentiles) had statistical significance among the pathologic liver fibrosis stages (P<0.05), and kurtosis yielded the highest area under the curve (0.801).
Purpose
Conventional diffusion-weighted magnetic resonance imaging (DWI) is limited in quantitative evaluation of liver fibrosis, whole-liver apparent diffusion coefficient (ADC) histogram analysis might contributes to the diagnosis and staging of liver fibrosis. The study explored the value of whole-liver ADC histogram parameters in the diagnosis and staging of liver fibrosis.Materials and Methods
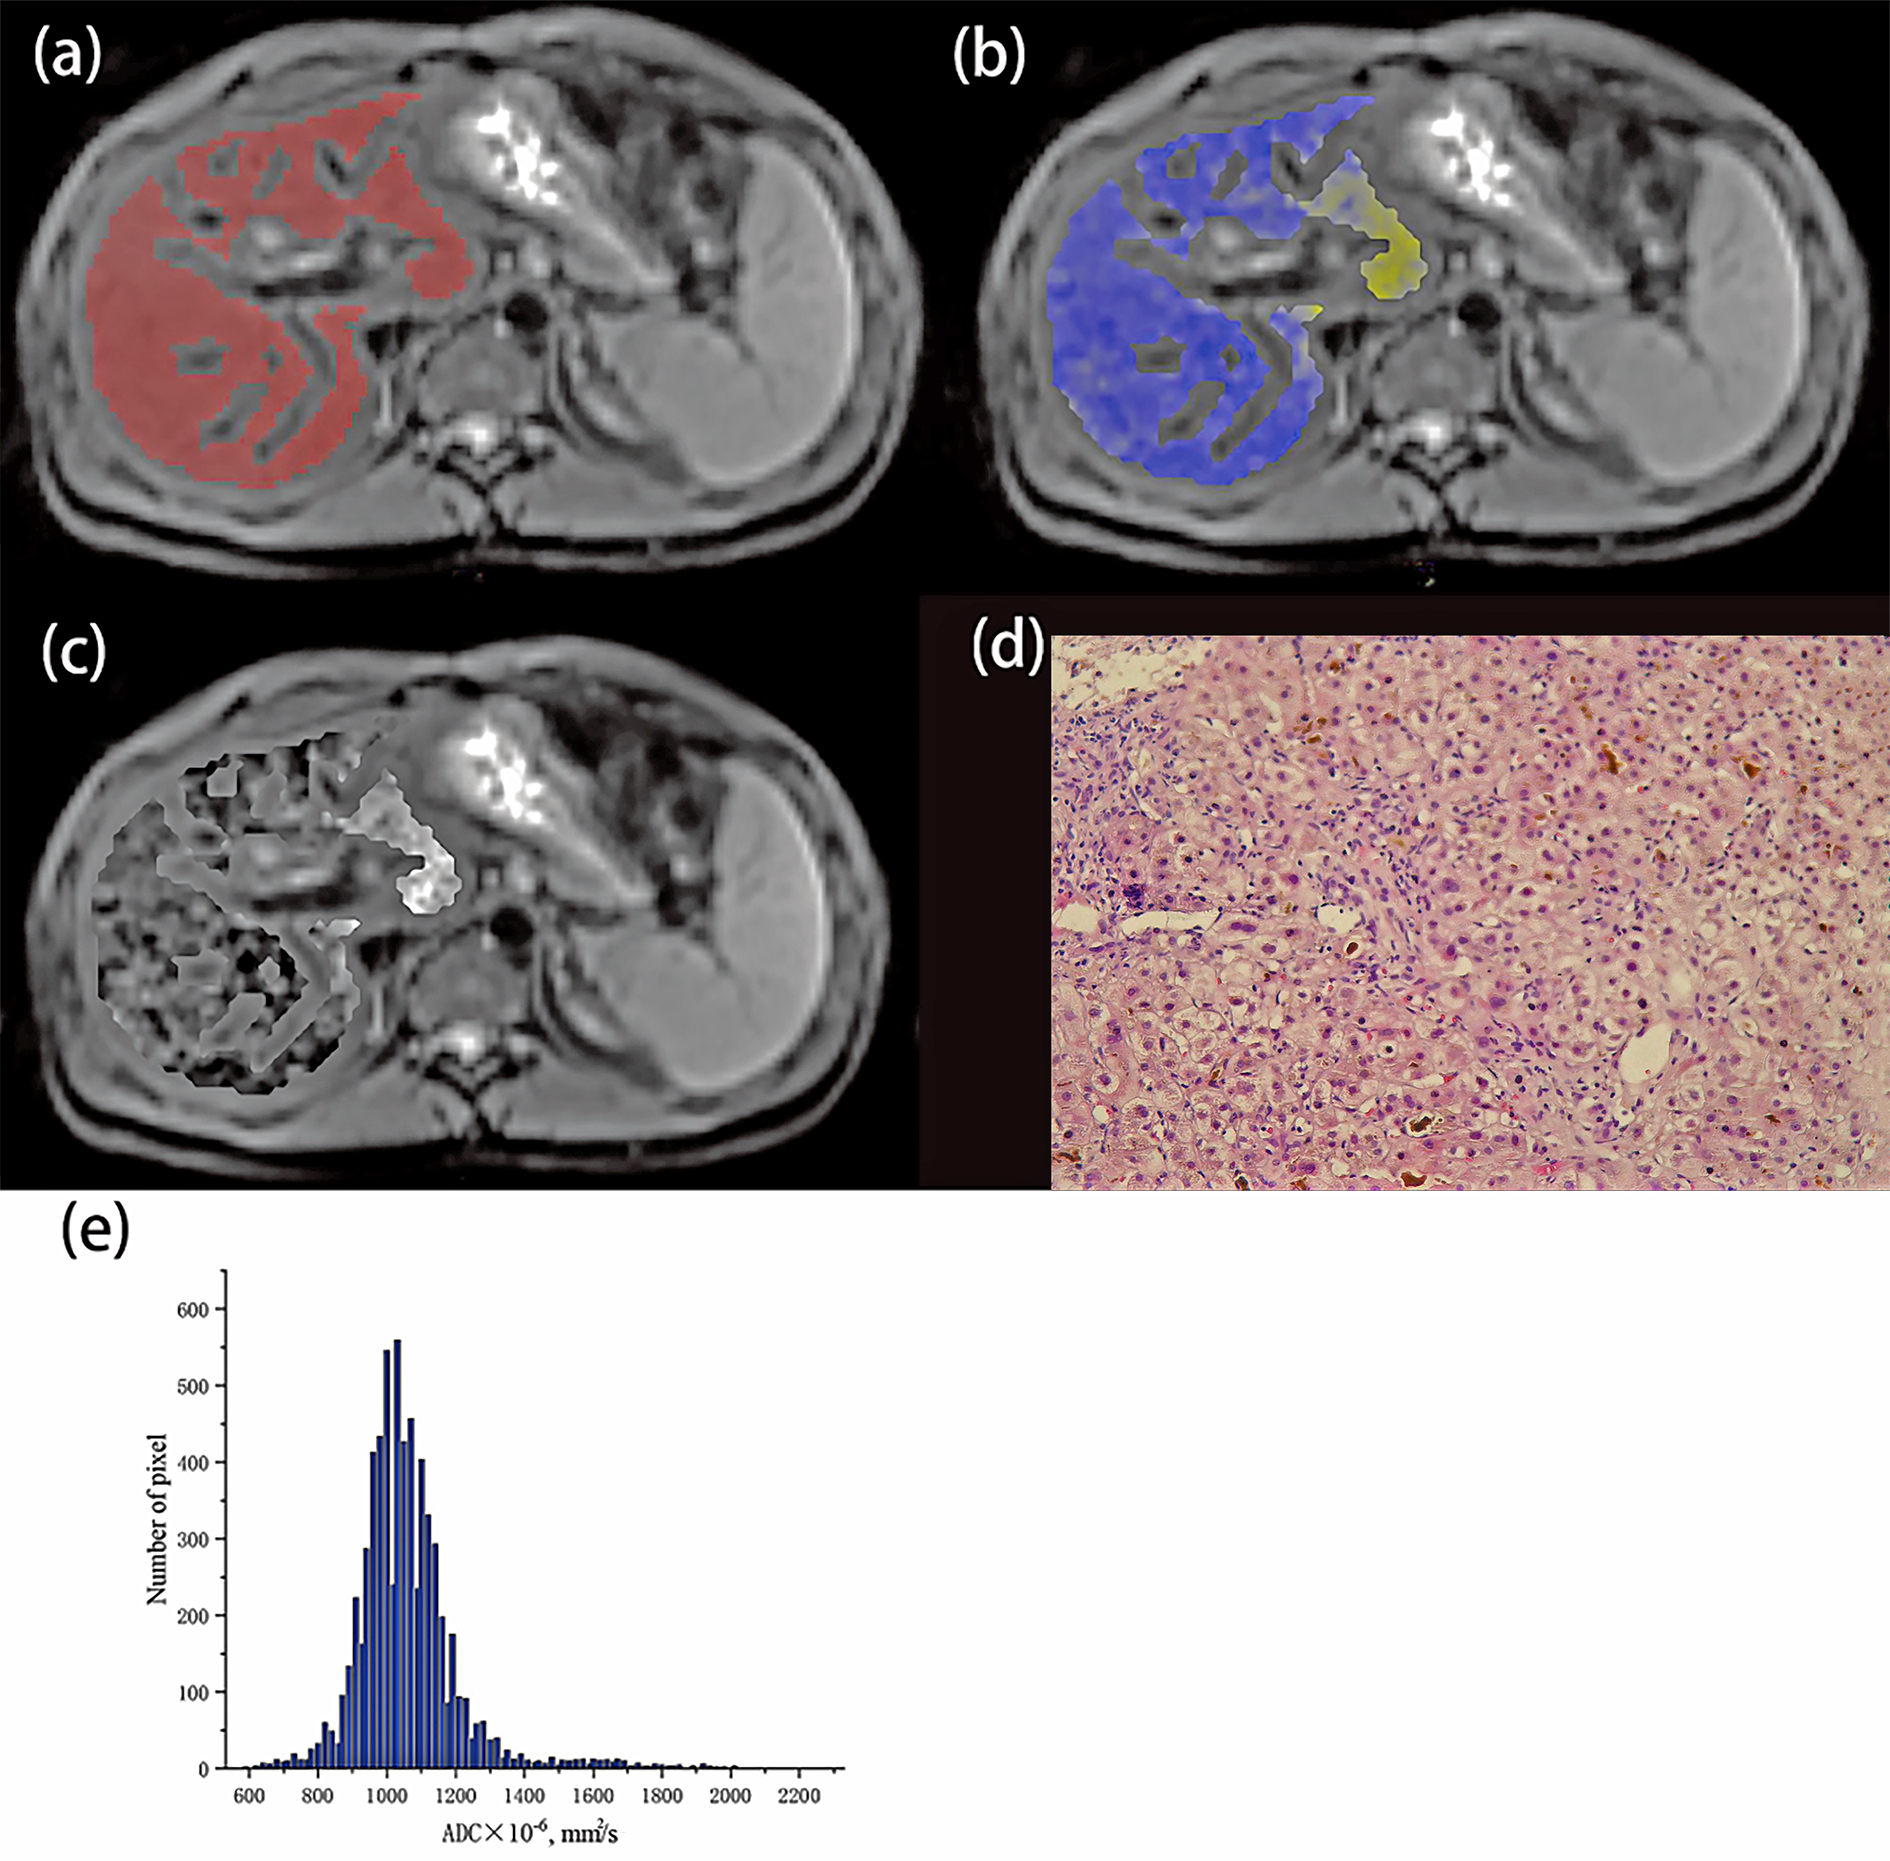
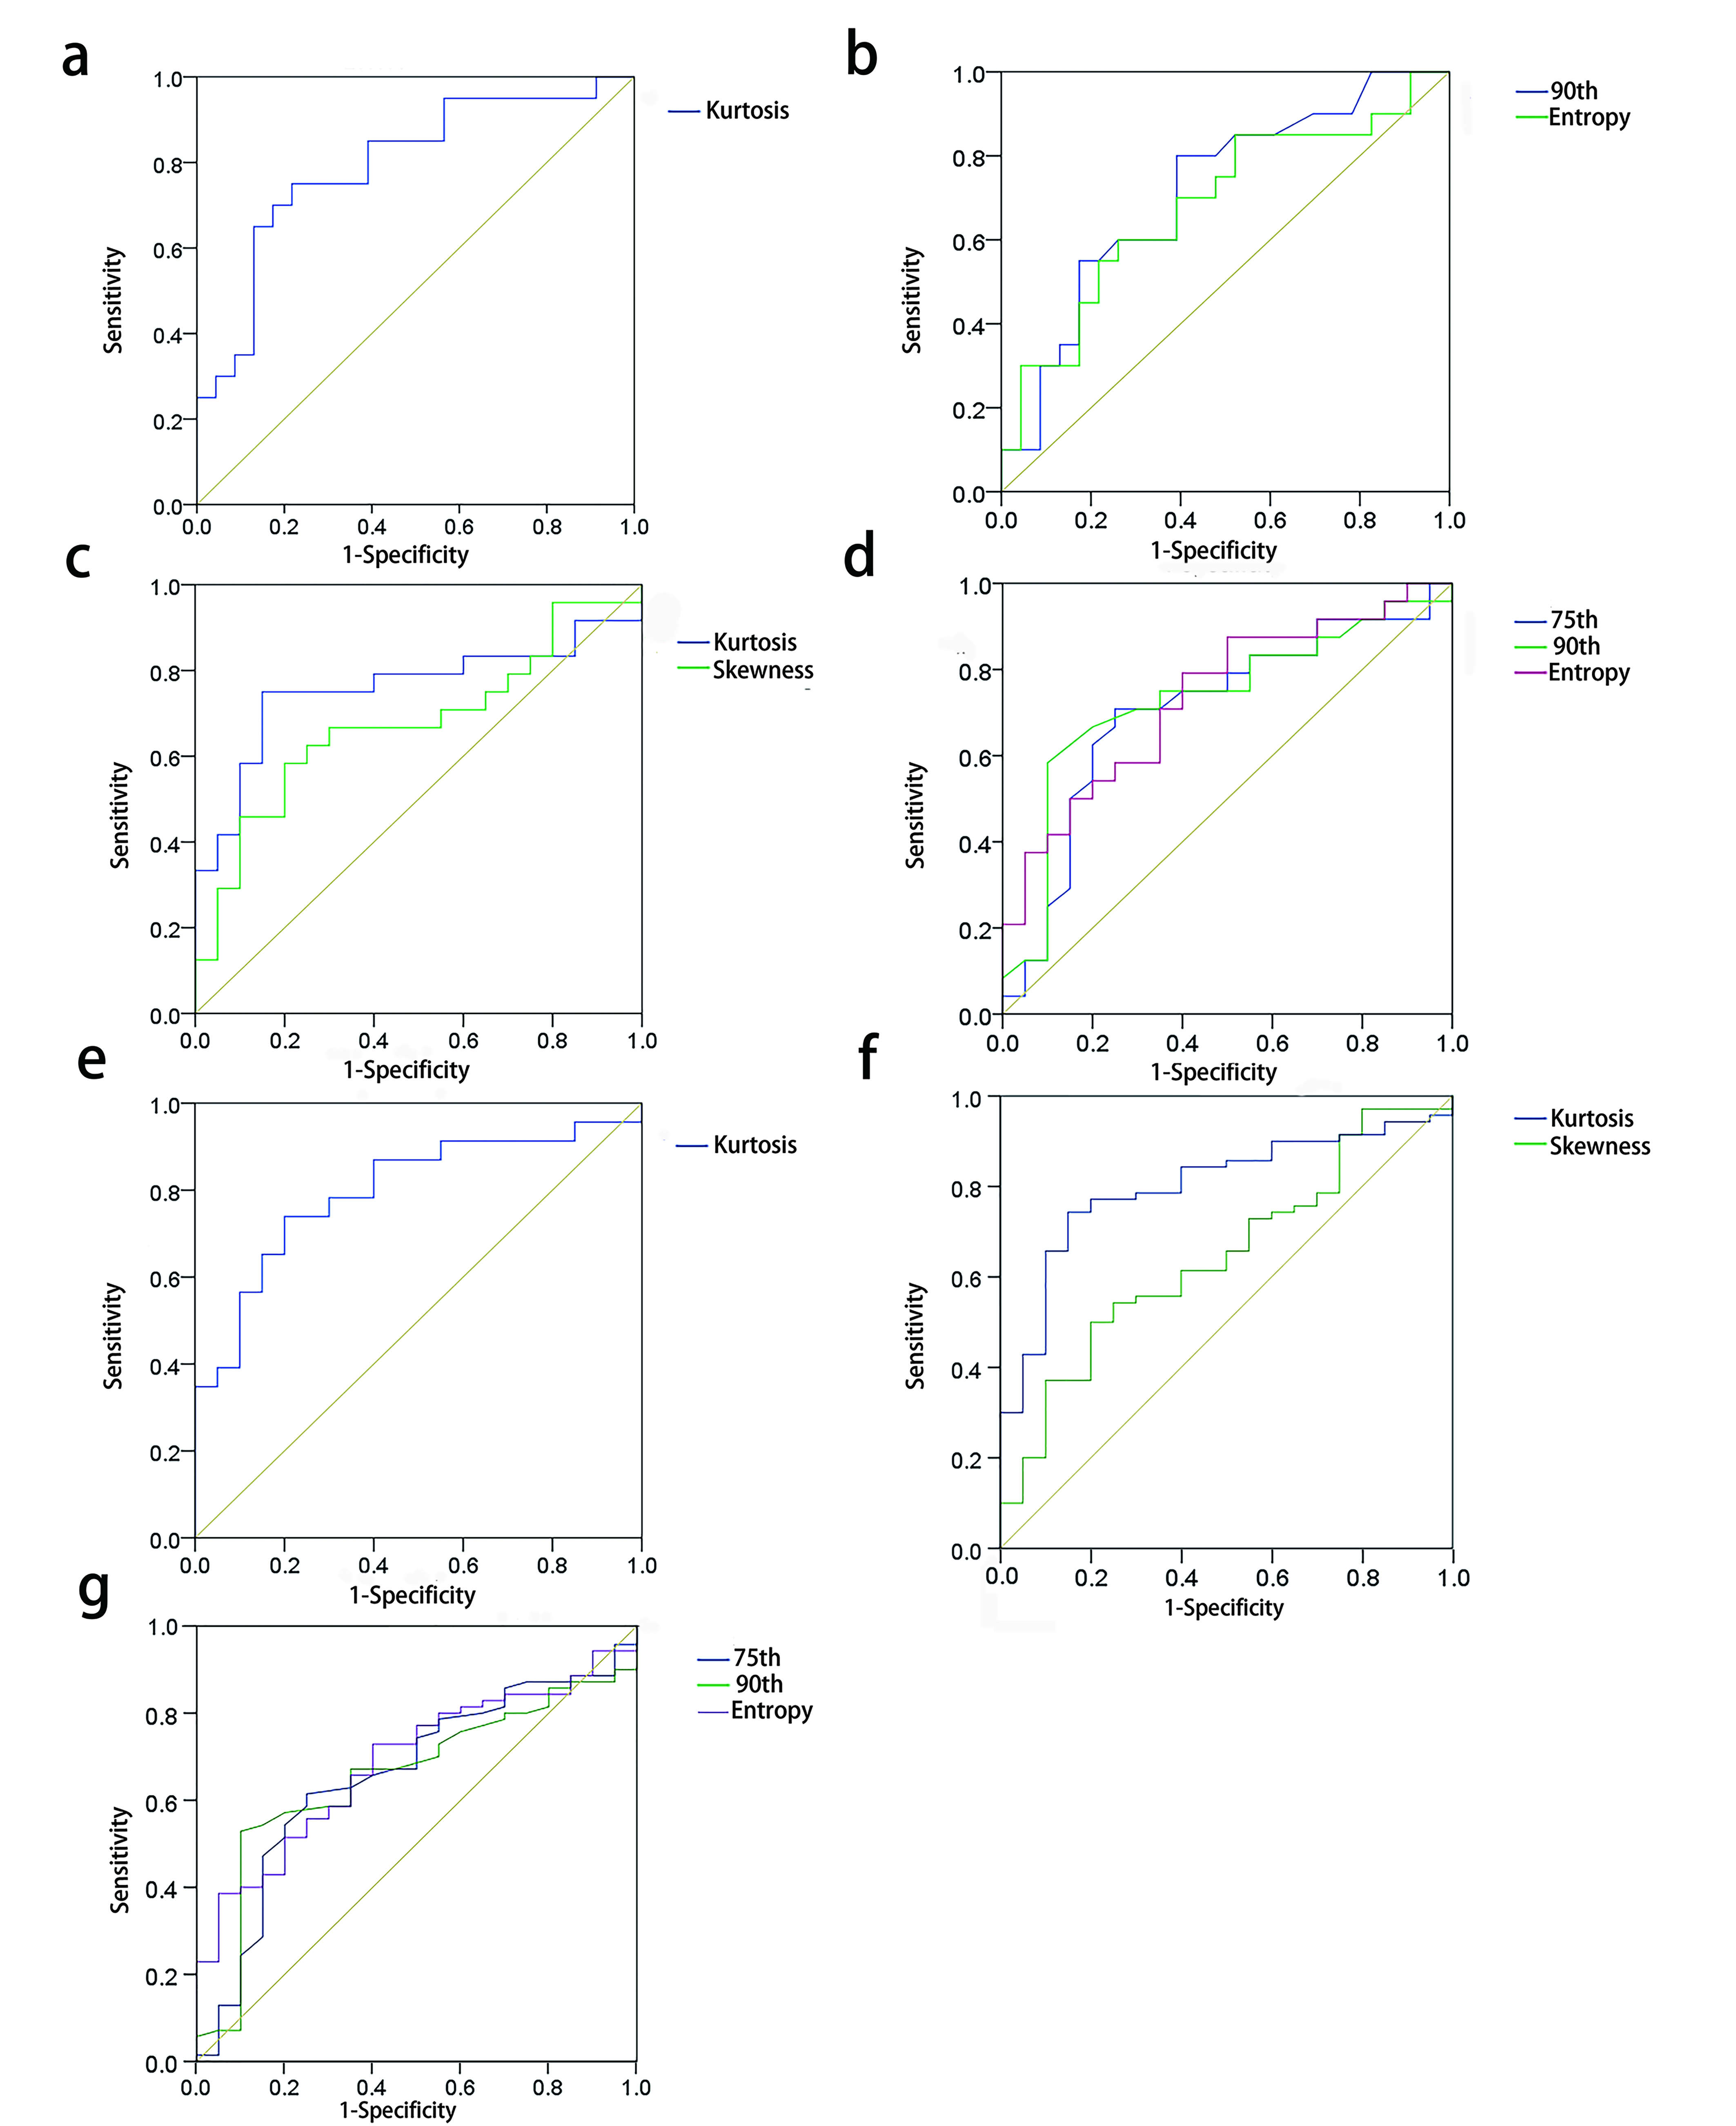
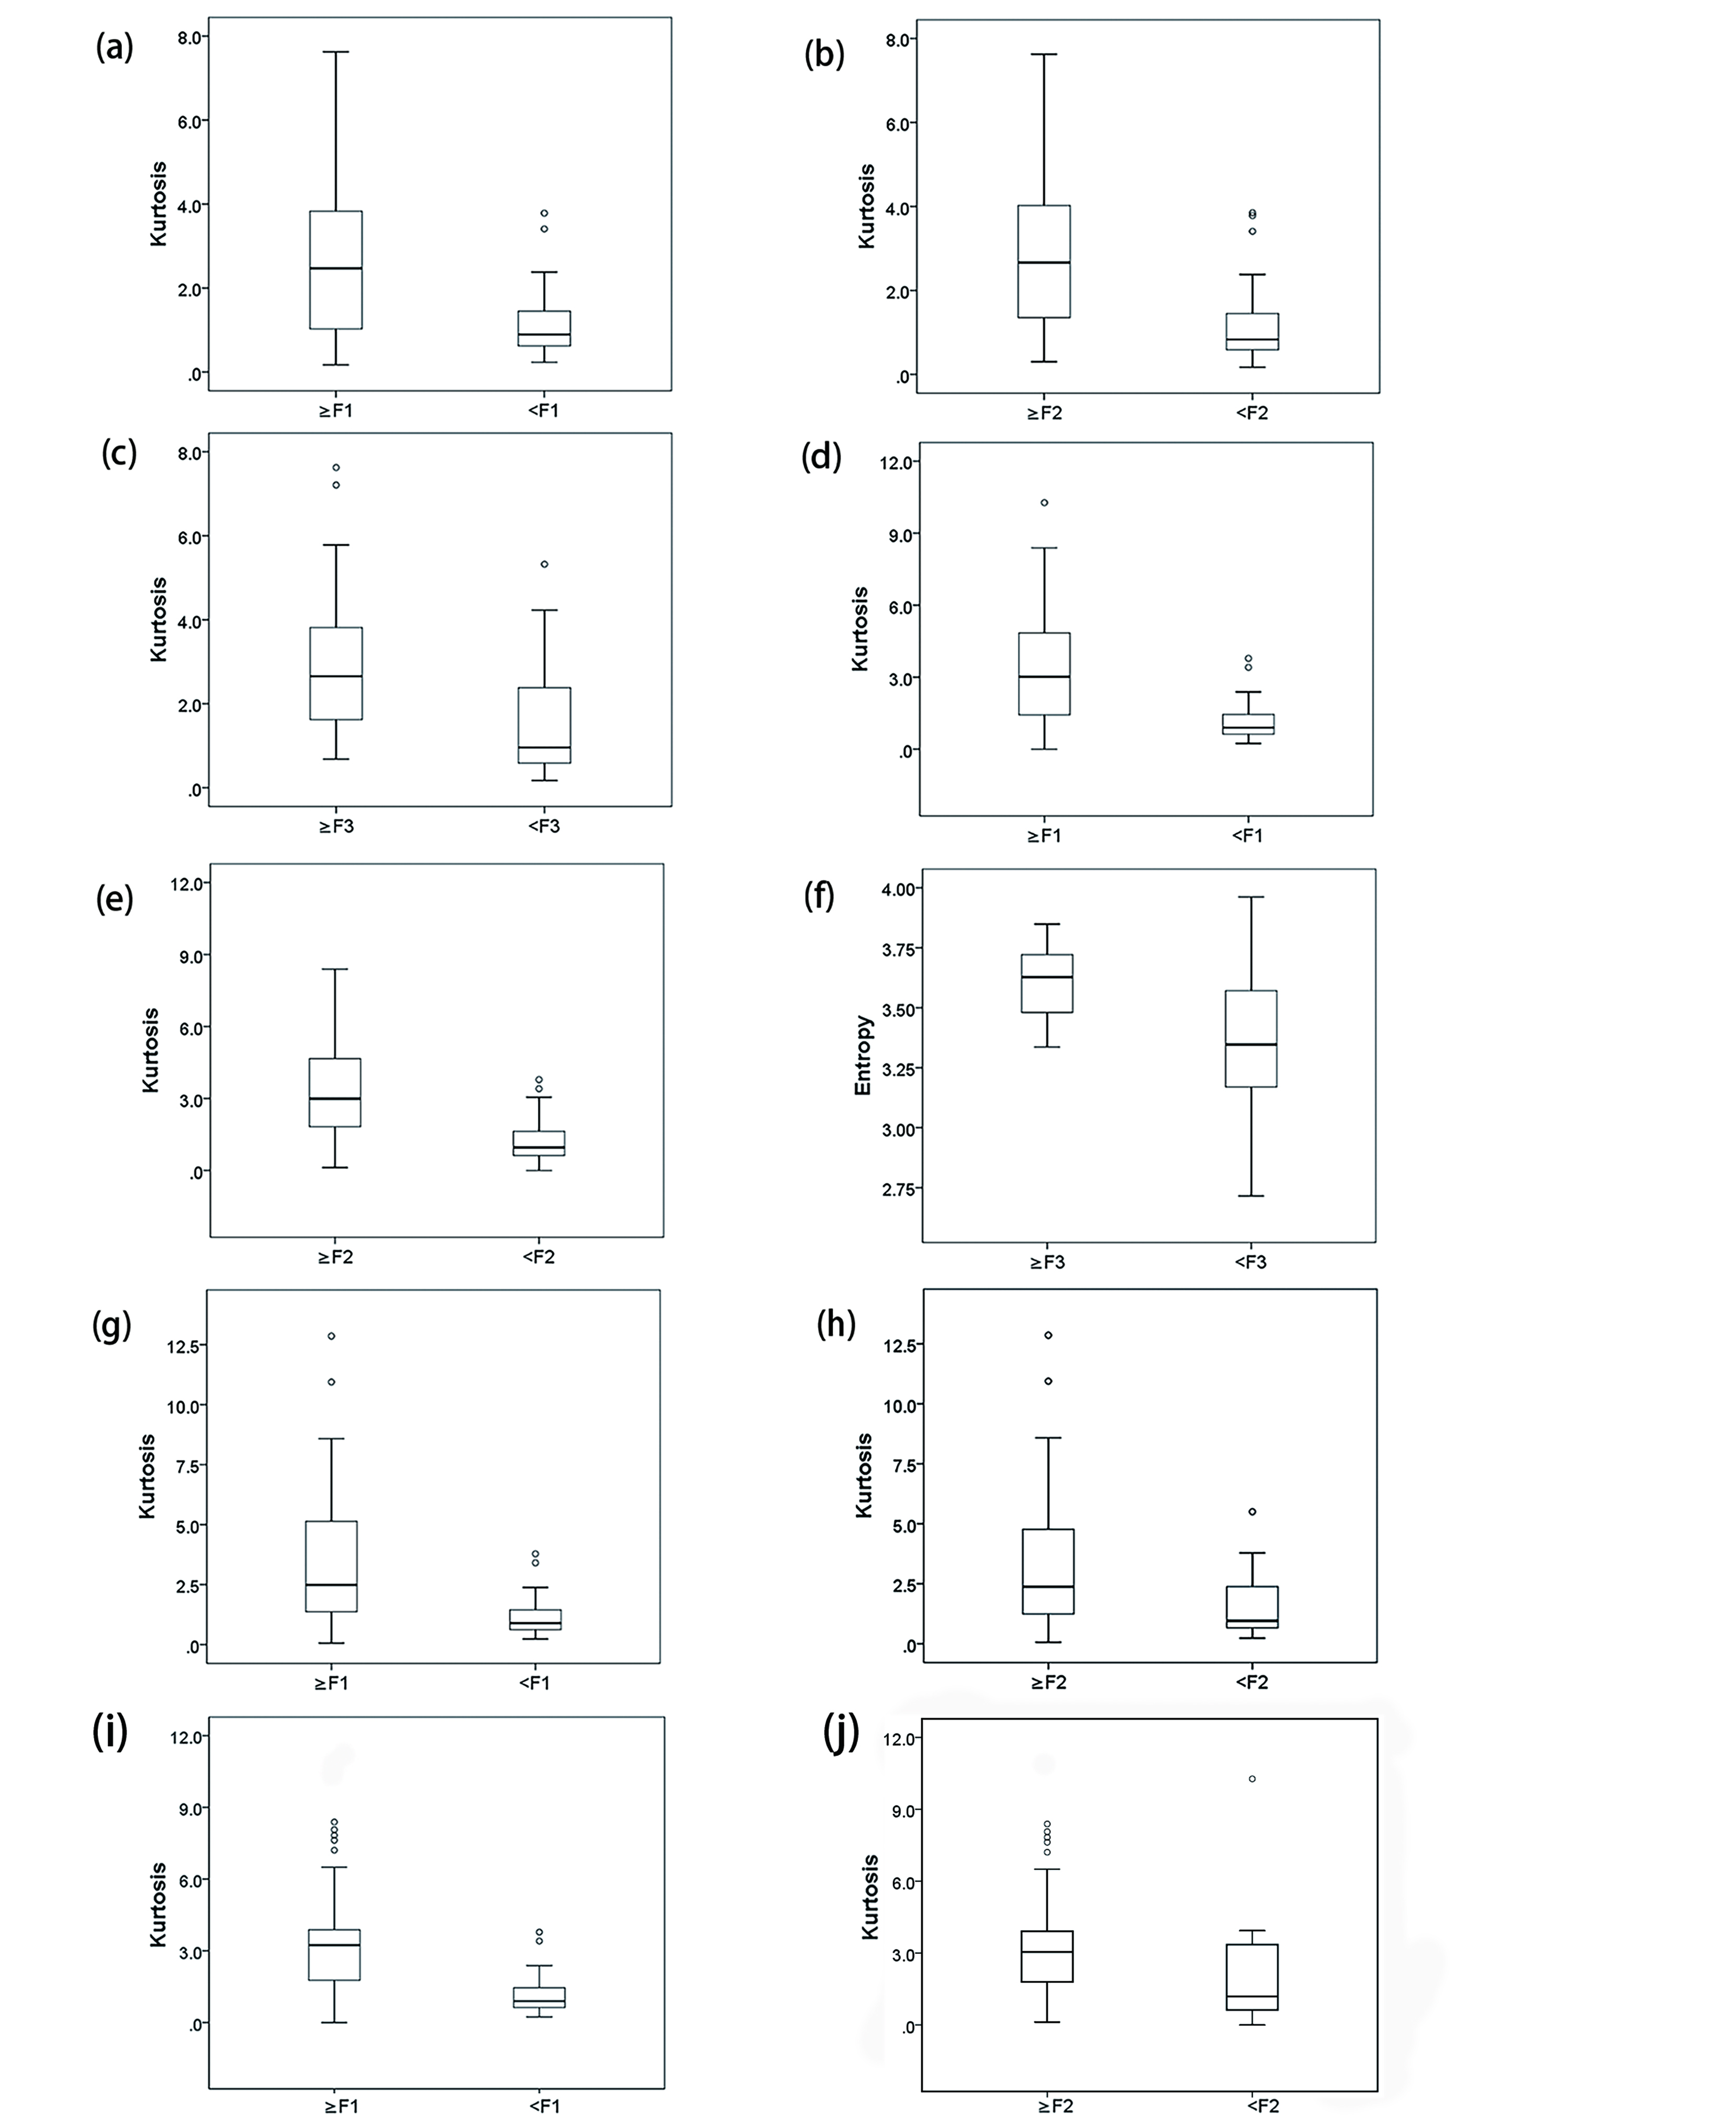
Totally 86 patients with liver fibrosis (30 with chronic viral hepatitis, 29 with autoimmune hepatitis and 27 with unexplained liver fibrosis) and 20 individuals with no liver disease were enrolled in this retrospective study. All the subjects underwent diffusion-weighted MR imaging on a 3.0T MR scanner (MAGNETOM Skyra, Siemens Healthineers, Erlangen, Germany). DWI was performed adopting diffusion‐weighted‐echo‐planar imaging. For each patient, region of interest (ROI) covering the entire liver were drawn in each slice of axial diffusion-weighted images with FireVoxel (FireVoxel, 301; https://wp.nyu.edu/firevoxel/downloads/) by two radiologists. The whole-liver ADC histogram and its parameters were obtained by accumulating all ROIs in each slice. The differences of ADC histogram parameters between different histological liver fibrosis stages were compared using the Mann–Whitney U test. And ROC curve was constructed to evaluate the effectiveness of histogram parameters in differentiating stage 1 or greater (≥F1), stage 2 or greater (≥F2), and stage 3 or greater (≥F3) liver fibrosis.Results
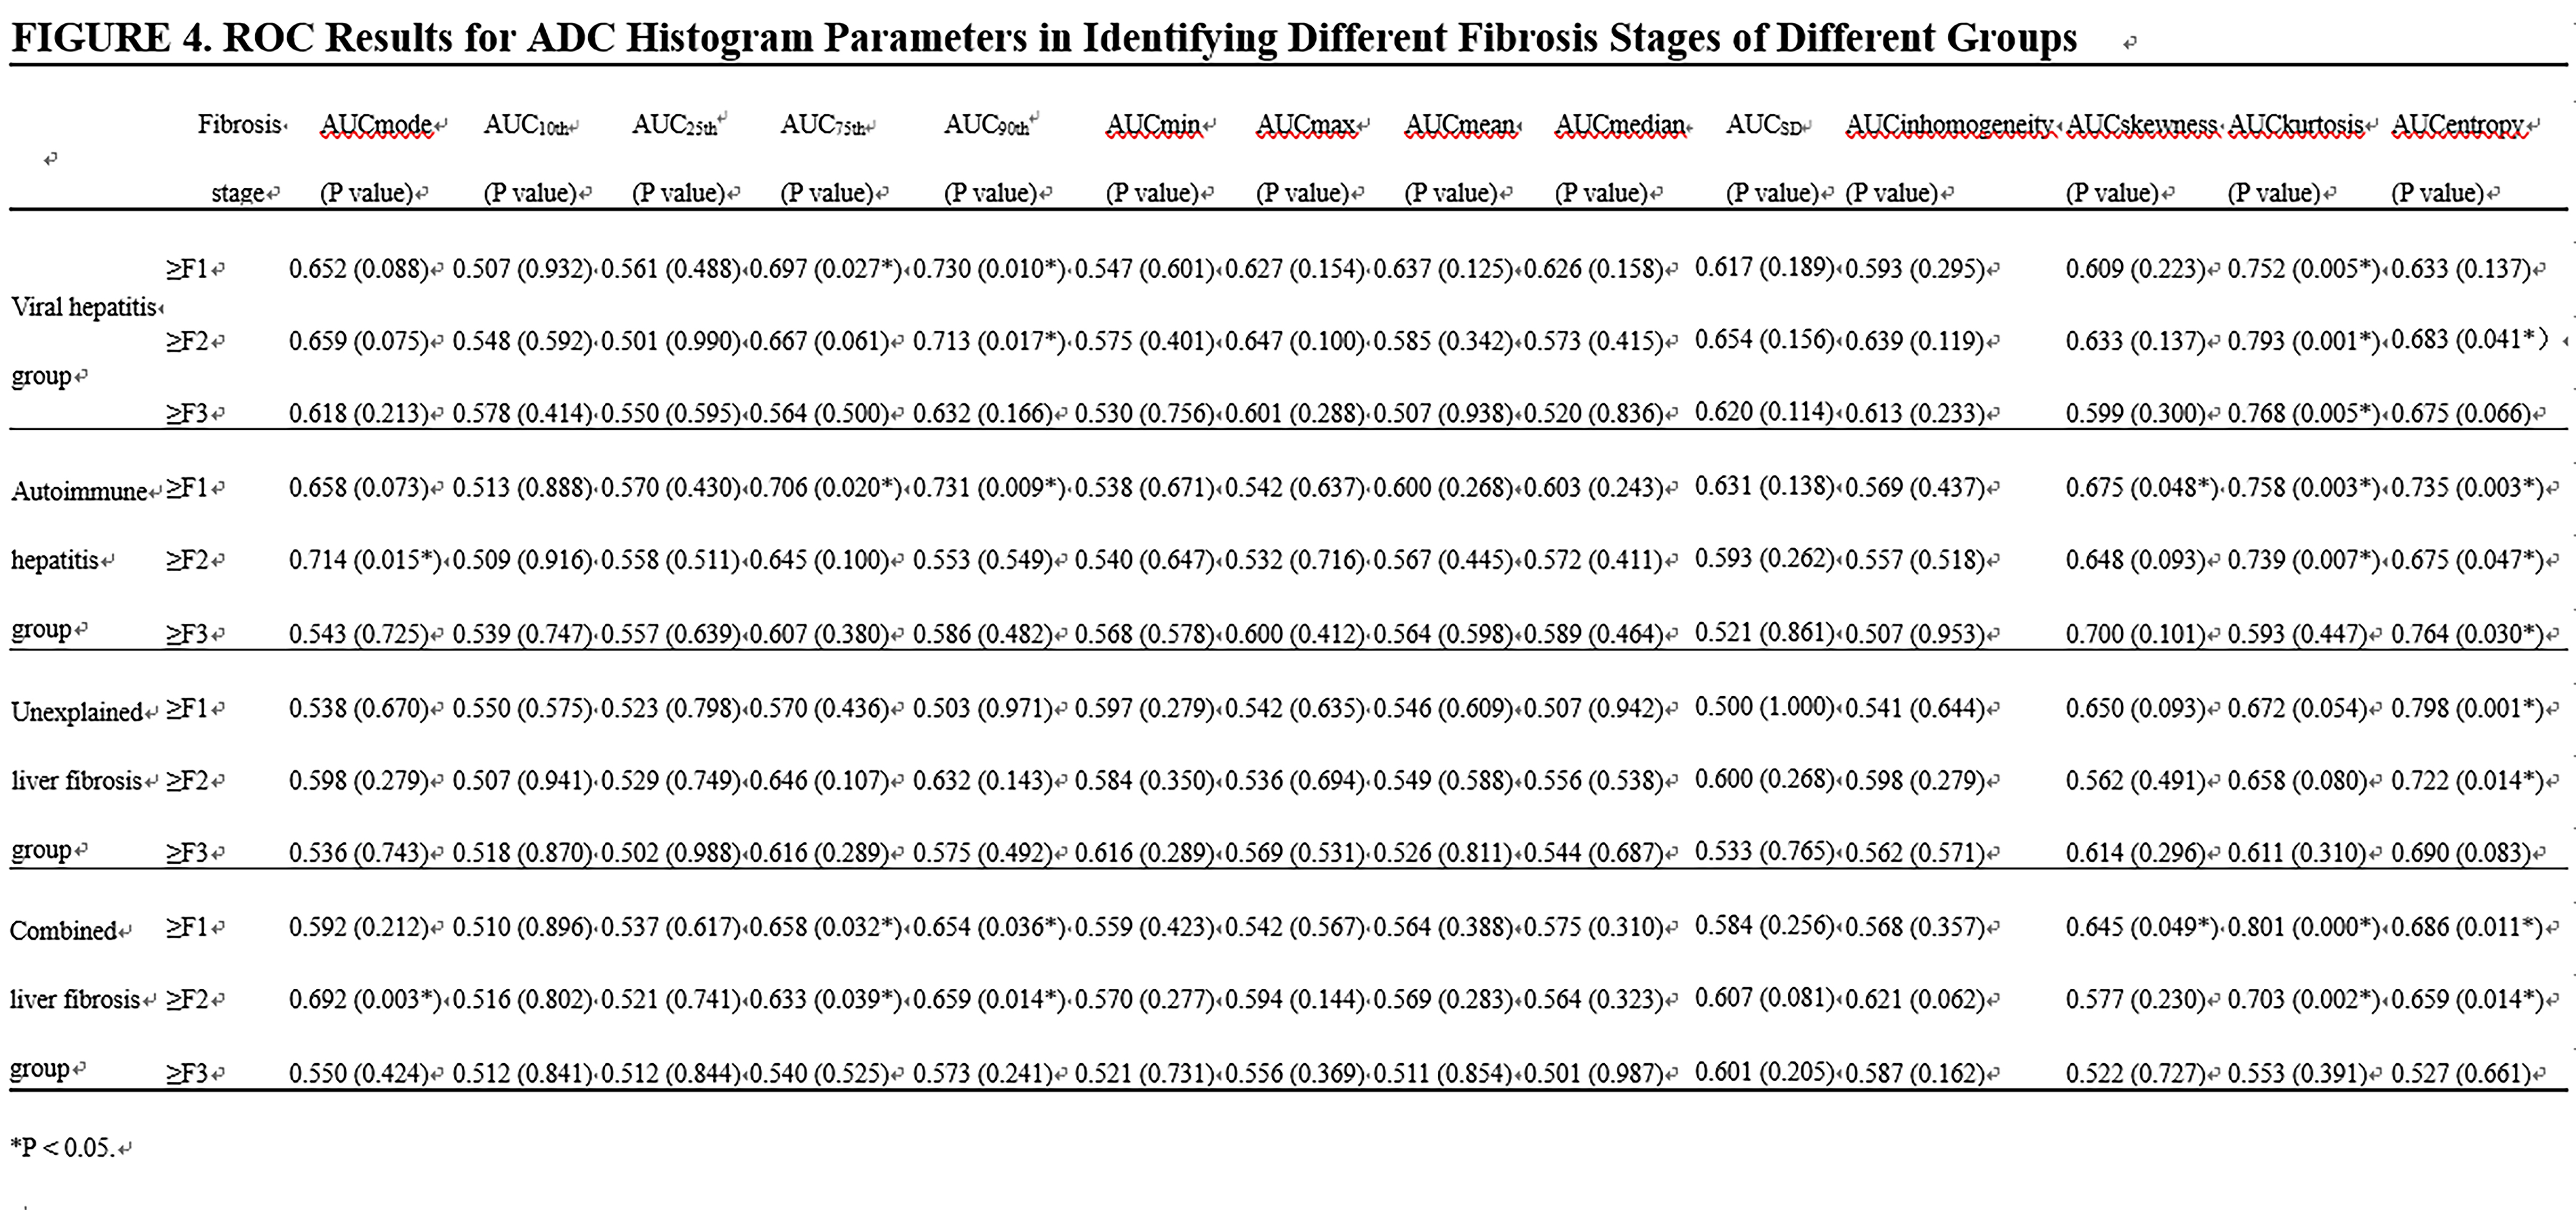
Kurtosis, entropy, skewness, mode, and 90th and 75th percentiles exhibited significant differences among the pathological fibrosis stages (P<0.05). Kurtosis was found to be the most meaningful parameter in differentiating fibrosis stages of the viral hepatitis, autoimmune hepatitis and unexplained liver fibrosis group (area under the curve) (AUC= 0.793, 0.771, 0.798, respectively). In the combined liver fibrosis group, kurtosis achieved the highest AUC (0.801; 95% CI: 0.702-0.900; sensitivity: 0.750; specificity: 0.850; positive likelihood ratio: 4.953; negative likelihood ratio: 0.302; positive predictive value: 0.946; negative predictive value: 0.486), with a cut-off value of 1.817, in differentiating fibrosis stage ≥F1.Conclusion
Histogram parameters of ADC ( kurtosis, entropy, skewness, mode, and 90th and 75th percentiles) may contribute to the diagnosis and staging of liver fibrosis, especially kurtosis.Acknowledgements
You Zheng, Yong-Sheng Xu, Zhao Liu, Hai-Feng Liu, Ya-Nan Zhai, Xiao-Rong Mao, Jun-Qiang Lei.References
1. Roeb E. Matrix metalloproteinases and liver fibrosis (translational aspects). Matrix biology : journal of the International Society for Matrix Biology. 2018;68-69:463-473.
2. Schuppan D, Afdhal NH. Liver cirrhosis. Lancet (London, England). 2008;371(9615):838-851.
3. Tacke F, Zimmermann HW. Macrophage heterogeneity in liver injury and fibrosis. Journal of hepatology. 2014;60(5):1090-1096.
4. Atta HM. Reversibility and heritability of liver fibrosis: Implications for research and therapy. World journal of gastroenterology. 2015;21(17):5138-5148.
5. Lee YA, Wallace MC, Friedman SL. Pathobiology of liver fibrosis: a translational success story. Gut. 2015;64(5):830-841.
6. Bedossa P, Poynard T. An algorithm for the grading of activity in chronic hepatitis C. The METAVIR Cooperative Study Group. Hepatology (Baltimore, Md). 1996;24(2):289-293.
7. Standish RA, Cholongitas E, Dhillon A, Burroughs AK, Dhillon AP. An appraisal of the histopathological assessment of liver fibrosis. Gut. 2006;55(4):569-578.
8. Laun FB, Fritzsche KH, Kuder TA, Stieltjes B. [Introduction to the basic principles and techniques of diffusion-weighted imaging]. Der Radiologe. 2011;51(3):170-179.
9. Hu G, Zhang X, Liang W, Zhong X, Chan Q, Lin X, et al. Assessment of liver fibrosis in rats by MRI with apparent diffusion coefficient and T1 relaxation time in the rotating frame. Journal of magnetic resonance imaging : JMRI. 2016;43(5):1082-1089.
10. Hennedige TP, Wang G, Leung FP, Alsaif HS, Teo LL, Lim SG, et al. Magnetic Resonance Elastography and Diffusion Weighted Imaging in the Evaluation of Hepatic Fibrosis in Chronic Hepatitis B. Gut and liver. 2017;11(3):401-408.
11. Feier D, Balassy C, Bastati N, Fragner R, Wrba F, Ba-Ssalamah A. The diagnostic efficacy of quantitative liver MR imaging with diffusion-weighted, SWI, and hepato-specific contrast-enhanced sequences in staging liver fibrosis--a multiparametric approach. European radiology. 2016;26(2):539-546. 12. Chu C, Feng Q, Zhang H, Zhu Y, Chen W, He J, et al. Whole-Volume ADC Histogram Analysis in Parotid Glands to Identify Patients with Sjogren's Syndrome. Scientific reports. 2019;9(1):9614.
13. Yang L, Liu D, Fang X, Wang Z, Xing Y, Ma L, et al. Rectal cancer: can T2WI histogram of the primary tumor help predict the existence of lymph node metastasis? European radiology. 2019.
14. Le Bihan D. Molecular diffusion, tissue microdynamics and microstructure. NMR in biomedicine. 1995;8(7-8):375-386.
15. Mehal WZ, Schuppan D. Antifibrotic therapies in the liver. Seminars in liver disease. 2015;35(2):184-198.
16. Yang ZX, Liang HY, Hu XX, Huang YQ, Ding Y, Yang S, et al. Feasibility of histogram analysis of susceptibility-weighted MRI for staging of liver fibrosis. Diagnostic and interventional radiology (Ankara, Turkey). 2016;22(4):301-307.
17. Drevelegas K, Nikiforaki K, Constantinides M, Papanikolaou N, Papalavrentios L, Stoikou I, et al. Apparent Diffusion Coefficient Quantification in Determining the Histological Diagnosis of Malignant Liver Lesions. Journal of Cancer. 2016;7(6):730-735.
18. Yu H, Touret AS, Li B, O'Brien M, Qureshi MM, Soto JA, et al. Application of texture analysis on parametric T1 and T2 maps for detection of hepatic fibrosis. Journal of magnetic resonance imaging : JMRI. 2017;45(1):250-259.
19. Jirak D, Dezortova M, Taimr P, Hajek M. Texture analysis of human liver. Journal of magnetic resonance imaging : JMRI. 2002;15(1):68-74.
20. Fujimoto K, Tonan T, Azuma S, Kage M, Nakashima O, Johkoh T, et al. Evaluation of the mean and entropy of apparent diffusion coefficient values in chronic hepatitis C: correlation with pathologic fibrosis stage and inflammatory activity grade. Radiology. 2011;258(3):739-748.
21. Barry B, Buch K, Soto JA, Jara H, Nakhmani A, Anderson SW. Quantifying liver fibrosis through the application of texture analysis to diffusion weighted imaging. Magnetic resonance imaging. 2014;32(1):84-90.
22. Hshiao MH, Chen PC, Jao JC, Huang YH, Lee CC, Chao SY, et al. Quantifying liver cirrhosis by extracting significant features from MRI T2 image. TheScientificWorldJournal. 2012;2012:343847.
23. Bruegel M,
Holzapfel K, Gaa J, Woertler K, Waldt S, Kiefer B, et al. Characterization of
focal liver lesions by ADC measurements using a respiratory triggered
diffusion-weighted single-shot echo-planar MR imaging technique. European
radiology. 2008;18(3):477-485.
Figures