2501
Evaluation of liver fibrosis and cirrhosis on the basis of T1 mapping and the impact of inflammation, age and liver volume as confounding factors1Radiology, University Hospital of Basel, Basel, Switzerland, 2University Hospital of Basel, Basel, Switzerland
Synopsis
Aim of our study was to evaluate confounding factors for the assessment of liver fibrosis. A total of 200 patients were retrospectively included (67 patients with fibrosis or cirrhosis, 40 patients with acute elevation of laboratory parameters, 93 healthy patients). T1 values were significantly lower in healthy patients without known fibrotic changes than in patients with acute liver disease or known fibrosis or cirrhosis. Therefor T1 mapping seems to be a capable predictor for the detection of liver fibrosis and cirrhosis.
Introduction
Liver fibrosis is a diffuse parenchymal disease and a result from chronic liver damage due to different reasons like viral, autoimmune, toxic, metabolic or systemic diseases and with over one million deaths in 2010 worldwide related to liver cirrhosis it is an increasing major cause of mortality (1,2). An early detection of fibrotic changes is necessary to avoid disease progression. A noninvasive method for the detection of fibrotic changes is T1 mapping which is evaluated in animal model (3) but also in clinical trials (4,5). The purpose of our current study is to evaluate the role of T1 mapping in the detection of fibrotic changes, the influence of acute liver disease and the evaluation of confounding factors such as age and liver volume.Material and methods
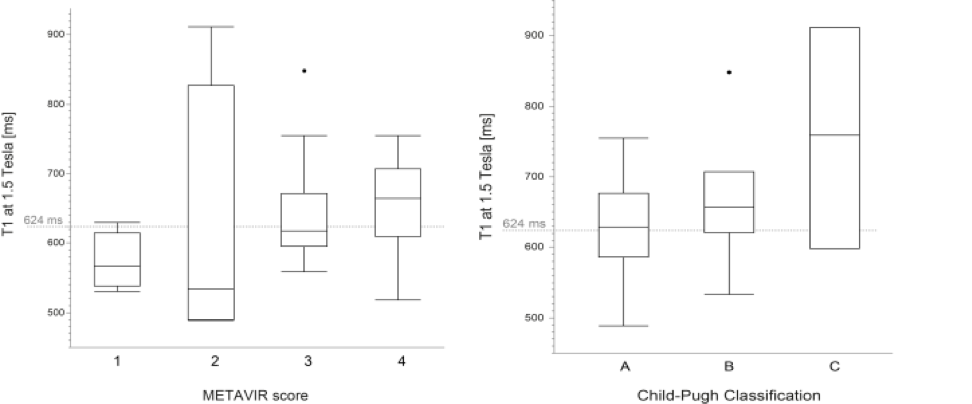
The study population is based on a RIS (radiology information system) database search for abdominal MRI perfomed from 07/2018 to 04/2019 resulting in 1336 MRIs. A total of 200 patients were retrospectively included. 93 patients were defined as healthy based on the information of the hospital information system, 40 patients showed acute elevation of liver and bile parameters and 67 subjects had a clinically or biopsy proven liver fibrosis or cirrhosis. T1 mapping was performed by using a look-locker approach. A ROI based analysis of the left and the right liver was performed. Additionally fat fraction, R2*, liver volume, laboratory parameters, sex and age were regarded as potential confounding factors. Fibrosis was staged by using the Child-Pugh score and the METAVIR score for patients with liver biopsy.Results
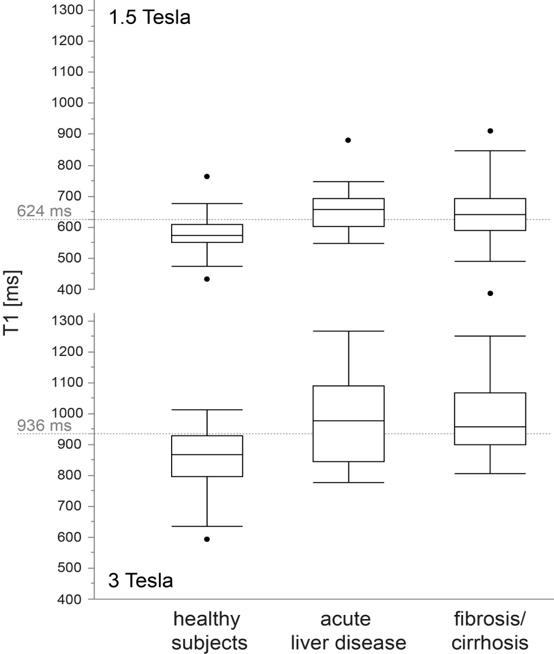
T1 values were significantly (p<0.0001) lower at 1.5T in healthy patients without known fibrotic changes (574 ms) than in patients with acute liver disease (657 ms) or known fibrosis or cirrhosis (643 ms). At 3T T1 values were significantly lower in healthy patients (857 ms) than in patients with acute liver diseases (954 ms, p=0.028) or with known fibrosis or cirrhosis (995 ms, p= 0.018). The T1 values for the best discrimination of healthy subjects and those with acute liver disease or known fibrosis or cirrhosis were 624 ms at 1.5T (60% sensitivity, 89% specificity) and 936 ms at 3T (57% sensitivity, 79% specificity. T1 values correlated moderately with the Child-Pugh stage at 1.5T (p=0.01, ρ=0.35). There was no correlation between age, fat fraction (7.7 +/- 6 %), sex or R2* and the T1 time. Liver volume was significantly (p=0.007) higher for patients with fibrosis or cirrhosis (1784 ml) than for healthy (1525 ml) patients.Discussion
Aim of our study was to evaluate and identify the role of confounding parameters especially age, acute laboratory changes of the liver and bile parameters, iron load and the fat fraction. In summary we identified T1 mapping as a potential parameter for the detection of liver fibrosis. We did not find any effects of aging on T1 values which means it allows for defining age independent threshold values for screening scenarios. No effects for T1 values were observed in dependence of sex, fat fraction and the R2* value as a parameter for iron load of the liver (6). Our study has limitations that need to be addressed. It was a retrospective study with a relatively small study population. The number of cases was too small to analyze potential influence factors like right heart failure, hepatic venous congestion and fasting state as known confounder for MRI elastography (7,8).Conclusion
T1 mapping is a capable predictor for the detection of liver fibrosis and cirrhosis. Age is no confounding factor hence age independent thresholds can be defined. Acute liver diseases are confounding factors and show similar elevation of T1 values compared with T1 values in patients with liver fibrosis or cirrhosis.Acknowledgements
References
1. Bataller, Ramón, and David A Brenner. 2005. 'Liver fibrosis', The Journal of clinical investigation, 115: 209-18.
2. Mokdad, Ali A, Alan D Lopez, Saied Shahraz, Rafael Lozano, Ali H Mokdad, Jeff Stanaway, Christopher JL Murray, and Mohsen Naghavi. 2014. 'Liver cirrhosis mortality in 187 countries between 1980 and 2010: a systematic analysis', BMC medicine, 12: 145.
3. Luetkens, Julian A, Sabine Klein, Frank Träber, Frederic C Schmeel, Alois M Sprinkart, Daniel LR Kuetting, Wolfgang Block, Frank E Uschner, Robert Schierwagen, and Kanishka Hittatiya. 2018. 'Quantification of liver fibrosis at T1 and T2 mapping with extracellular volume fraction MRI: preclinical results', Radiology, 288: 748-54.
4. Cassinotto, Christophe, Matthieu Feldis, Julien Vergniol, Amaury Mouries, Hubert Cochet, Bruno Lapuyade, Arnaud Hocquelet, Etienne Juanola, Juliette Foucher, and François Laurent. 2015. 'MR relaxometry in chronic liver diseases: Comparison of T1 mapping, T2 mapping, and diffusion-weighted imaging for assessing cirrhosis diagnosis and severity', European journal of radiology, 84: 1459-65.
5. Heye, Tobias, Schu-Ren Yang, Michael Bock, Sylvia Brost, Kilian Weigand, Thomas Longerich, Hans-Ulrich Kauczor, and Waldemar Hosch. 2012. 'MR relaxometry of the liver: significant elevation of T1 relaxation time in patients with liver cirrhosis', European radiology, 22: 1224-32.
6. ST. PIERRE, TIMOTHY G, PAUL R CLARK, and WANIDA Chua‐Anusorn. 2005. 'Measurement and mapping of liver iron concentrations using magnetic resonance imaging', Annals of the New York Academy of Sciences, 1054: 379-85.
7. Millonig, Gunda, Stefanie Friedrich, Stefanie Adolf, Hamidreza Fonouni, Mohammad Golriz, Arianeb Mehrabi, Peter Stiefel, Gudrun Pöschl, Markus W Büchler, and Helmut Karl Seitz. 2010. 'Liver stiffness is directly influenced by central venous pressure', Journal of hepatology, 52: 206-10.
8. Wang, H-K, Y-C Lai, H-S Tseng, R-C Lee, C-C Loong, N-C Lin, Y-H Chou, H-J Chiou, and C-Y Chang. 2012. "Hepatic venous congestion after living donor liver transplantation: quantitative assessment of liver stiffness using shear wave elastography—a case report." In Transplantation proceedings, 814-16. Elsevier.
Figures