2500
Staging liver fibrosis on multi-parametric MRI in a rabbit model: elastography, susceptibility-weighted imaging and T1ρ imaging
Hai-Feng Liu1, Li-Qiu Zou2, Qing Wang1, Yu-Feng Li1, Ya-Nan Du1, and Wei Xing1
1Third Affiliated Hospital of Soochow University, changzhou, China, 2Sixth Affiliated Hospital of Shenzhen University, shenzhen, China
1Third Affiliated Hospital of Soochow University, changzhou, China, 2Sixth Affiliated Hospital of Shenzhen University, shenzhen, China
Synopsis
In this prospective experimental study, we evaluated the independent value and diagnostic efficacy of multi-parametric MRI using quantitative measurements of the liver stiffness (LS) on MRE, liver-to-muscle signal intensity ratio (SIR) on SWI, and T1ρ value for staging LF in a rabbit model.
Background and Purpose
Liver fibrosis (LF) can deteriorate into more severe stages, known as liver cirrhosis, the progression of early LF can be reversed by treatment with specific antifibrotic therapy or elimination of the causes 1,2, whereas liver cirrhosis is irreversible. With the rapid advancements of MRI technology, magnetic resonance elastography (MRE), susceptibility weighted imaging (SWI) and T1 relaxation time in the rotating frame (T1ρ) are three noninvasive techniques for LF staging 3,4. Recently, multi-parametric and quantitative MR imaging has been proven to be superior to individual MR techniques and parameters in LF staging 5. Therefore, the purpose of this study was to assess the independent value of MRE, SWI and T1ρ imaging for staging LF in a CCl4-induced rabbit model, using the histopathological results as the reference standard. Furthermore, we evaluated the diagnostic efficacy of multi-parametric MRI using quantitative measurements of the liver stiffness (LS) on MRE, liver-to-muscle signal intensity ratio (SIR) on SWI, and T1ρ value on T1ρ imaging for staging LF in the same rabbit model.Materials and Methods
Rabbits in LF group (n=60) induced by CCl4 and control group (n =20) were used in our experiments. On 4th, 5th, 6th, and 15th weekend after the injection of CCl4, 12 rabbits in LF group and 5 rabbits in control group underwent MRI examination including the following sequences: 1) axial T1-weighted turbo-spin-echo; 2) axial MRE; 3) axial SWI; 4) axial T1ρ imaging. With the reference to T1WI image, five ROIs on each of the three consecutive slice were manually drawn. The mean values of all ROIs were considered to be as the liver stiffness (LS), signal intensity ratio liver-to-muscle (SIR liver/muscle) and T1ρ values of rabbit liver, respectively. According to the Scheuer Classification, LF stage were classified as follows: F0, F1, F2, F3, F4. One-way analysis of variance (ANOVA) followed by LSD post-hoc tests were used to assess the differences of the parameters of LF, SIR and T1ρ values among different LF stages. Spearman correlation coeffcients were calculated to evaluate the correlation between quantitative parameters (LF, SIR, T1ρ values) and LF stages. Receiver operating characteristic (ROC) curve was used to evaluate the MRE, SWI and T1ρ imaging in differentiating F0 from ≥ F1 (F1-F4), F0-F1 from ≥ F2 (F2-F4), F0-F2 from ≥ F3 (F3-F4), and F0-F3 from ≥ F4 (F4).Results
Ultimately, 44 LF and 14 normal rabbits were included. The histopathological results revealed that there were 14 rabbits in stage F0, 11 rabbits in stage F1, 10 rabbits in stage F2, 9 rabbits in stage F3, and 11 rabbits in stage F4, and the results are shown in Fig.1. Typical MRE, SWI and T1ρ maps of rabbit livers with different LF stages were shown in Fig. 2F-J, Fig. 2K-O, and Fig. 2P-T, respectively. Spearman’s rank correlation test results demonstrated strong and moderate positive correlations between the LF stage and LS (r= 0.91, P < 0.001) and T1ρ values (r = 0.51, P < 0.001), whereas strong negative correlation was identified between the SIR values and LF stage (r = -0.81, P < 0.001), which shown in Fig.3. The ANOVA test results confirmed that the LS, SIR and T1ρ values were all significantly different among the various LF stages (F = 24.50, 61.48 and 8.55, respectively, with all P values < 0.05) and are presented in Fig. 1. All LF stage comparison pairs for the LS values, with the exception of two groups (F0 vs. F1 and F1 vs. F2), differed significantly from one another (P < 0.05). There were significant differences in the SIR values between F0-F2 and F4 (F0 vs. F4, F1 vs. F4, and F2 vs. F4), between F0-F1 vs. F3 (F0 vs. F3 and F1 vs. F3), between F0 and F2, and between F2 and F4, while no differences were found in the SIR values among other paired groups. The T1ρ values for F1 differed from that of stage F2, F3 and F4 stages (all P values < 0.05 vs. F1), but there were no significant differences in any other LF stage (P > 0.05).The diagnostic performance including the AUC, cut-off value, sensitivity and specificity of the three independent parameters (LS, SIR and T1ρ), paired parameters (LS + SIR, LS + T1ρ and T1ρ + SIR) and multivariate regression model of three parameters in identifying LF stage ≥ F1, ≥ F2, ≥ F3 and ≥ F4 were shown in Fig. 4-5. Among the three parameters, the LS values revealed the best diagnostic efficacy in staging LF, with an AUC value of 0.95 for ≥ F1, 0.95 for ≥ F2, 0.99 for ≥ F3, and 0.98 for ≥ F4. The AUCs of the combination of LS and SIR could best predict LF stages ≥ F1, ≥ F2, ≥ F3 and ≥ F4, with AUC values of 0.97, 0.98, 0.99 and 0.99, respectively, which were greater than those of the other two paired parameters. A multi-parametric analysis showed that the combination of all three parameters had AUC values of 0.97, 0.98, 1.00 and 1.00 for staging ≥ F1, ≥F2, ≥F3 and ≥ F4, respectively.Acknowledgements
This work was supported by the National Natural Science Foundation of China (81771798/81771805)References
1. Hernandez GV, Friedman SL. Pathogenesis of liver fibrosis. Ann Rev of Pathol, 2011, 6:425-456.2. Altamirano-Barrera A, Barranco-Fragoso B, Mendez-Sanchez N. Management strategies for liver fibrosis. Ann Hepatol, 2017, 16(1):48-56.3. Kim YS, Jang YN, Song JS. Comparison of gradient-recalled echo and spin-echo echo-planar imaging MR elastography in staging liver fibrosis: a meta-analysis. Eur Radiol, 2018, 28(4):1709-1718.4. Petitclerc L, Sebastiani G, Gilbert G, et al. Liver fibrosis: Review of current imaging and MRI quantification techniques[J]. J Magn Reson Imaging, 2017, 45(5):1276-1295.5. Feier D, Balassy C, Bastati N, et al. The diagnostic efficacy of quantitative liver MR imaging with diffusion-weighted, SWI, and hepato-specific contrast-enhanced sequences in staging liver fibrosis--a multiparametric approach. Eur Radiol, 2016, 26(2):539-546.Figures
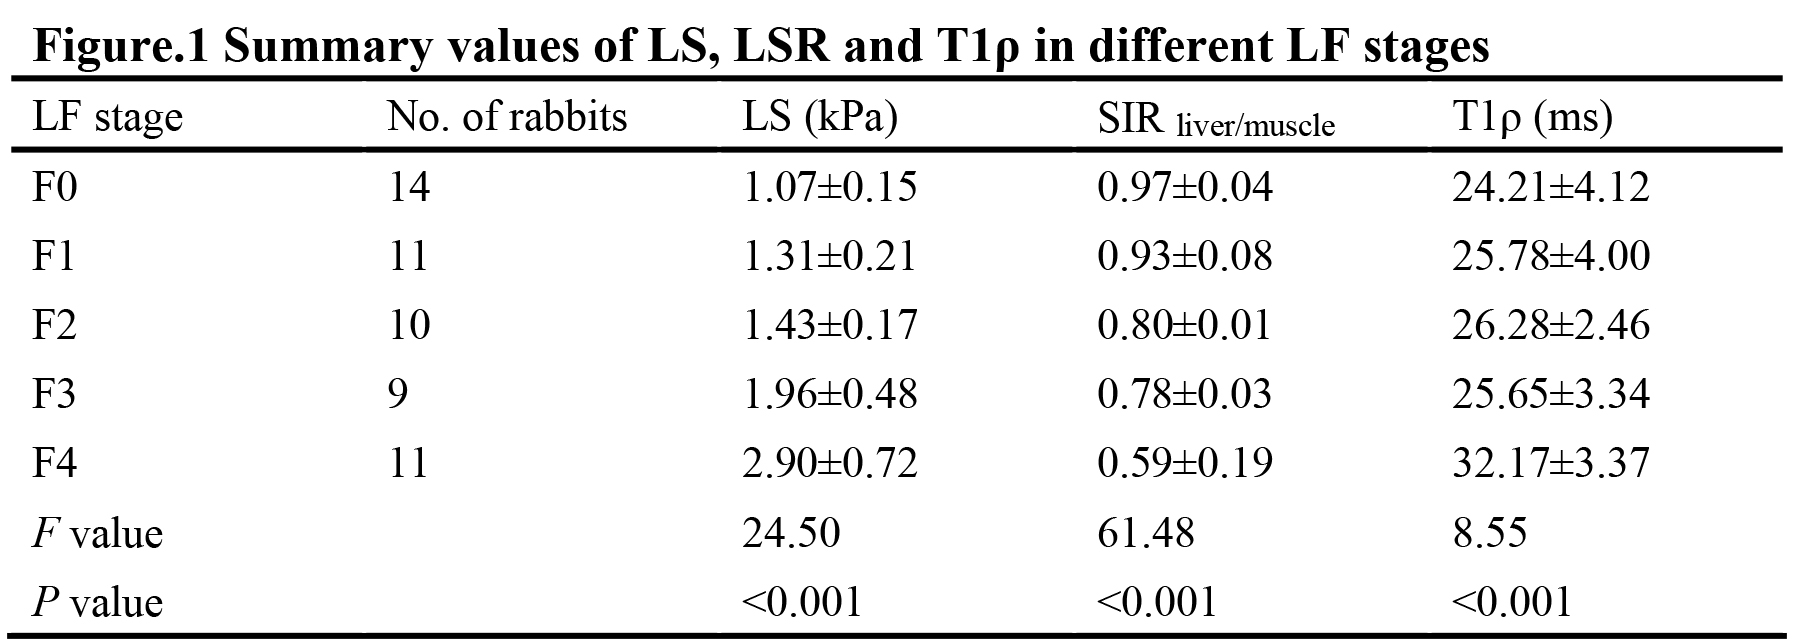
Summary values of LS, LSR and T1ρ in different LF stages
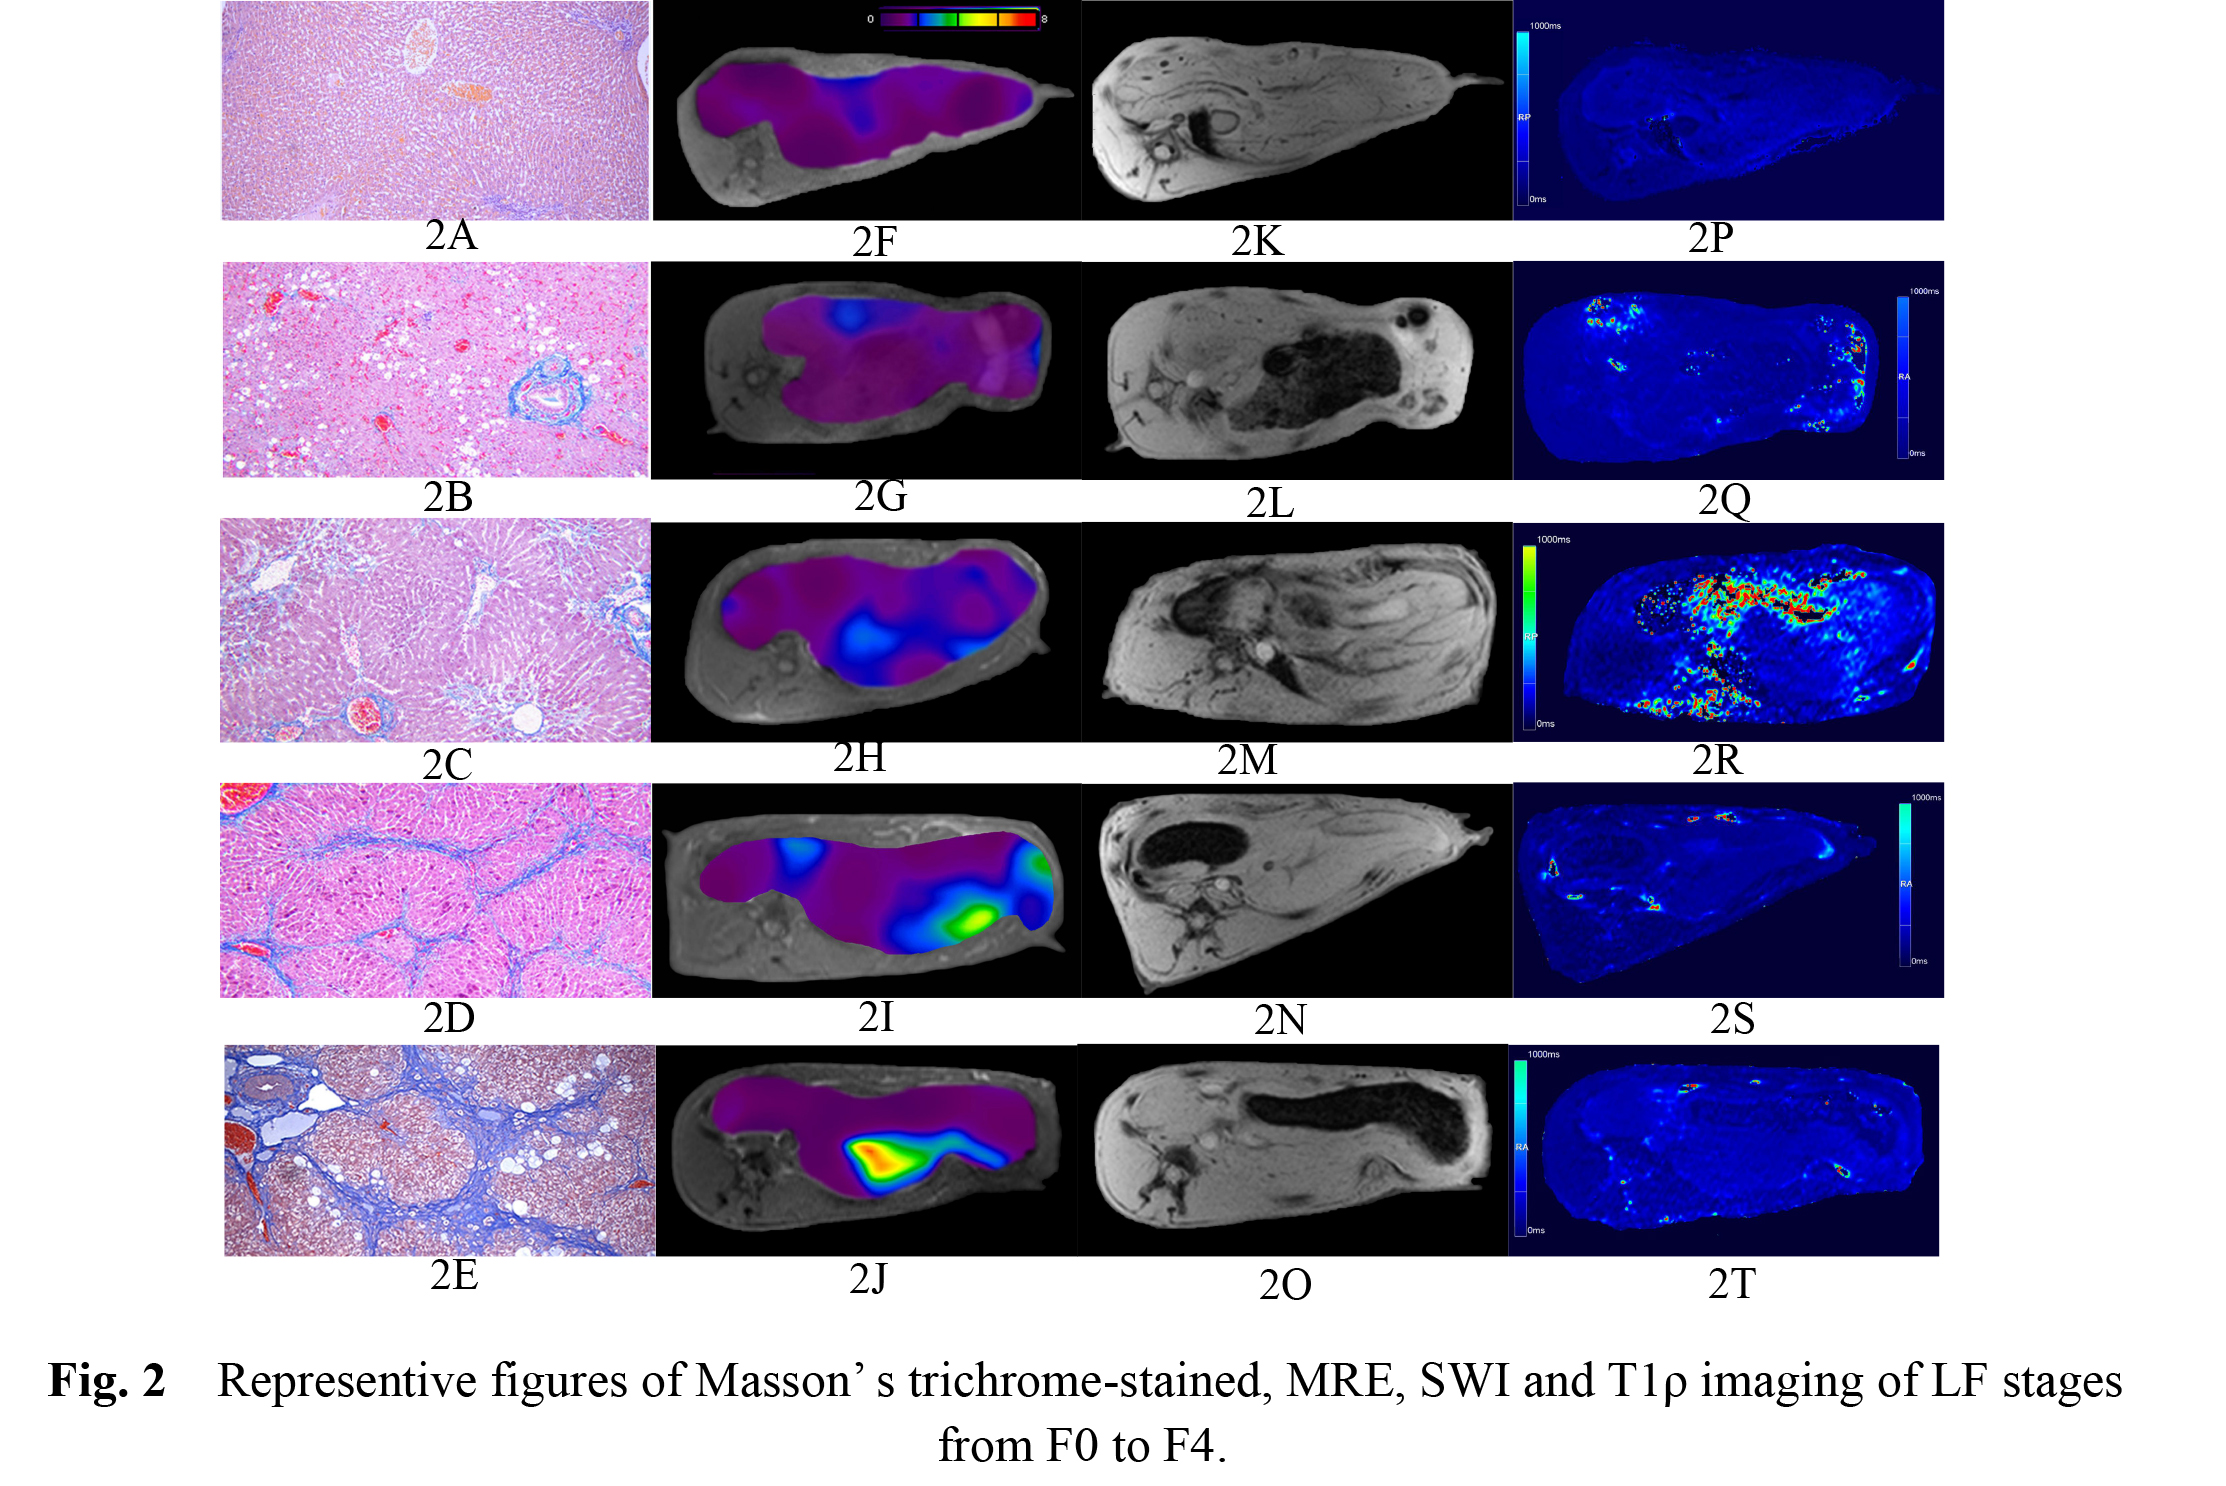
Fig.2 Representive figures of Masson’ s trichrome-stained, MRE, SWI and T1ρ imaging of LF stages from F0 to F4. Fig. A - E: LF stages F0 - F4 (Masson’s trichrome slices, F x 100), (A) F0, (B) stage F1 , (C) stage F2, (D) stage F3 , and (E) stage F4. Fig. F-J: MRE maps from F0 to F4, the liver color changes from purple to red along with the progression of LF stage. Mean SIR value decreased with the progression of LF stage. Fig. P - T: T1ρ maps of rabbit liver from stage F0 to F4. (P) F0 stage,
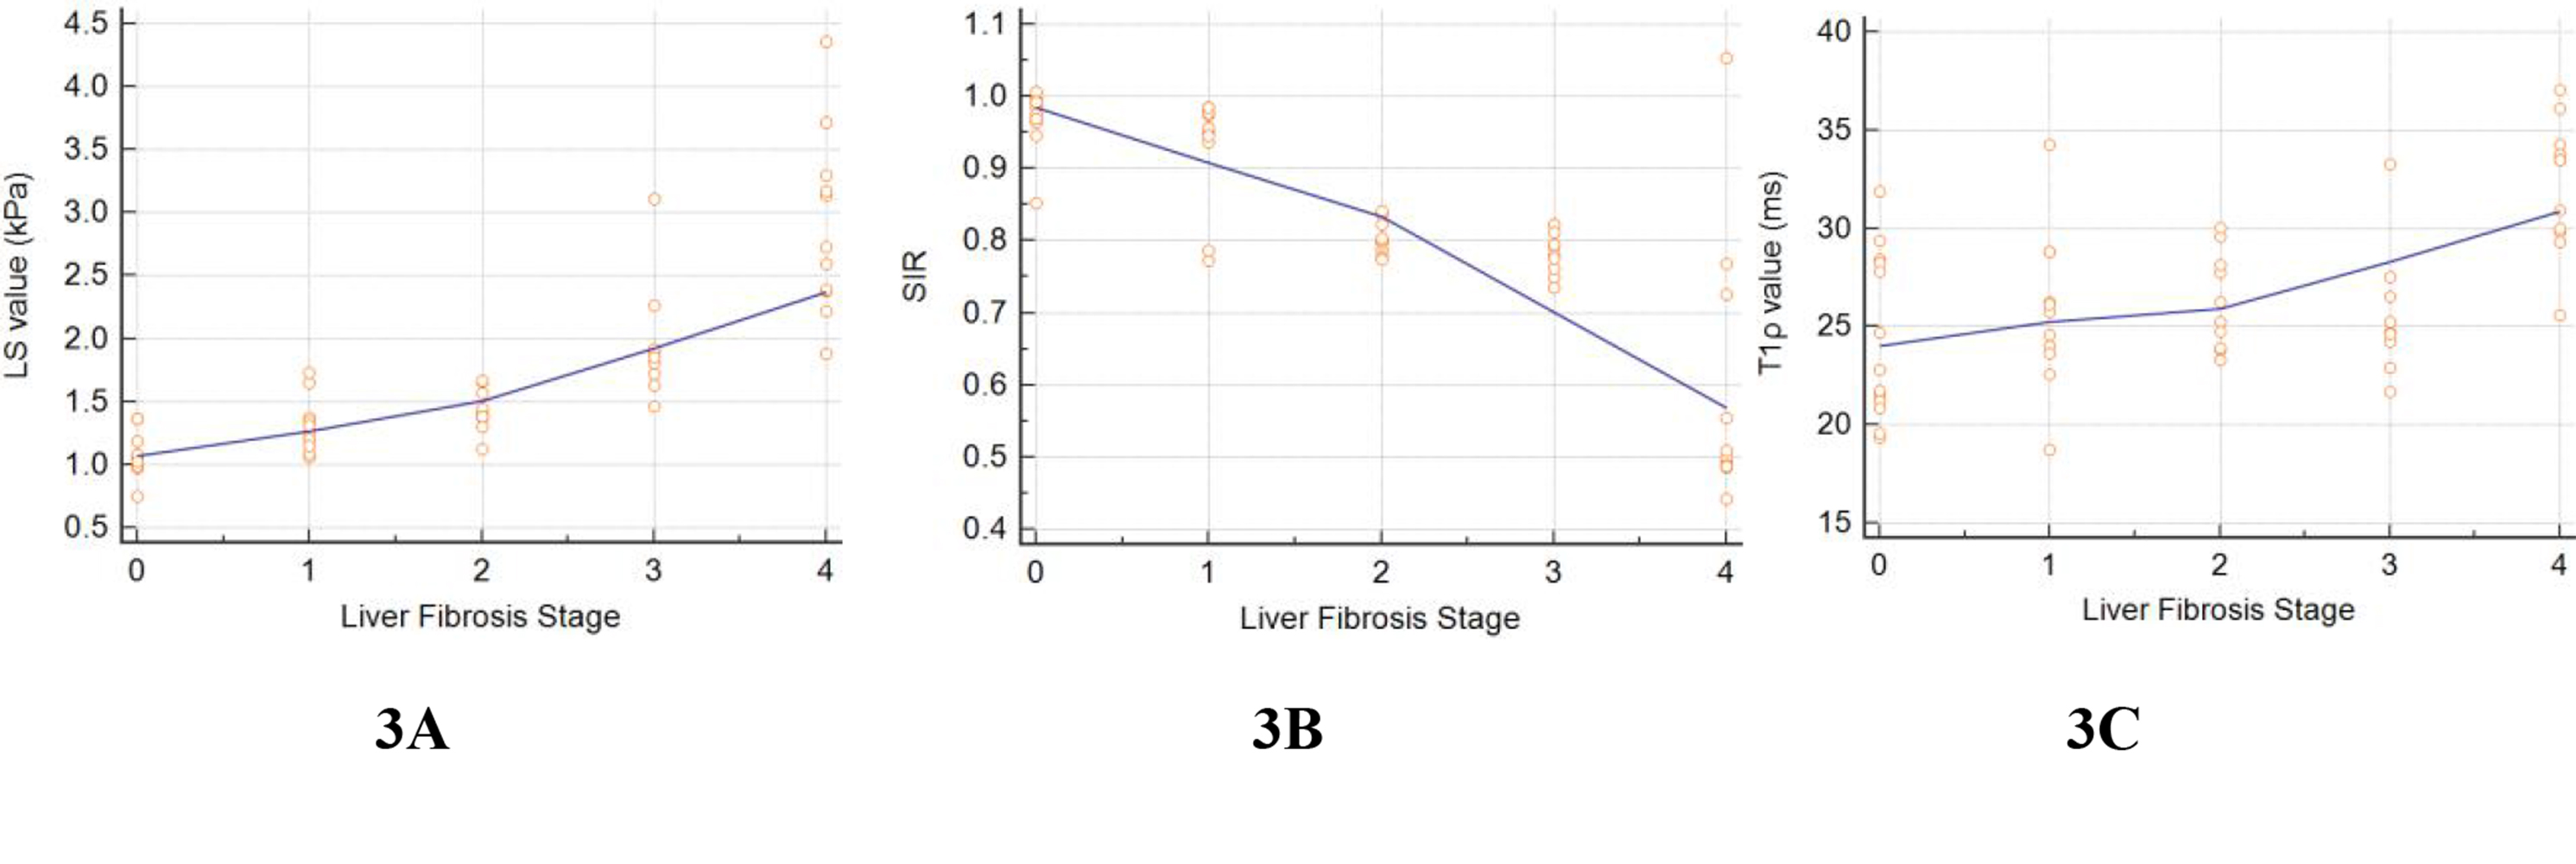
Fig.3 Correlational trendline graph of LS (A), SIR (B) and T1ρ (C) values with LF ranging from F0 to F4. (A) Strong positive correlation between LF stage and LS values (r= 0.91, P < 0.001); , and , respectively; (B) Strong negative correlation was identified between SIR values and LF stage (r = -0.81, P < 0.001) ; (C) Moderate positive correlation between LF stage and T1ρ values (r = 0.51, P < 0.001).
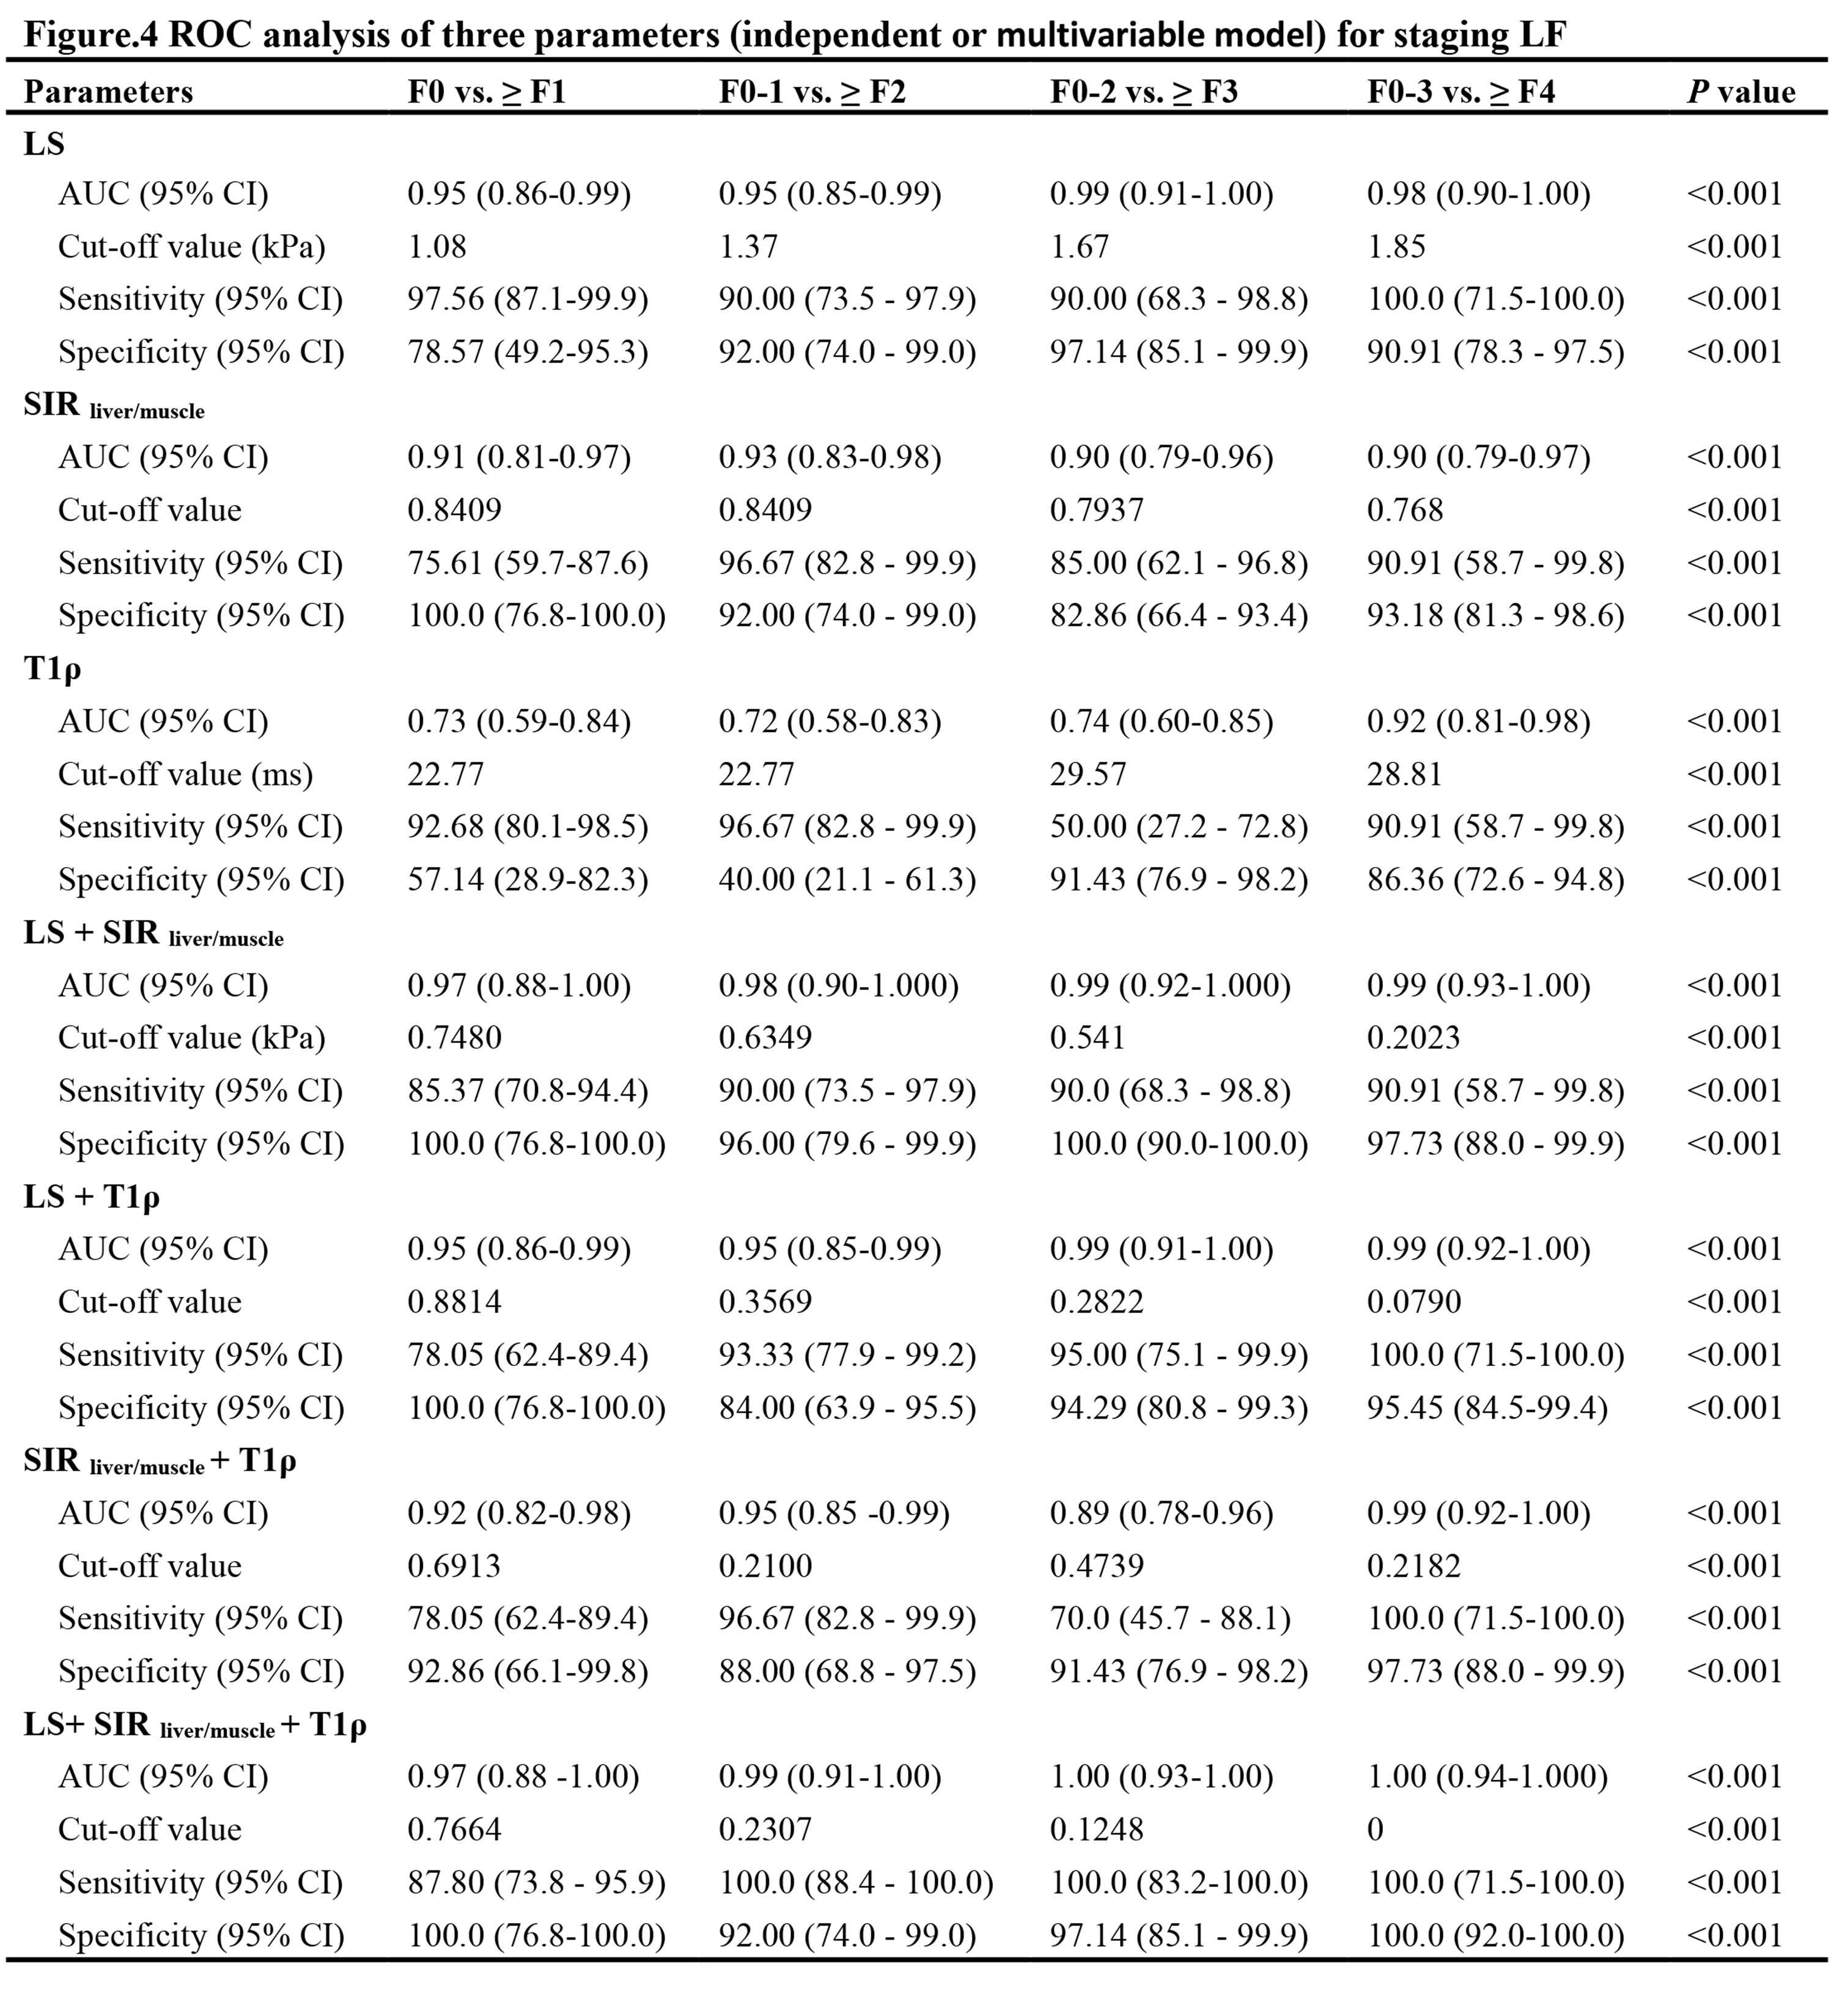
ROC analysis of three parameters (independent or multivariable model) for staging LF
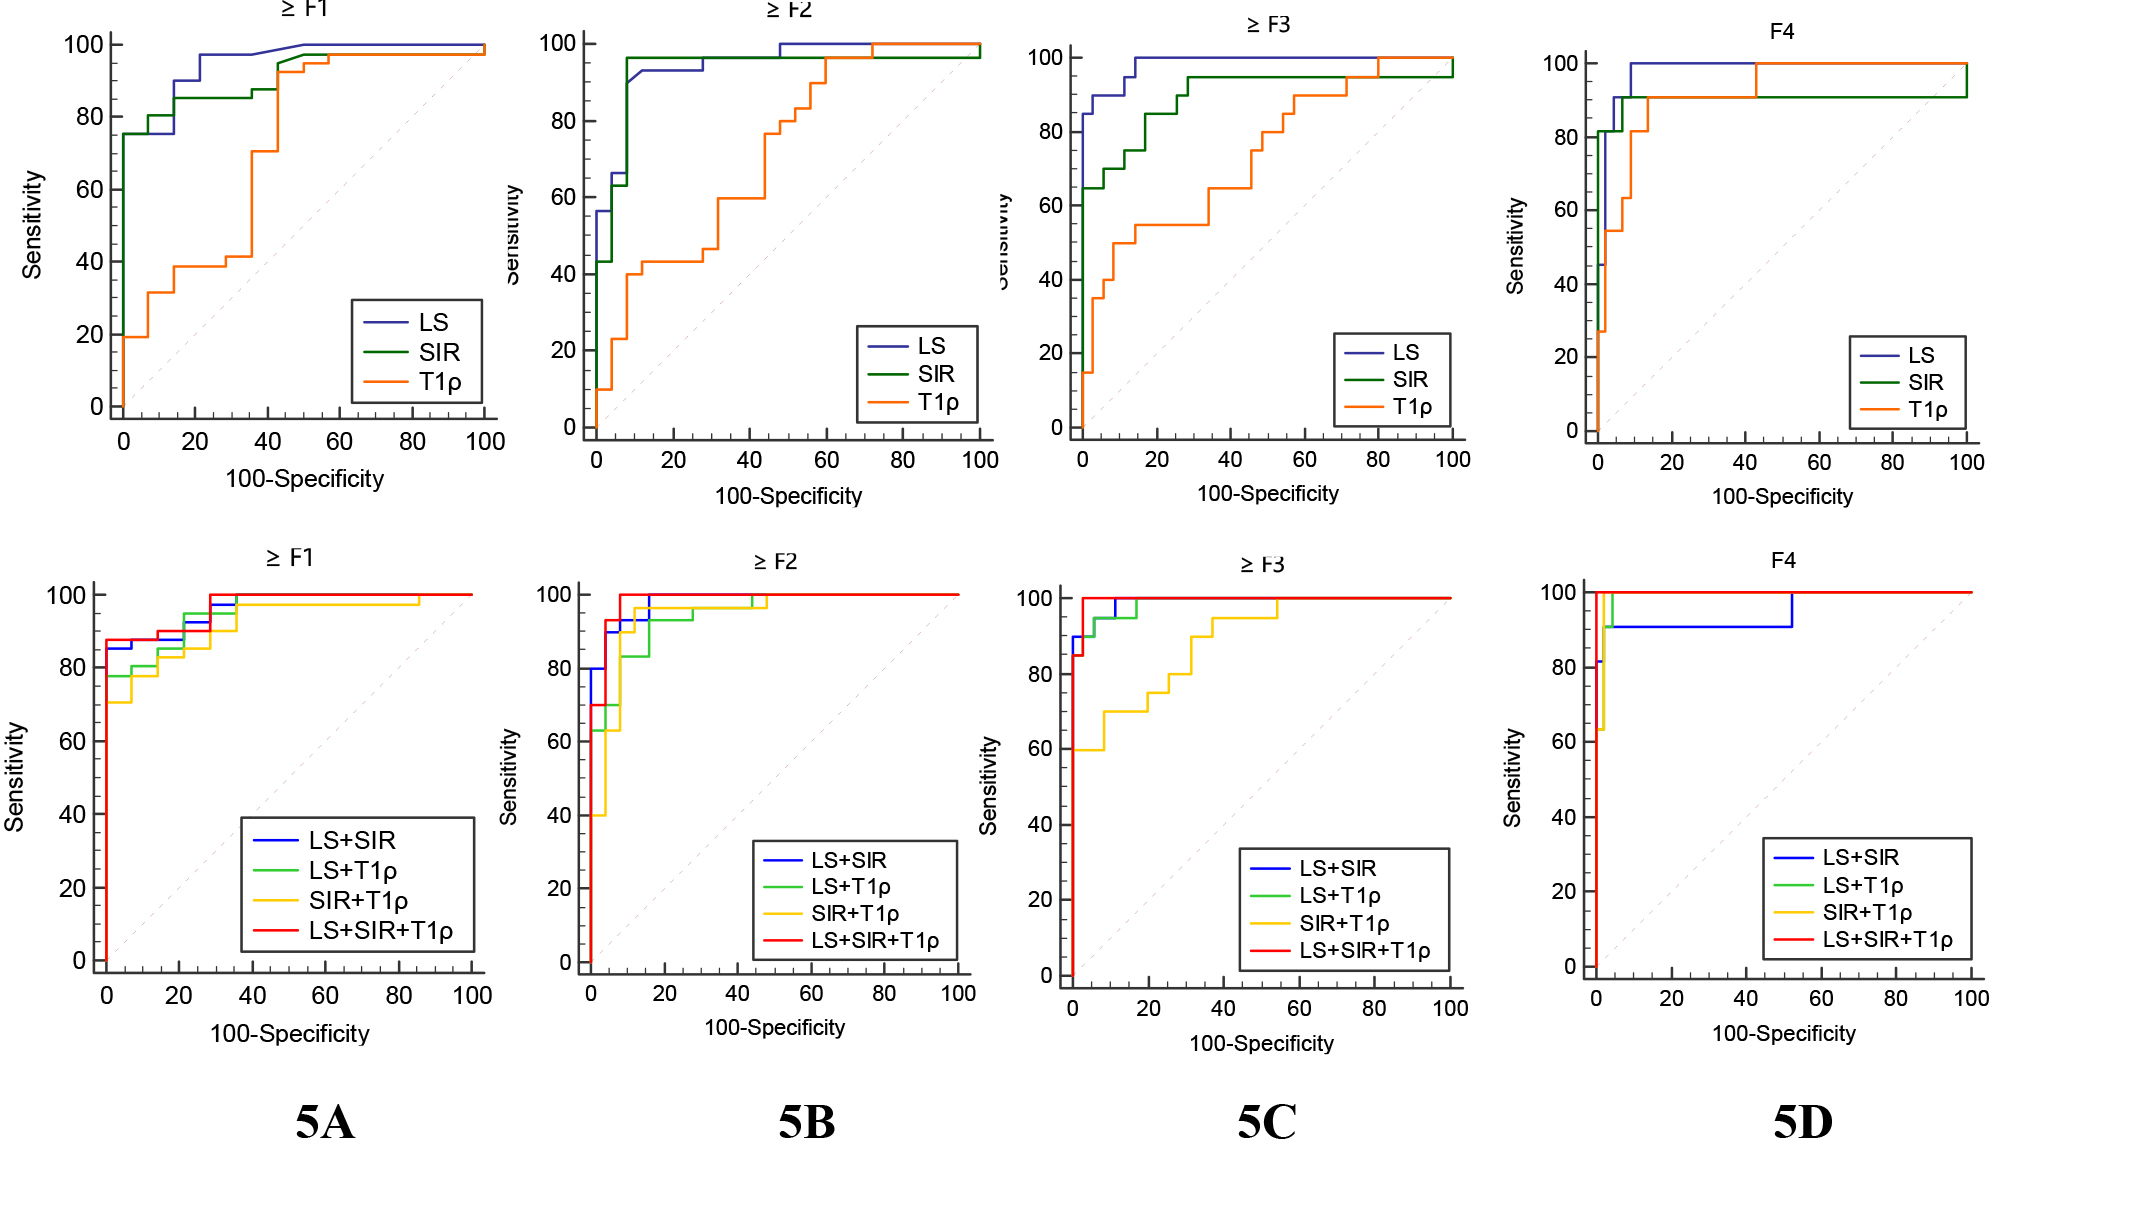
A-D: ROC cuve of independent and combined parameters of LS, SIR and T1ρ in identifying LF stage ≥ F1 (A), ≥ F2 (B), ≥ F3 (C) and ≥ F4 (D), respectively.