2498
Comparison Of GraSE Versus FSE T2 Mapping In The Liver And Correlation With Histologic Fibrosis Stage In Pediatric Autoimmune Liver Disease1Imaging Research Center, Department of Radiology, Cincinnati Children's Hospital Medical Center, Cincinnati, OH, United States, 2Division of Hepatology, Gastroenterology and Nutrition, Cincinnati Children's Hospital Medical Center, Cincinnati, OH, United States, 3Department of Pathology and Laboratory Medicine, University of Cincinnati Medical Center, Cincinnati, OH, United States
Synopsis
Autoimmune liver diseases can lead to hepatic fibrosis which, when progressive, can lead to liver failure ultimately requiring transplantation. In this study 31 patients with autoimmune liver diseases underwent conventional and GraSE T2 mapping at 1.5T as well as liver biopsy with histologic fibrosis staging. Significant positive correlations between GraSE and conventional liver T2 measurements were observed for the weighted mean of all slices (r=0.80; p<0.0001) and for individual slices from all subjects (r=0.72; p<0.0001). Conventional T2 measurements were higher, on average, than GraSE T2 measurements. There was no significant correlation observed between liver T2 measurements and histologic fibrosis stage.
INTRODUCTION
Liver fibrosis involves excess accumulation of extracellular matrix and collagen which is apparent upon histologic assessment[1]. If progressive, deposition of liver fibrosis can lead to cirrhosis, portal hypertension, and liver failure, with some individuals ultimately requiring liver transplantation. Historically, liver biopsy has been considered the gold standard for diagnosing and staging liver fibrosis; however, non-invasive imaging-based methods have shown promise for liver fibrosis evaluation[2].Various MRI-based non-invasive methods for detecting and measuring liver fibrosis have been reported, including T1, T1rho, and T2 mapping(relaxometry)[3]. While T2 mapping is most often performed using a multi-echo fast spin-echo (FSE) approach, T2 mapping using a gradient and spin echo(GraSE) sequence is a potential alternative approach that has been employed in cardiac MRI for rapid myocardial T2 estimation[4]. Primary advantages of the GraSE technique is greater anatomic liver coverage and decreased motion artifacts, with imaging performed during a one or two breath-holds.
The goal of this study was to 1) demonstrate the correlation/agreement between conventional FSE and GraSE T2 measurements in the liver, and 2) determine if there is a relationship between liver T2 measurements and histologic fibrosis stage in children and young adults with autoimmune liver disease.
METHODS
Thirty-one subjects participated in this IRB-approved study. Written informed consent/assent was obtained from subjects or their parents/guardians, as appropriate. All the subjects were clinically diagnosed with either primary sclerosing cholangitis (PSC), autoimmune sclerosing cholangitis (ASC), or autoimmune hepatitis (AIH).All imaging was performed using a 1.5T scanner (Ingenia; Phillips-Healthcare; Best, the Netherlands). Axial T2 mapping of liver was performed using both GraSE and FSE pulse sequences as a part of a multiparametric MRI research protocol. Imaging parameters for the GraSE acquisition included: number of slices=6, slice thickness=10mm, TR=290ms per slice per TE, TE=20 different echo times ranging from 10ms to 200ms in increments of 10ms, acquisition matrix=172x168, flip angle=90°, with T2 GraSE parametric maps generated directly from the scanner. Similarly, imaging parameters for the FSE acquisition included: number of slices=6, slice thickness=8mm, TR=3000 ms per slice per TE, TE=20 different echo times ranging from 12ms to 240ms in increments of 12ms, acquisition matrix=256x179, flip angle=90°, with T2 FSE parametric maps generated directly from the scanner.
The total scan time for the GraSE acquisition for all slices was 34.8 seconds, with imaging performed over two breath-holds. The total scan time for the FSE acquisition was ~6 minutes and required respiratory-triggering.
Using scanner-generated parametric maps, relaxation times were obtained by drawing regions-of-interest (ROIs) using ImageJ software[5]. Care was taken to ensure that the ROIs were drawn on right lobe of the liver, did not include any visible vessels, and excluded the liver capsule. The mean GraSE and conventional T2 relaxation times were weighted for ROI size. A total of five slices with excessive motion artifacts from conventional FSE acquisitions were excluded from our analyses; no GraSE slices were excluded from analysis.
Twenty-one of the 31 subjects also underwent liver biopsy within 6 months of their MRI scan. Liver fibrosis in these subjects was histologically staged using the METAVIR fibrosis grading scale, ranging from F0-F4 where a score of F0 indicated no fibrosis and a score of F4 indicated cirrhosis. Correlation between conventional and GraSE T2 measurements was assessed using Spearman rank-order correlation, and the agreement between two methods was assessed using Bland-Altman analysis. Conventional and GraSE T2 measurements were compared between patients with F0-F1 and F2-F4 histologic stages using the Mann-Whitney U test.
RESULTS
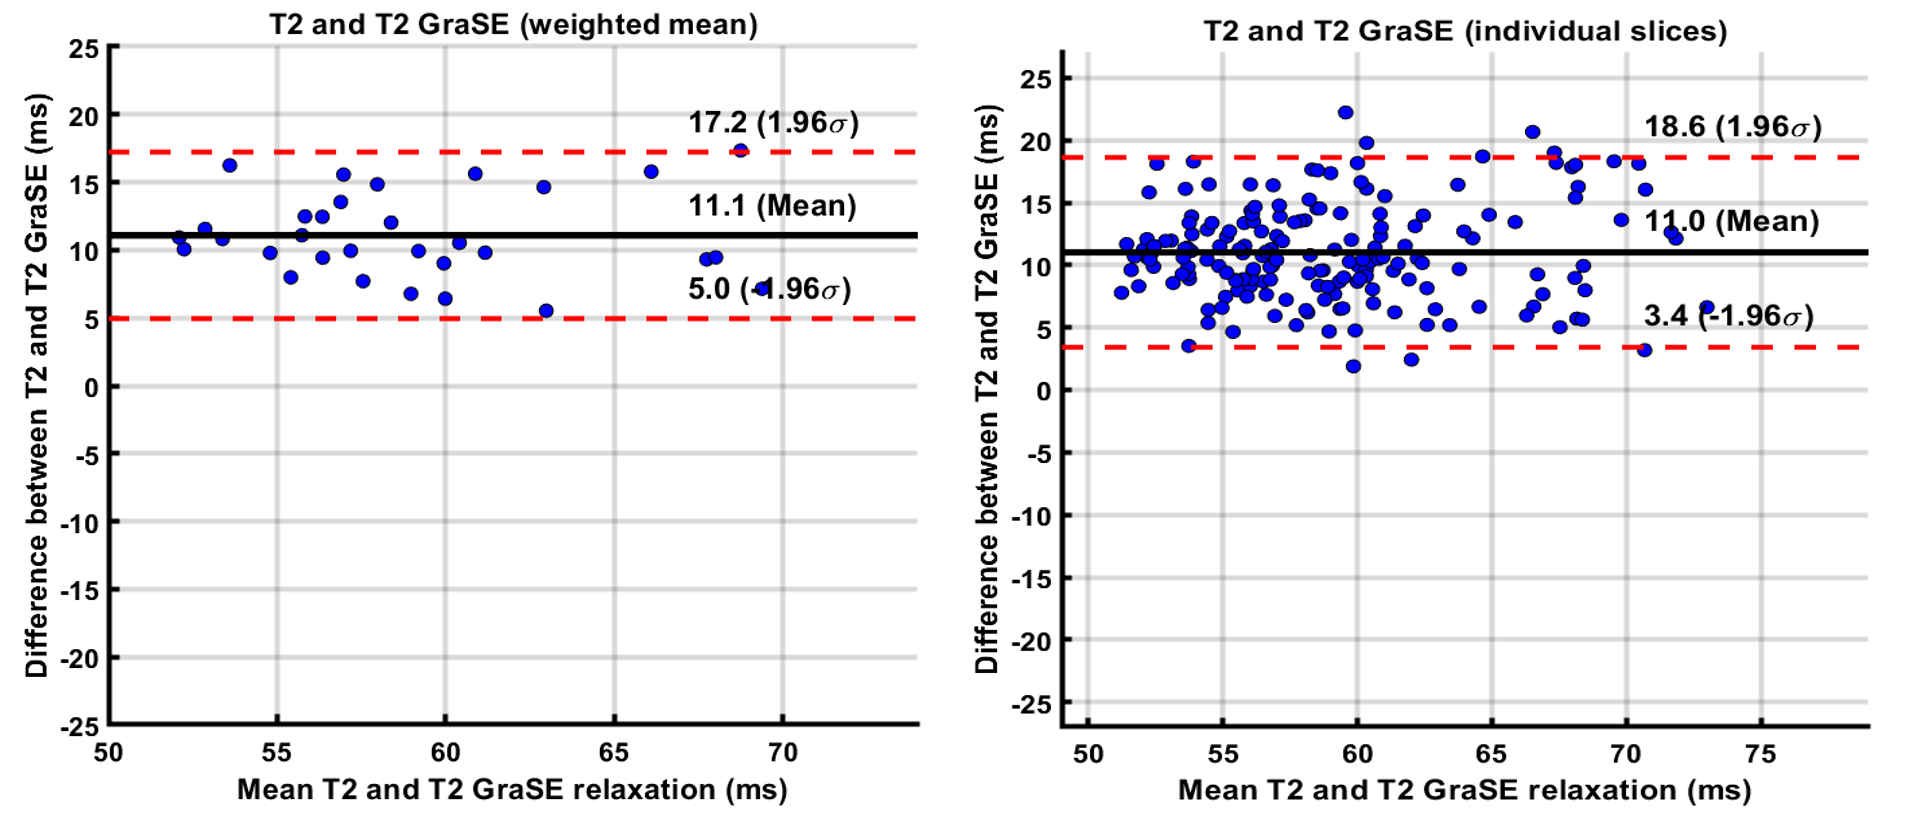
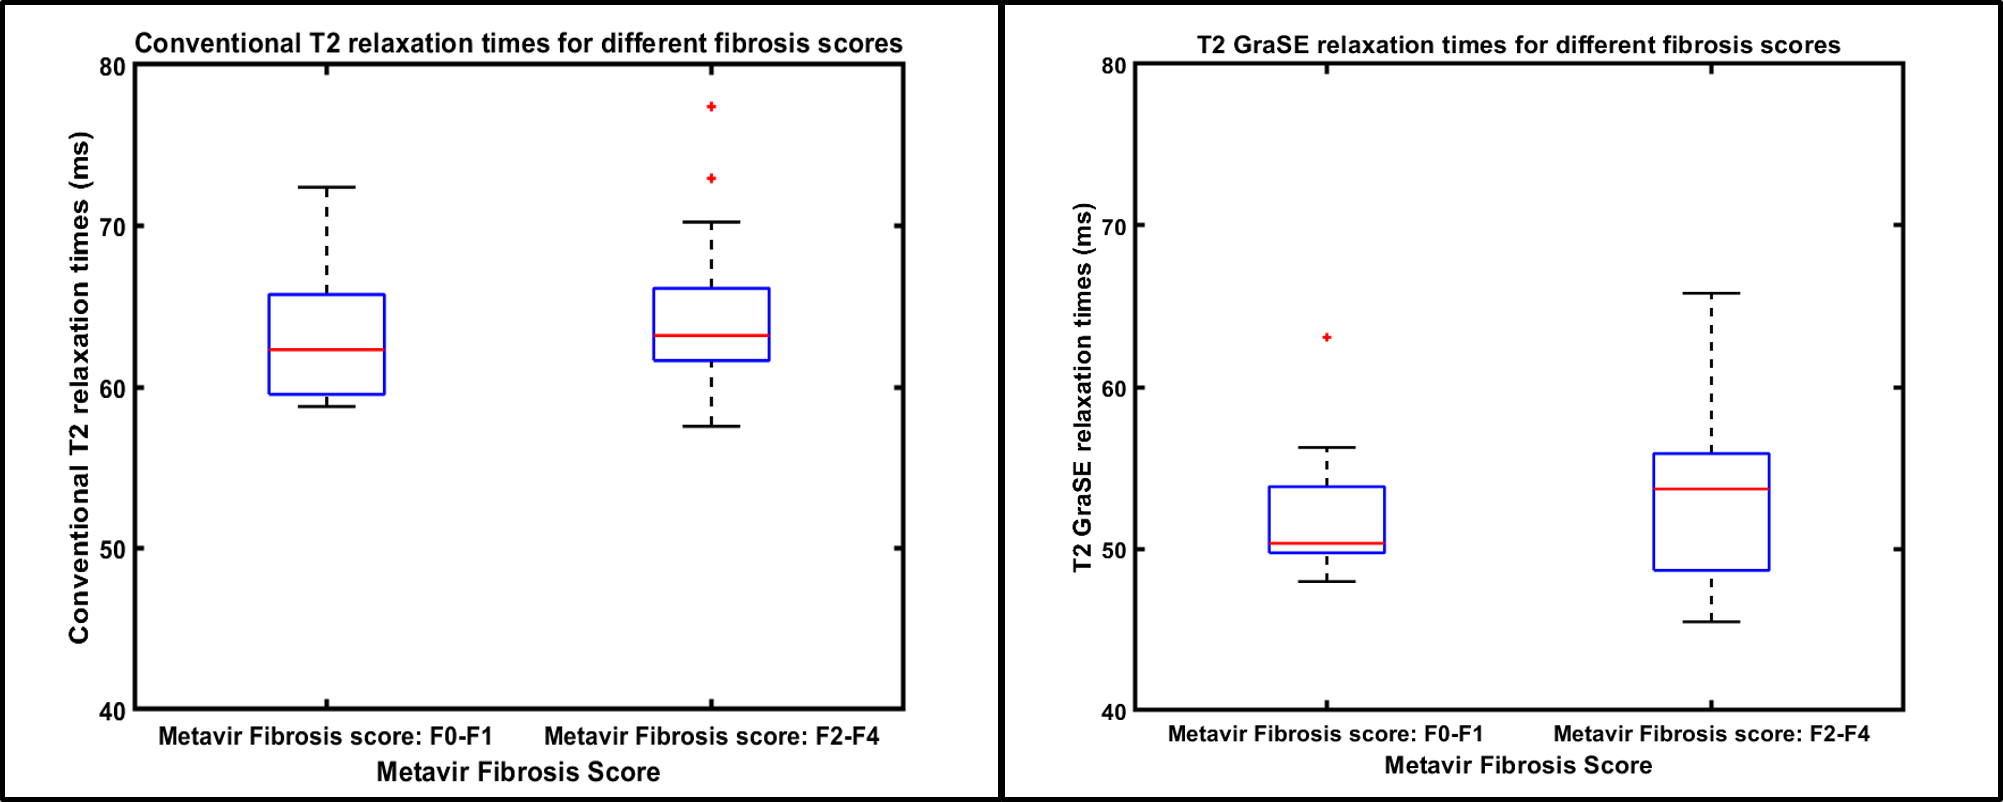
Age range of patients was 8-23 years (mean age: 16 years; 17 males). There was a very strong correlation between liver GraSE and conventional T2 measurements (r=0.80; p<0.0001), when comparing the weighted mean of all 6 slices for all subjects; whereas slice-by-slice correlation was strong and only slightly lower (r=0.72; p<0.0001) (Figure 1). Bland-Altman analysis showed a mean bias of 11.1ms (95% Limits of Agreement [LoA]: 5 to 17.2ms) between GraSE and conventional mean T2 measurements. Similarly, Bland-Altman analysis showed a mean bias of 11.0 ms (95% LoA: 3.4 to 18.6ms) between techniques for individual slices (Figure 2).Median (of weighted means) liver GraSE T2 was 50.33ms for subjects (n=8) with F0-F1 histologic fibrosis, while median GraSE T2 was 53.69ms for subjects (n=13) with F2-F4 histologic fibrosis (p=0.75) (Figure 3, left). Median (of weighted means) liver conventional T2 was 62.32ms for subjects with F0-F1 histologic fibrosis, while median conventional T2 was 63.19ms for subjects with F2-F4 histologic fibrosis (p=0.745) (Figure 3, right).
DISCUSSION and CONCLUSION
Our results show there is strong positive correlation between liver T2 measurements obtained using a fast breath-held GraSE sequence and a conventional respiratory triggered FSE sequence. Bland-Altman analysis revealed a systematic bias between techniques (with conventional T2 measurements being higher, on average) and indicates that the two techniques should not be used interchangeably. Our results suggest that T2 mapping cannot be used to accurately distinguish individuals with no/mild from individuals with moderate/severe histologic liver fibrosis in the setting of pediatric autoimmune liver disease. Future analyses include correlating our T2 measurements with measurements of liver T1 relaxation and liver stiffness. Further studies are also needed to confirm our results, including in adult populations and in individuals with other causes of chronic liver disease.Acknowledgements
Cincinnati Children's Hospital and Medical Center - Center for Autoimmune Liver Disease funding.References
1. Bataller, Ramón, and David A Brenner. “Liver fibrosis.” The Journal of clinical investigation vol. 115,2 (2005): 209-18. doi:10.1172/JCI24282
2. Mumtaz, S. , Schomaker, N. and Von Roenn, N. (2019), Pro: Noninvasive Imaging Has Replaced Biopsy as the Gold Standard in the Evaluation of Nonalcoholic Fatty Liver Disease. Clinical Liver Disease, 13: 111-113. doi:10.1002/cld.750
3. Guimaraes AR, Siqueira L, Uppal R, et al. T2 relaxation time is related to liver fibrosis severity. Quant Imaging Med Surg. 2016;6(2):103–114. doi:10.21037/qims.2016.03.02
4. Sprinkart, A.M., Luetkens, J.A., Träber, F. et al. Gradient Spin Echo (GraSE) imaging for fast myocardial T2 mapping. J Cardiovasc Magn Reson 17, 12 (2015) doi:10.1186/s12968-015-0127-z
5. Schneider, C. A.; Rasband, W. S. & Eliceiri, K. W. (2012), "NIH Image to ImageJ: 25 years of image analysis", Nature methods 9(7): 671-675, PMID 22930834
Figures