2497
Comparison Of Manual And Automatic Liver MR Elastography Processing For Shear Stiffness Estimation In Children And Young Adults1Imaging Research Center, Department of Radiology, Cincinnati Children's Hospital Medical Center, Cincinnati, OH, United States, 2Division of Hepatology, Gastroenterology and Nutrition, Cincinnati Children's Hospital Medical Center, Cincinnati, OH, United States, 3Resoundant Inc., Rochester, MN, United States, 4Department of Radiology, Mayo Clinic, Rochester, MN, United States
Synopsis
Autoimmune liver diseases lead to fibrosis and is manifested as excessive accumulation of extracellular matrix and collagen that ultimately causes increase in liver stiffness. MR Elastography (MRE) has proven to be an important tool to clinically diagnose liver fibrosis. In this study we performed MRE at 1.5T on 65 subjects with autoimmune liver disease. The data was then manually processed by 2 independent readers and an automated algorithm. Near-perfect correlation and excellent agreement were observed between Reader1 and Reader2 against the automated algorithm (r=0.987 and r=0.981, respectively). Readers had excellent inter-reader agreement(ICC=0.988) and the automated algorithm also demonstrated perfect reproducibility.
INTRODUCTION
Autoimmune liver diseases commonly lead to fibrosis (scarring), which is histopathologically manifested as excessive accumulation of extracellular matrix and collagen[1,2]. This increase in tissue fibrosis leads to abnormally increased liver stiffness over time[3]. Deposition of fibrosis can lead to liver cirrhosis, portal hypertension, and ultimately liver failure and can warrant need for liver transplantation in some individuals[2]. Liver biopsy has been and continues to be the gold standard to diagnose and stage liver fibrosis; however, it is invasive and has disadvantages such as pain to subjects due to its invasive nature, sampling error, inter- and intra-pathologist variability, high cost, and rare complications, such as internal bleeding that can result in prolonged hospital stay[4]. Magnetic resonance elastography (MRE) has emerged in recent years as a promising FDA-approved clinical tool to aid in non-invasively diagnosing and staging liver fibrosis[5,6]. The goal of this study is to compare liver shear stiffness estimates obtained by Automatic Liver Elasticity Calculation (ALEC) processing of two-dimensional (2D) gradient-recalled echo (GRE) MRE data to values obtained from standard-of-care manual processing.METHODS
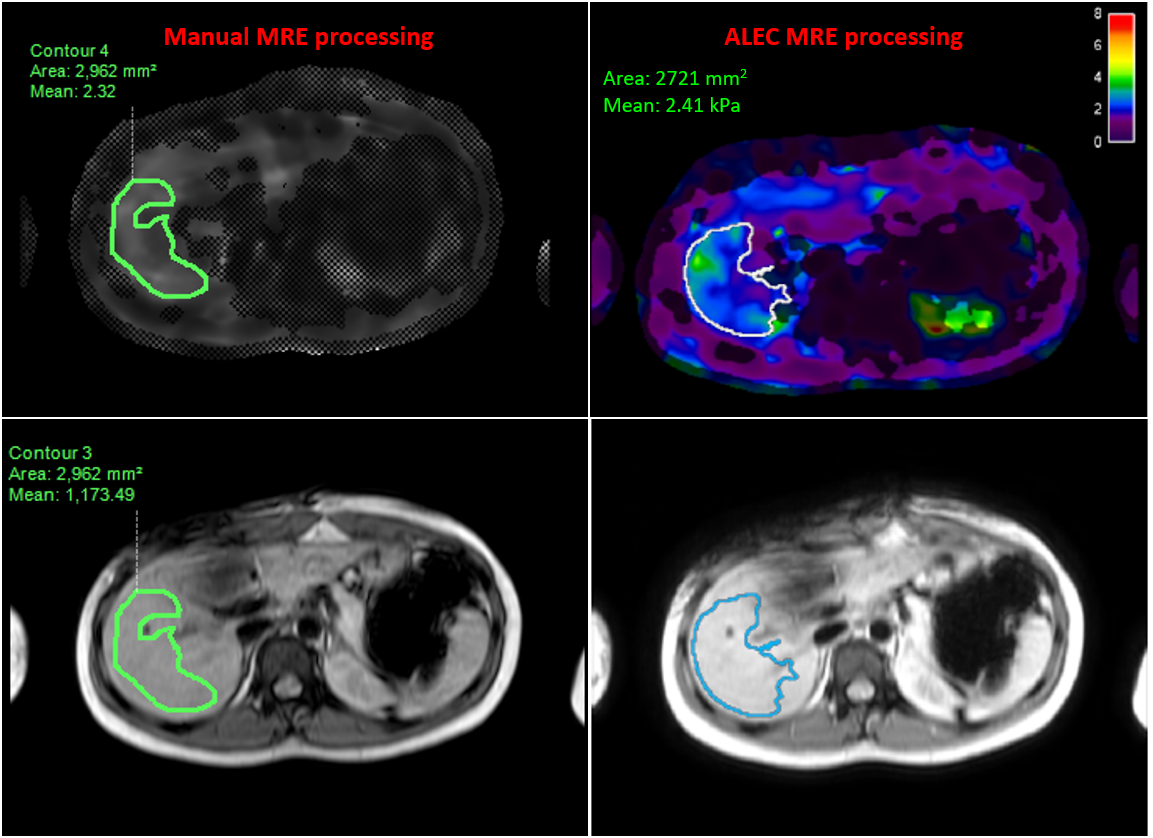
Sixty-five patients with autoimmune liver diseases (autoimmune/primary sclerosing cholangitis (ASC/PSC) or autoimmune hepatitis (AIH) underwent 2D GRE MRE at 60 Hz on a 1.5T scanner (Ingenia; Philips Healthcare; Best, the Netherlands) as a part of the imaging protocol for this IRB-approved study. The subjects were instructed to lie down in supine position (head-first) on the scanner table, with a passive pneumatic driver positioned on the upper right side of abdomen over the liver to generate mechanical transverse waves at a set frequency and amplitude. Imaging parameters for the clinical 2D GRE MRE sequence included: echo time (TE) = 20.24 ms, time of repetition (TR) = 50 ms, slice thickness = 10 mm, number of slices = 4, acquisition matrix = 252 x 80, flip angle = 20°, and field of view (FOV) = 380 x 380 mm.For manual processing, elastograms were generated in Intellispace Portal v10.1 (Philips Healthcare) with two readers (R1, R2) independently placing regions-of-interest (ROIs) to calculate mean liver stiffness weighted for ROI size for all subjects (Figure 1, left). Care was taken to exclude blood vessels and liver capsule, while staying within right lobe of the liver and left medial segment. ALEC (Mayo Clinic; Rochester, MN) generated elastograms with automatically segmented ROIs directly from MRE magnitude and phase images for all subjects (Figure 1, right). Intellispace portal and ALEC both used a Multimodal Direct Inversion (MMDI) algorithm for computation of stiffness maps. Results obtained using manual and ALEC processing were then compared using Pearson’s correlation (r), intra-class correlation coefficients (ICC), and Bland-Altman analyses.
RESULTS
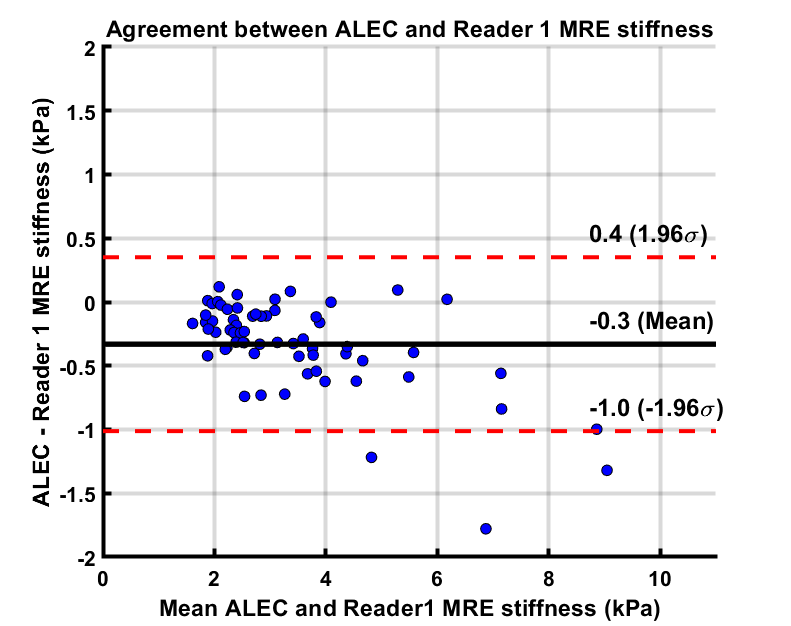
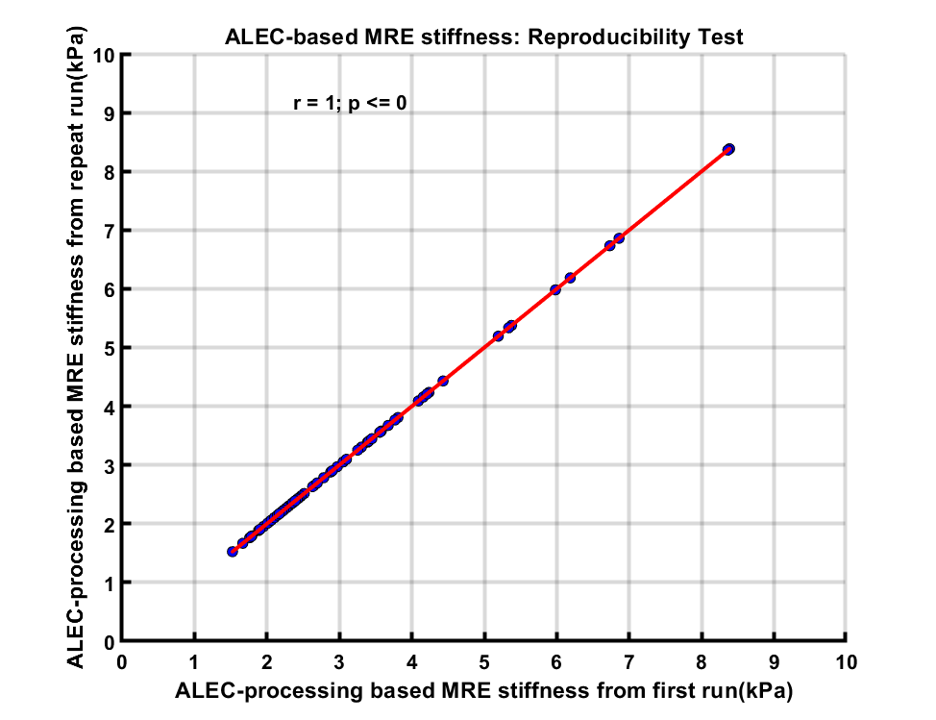
Age of study participants ranged from 8 to 23 years (mean age: 15.5 years; 35 males). ICC for inter-reader agreement for manual processing was excellent (ICC=0.988, 95%CI: 0.981-0.993), with mean bias of 0.05 kPa (95% Limits of Agreement [LoA]: -0.46 to 0.56 kPa) (Figure 2). Correlation between manual and ALEC processing was near-perfect (R1: r=0.986; R2: r=0.981; p-values <0.0001), with mean bias of -0.32 kPa (R1 95% LoA: 0.36 to -1.00 kPa) and -0.28 kPa (R2 95% LoA: 0.41 to -0.98 kPa) (Figure 3, 4). ALEC measurements were perfectly reproducible (r=1, p<0.0001; mean bias=0 kPa, 95% LoA: 0 kPa) (Figure 5). Manual processing on average took 5:48 ± 1:07 minutes per subject. All the data was processed automatically with ALEC in the background using batch file that took 3:30 minutes to set up. Mean computation time for each case using ALEC processing was 2:53 minutes on a Microsoft Windows 10 system with Intel® Core ™ i5-7500, 4 Core CPU, and 16 GB RAM.DISCUSSION AND CONCLUSION
Liver stiffness values computed using ALEC showed excellent agreement with manual analysis for both readers and were perfectly reproducible. Clinically, ALEC processing of MRE data should eliminate inter-observer variability, facilitate workflows, and reduce post processing time.Acknowledgements
Cincinnati Children's Hospital Medical Center - Center for Autoimmune Liver Disease fundingReferences
1. Pinto RB, Schneider AC, da Silveira TR. Cirrhosis in children and adolescents: An overview. World J Hepatol. 2015;7(3):392–405. doi:10.4254/wjh.v7.i3.392
2. Bataller R, Brenner DA. Liver fibrosis [published correction appears in J Clin Invest. 2005 Apr;115(4):1100]. J Clin Invest. 2005;115(2):209–218. doi:10.1172/JCI24282
3. Baiocchini A, Montaldo C, Conigliaro A, et al. Extracellular Matrix Molecular Remodeling in Human Liver Fibrosis Evolution. PLoS One. 2016;11(3):e0151736. Published 2016 Mar 21. doi:10.1371/journal.pone.0151736
4. Sumida Y, Nakajima A, Itoh Y. Limitations of liver biopsy and non-invasive diagnostic tests for the diagnosis of nonalcoholic fatty liver disease/nonalcoholic steatohepatitis. World J Gastroenterol. 2014;20(2):475–485. doi:10.3748/wjg.v20.i2.475
5. Venkatesh SK, Yin M, Ehman RL. Magnetic resonance elastography of liver: clinical applications. J Comput Assist Tomogr. 2013;37(6):887–896. doi:10.1097/RCT.0000000000000032
6. Morisaka, H. , Motosugi, U. , Ichikawa, S. , Nakazawa, T. , Kondo, T. , Funayama, S. , Matsuda, M. , Ichikawa, T. and Onishi, H. (2018), Magnetic resonance elastography is as accurate as liver biopsy for liver fibrosis staging. J. Magn. Reson. Imaging, 47: 1268-1275. doi:10.1002/jmri.25868
Figures