2496
A Fast 3D MR Elastography Sequence for Measurement of Liver Stiffness in One Breath Hold
Hui Wang1,2,3, Amol Pednekar2,3, Jean A. Tkach2,3, Charles L. Dumoulin2,3, Kaley R. Bridgewater2, Andrew T. Trout2,3, and Jonathan R. Dillman2,3
1Philips, Cincinnati, OH, United States, 2Department of Radiology, Cincinnati Children’s Hospital Medical Center, Cincinnati, OH, United States, 3Department of Radiology, University of Cincinnati College of Medicine, Cincinnati, OH, United States
1Philips, Cincinnati, OH, United States, 2Department of Radiology, Cincinnati Children’s Hospital Medical Center, Cincinnati, OH, United States, 3Department of Radiology, University of Cincinnati College of Medicine, Cincinnati, OH, United States
Synopsis
We describe a 3D fast field echo (FFE) Magnetic Resonance Elastography (MRE) pulse sequence for measurement of liver stiffness in a single breath hold. The key features of the sequence include: 1) 3D acquisition; 2) mechanical wave magnitude labelling of 1.5 cycles of motion for each RF excitation; 3) flow saturation pre-pulses to suppress vascular flow; and 4) pseudorandom undersampling of k-space with Compressed SENSE reconstruction. The technique was validated in two gel phantoms with different stiffness and used to measure liver stiffness in five volunteers.
Introduction
MR Elastography (MRE) allows the noninvasive measurement of liver stiffness which correlates with histopathologic grading of fibrosis1-3. Two-dimensional (2D) fast field echo (FFE) MRE with multiple breath holding (BH) is the most common approach. We have implemented a new fast MRE pulse sequence that uses modified motion encoding gradients (MEGs) to allow a shorter TR while maintaining synchronization with the mechanical wave in combination with spatial pre-saturation pulses and SENSE reconstruction4. In this work, we extend the sequence to a 3D volume acquisition and apply pseudorandom undersampling of k-space with compressed SENSE (CS) reconstruction to reduce acquisition time of the full imagine volume to a single BH. Validation of the 3D FFE MRE sequence was accomplished through comparison to the conventional 2D FFE MRE technique in two gel phantoms with different stiffness and in five volunteers.Methods
The conventional 2D FFE MRE sequence was implemented through the modification of a standard phase-contrast sequence to include a MEG along the slice-select direction. For liver MRE, a mechanical wave frequency of 60 Hz is typically used with saturation pre-pulses applied independently every RF excitation. Each phase-contrast phase-encoding (PCPE) step is acquired within 6 acoustic cycles (100 ms), with reversal of the MEG polarity each TR. The proposed fast 3D MRE sequence diagram is shown in Figure 1. To suppress inflow artifacts, two parallel regional saturation (REST) pre-pulses5 are applied independently and are interleaved with data acquisition. The REST pre-pulse has a duration of one motion cycle (16.67 ms) to maintain motion synchronization.Two strategies are used to shorten the BH time: 1) Compact sequence design4,6, with one PCPE step acquired every 3 acoustic cycles with MEG polarity remaining fixed in one direction. To synchronize the MEGs with the mechanical motion wave, each trigger of the mechanical driver occurs every 4th TR and sends 7 cycles of external motion. 2) Pseudorandom undersampling of k-space with CS reconstruction. The acquisition parameters for conventional 2D MRE and proposed fast 3D MRE sequences were TE = 20ms, FOV = 300 x 300, reconstruction matrix = 256 x 256, motion frequency = 60Hz, time offsets number = 4, slice thickness = 10mm. For the conventional 2D MRE sequence, SENSE = 2, FA = 25 degrees, and number of slices = 4. For the fast 3D MRE sequence, CS acceleration factor = 5, FA = 20 degrees, and number of slices = 5.
All imaging was performed on a Philips Ingenia 1.5T scanner (Best, The Netherlands). Two cylindrical gel phantoms with different stiffness (Resoundant, Inc., MN, USA) were scanned with a 15-channel head coil. Five volunteer subjects (mean age 42 ± 12 years, 4 M/1F) were recruited under an institutional review board approved protocol. Liver MRE was performed using a 28-channel anterior/posterior torso coil array. MR elastograms were generated using a multimodal direct inversion (MMDI) algorithm (Mayo Clinic, Rochester, MN) from which stiffness measurements were made on all slices, and the region of interest (ROI) weighted average of the mean stiffness value (kPa) measured for each slice was recorded. Bland-Altman analysis was used to assess the mean bias between two techniques and 95% limits of agreement, using conventional 2D MRE as the reference. All image reconstruction and stiffness map computations were performed in real time on the scanner console.
Results
The mean and standard deviation of stiffness for two phantoms were 3.09 ± 0.07 kPa, 5.89 ± 0.20 kPa with conventional 2D MRE sequence and 3.08 ± 0.19 kPa, 5.70 ± 0.48 kPa with the proposed fast 3D MRE sequence, respectively.The mean and standard deviation of liver stiffness was 1.95 ± 0.28 kPa with conventional 2D MRE sequence and 1.93 ± 0.30 kPa with the proposed fast 3D MRE sequence with interleaved flow saturation. Mean and standard deviation of stiffness for each volunteer were 2.38 ± 0.32, 1.70 ± 0.28, 1.57 ± 0.25, 2.02 ± 0.26, 2.10 ± 0.29 kPa for the conventional 2D MRE sequence, and 2.28 ± 0.37, 1.61 ± 0.28, 1.67 ± 0.29, 1.98 ± 0.30, 2.11 ± 0.27 kPa for the fast 3D MRE sequence with interleaved flow saturation (Figure 2). Mean bias between the two MRE techniques was 0 kPa (95% limits of agreement: -0.1 to 0.2 kPa) by Bland-Altman analysis (Figure 3). The ROI sizes from the conventional 2D MRE were larger than the fast 3D MRE with interleaved flow saturation sequence (2248 ± 564 mm2 vs 1633 ± 436mm2) (Figure 4).
For volunteer scans, BH time was 13.3 seconds per slice for conventional 2D MRE (4 BHs to cover 4 slices) and 15.6 seconds for fast 3D MRE with interleaved flow saturation (1 BH to cover 5 slices).
Conclusion
In this feasibility study, stiffness maps obtained in phantoms and five asymptomatic volunteers using the proposed fast 3D MRE sequence were comparable to conventional 2D MRE sequence. The proposed sequence reduced the standard liver MRE exam time from 4 BHs to 1 BH, by combining compact pulse sequence design with pseudorandom undersampling of k-space with CS reconstruction while maintaining pulsatile flow artifact suppression. Fast 3D MRE has the potential to shorten the MRE exam time or to provide greater spatial coverage.Acknowledgements
No acknowledgement found.References
[1] Yin et.al, Radiology 2016, 278(1):114-24. [2] Xanthakos et. al, J Pediatr 2014, 164(1):186-8. [3] Serai et. al, Abdom Imaging 2015, 40(4): 789-94. [4] Wang et.al, ISMRM2019, #1741. [5] Felmlee et.al, Radiology 1987, 164:559-564. [6] Chamarthi et. al. MRI 2014, 32(6), 679-683.Figures
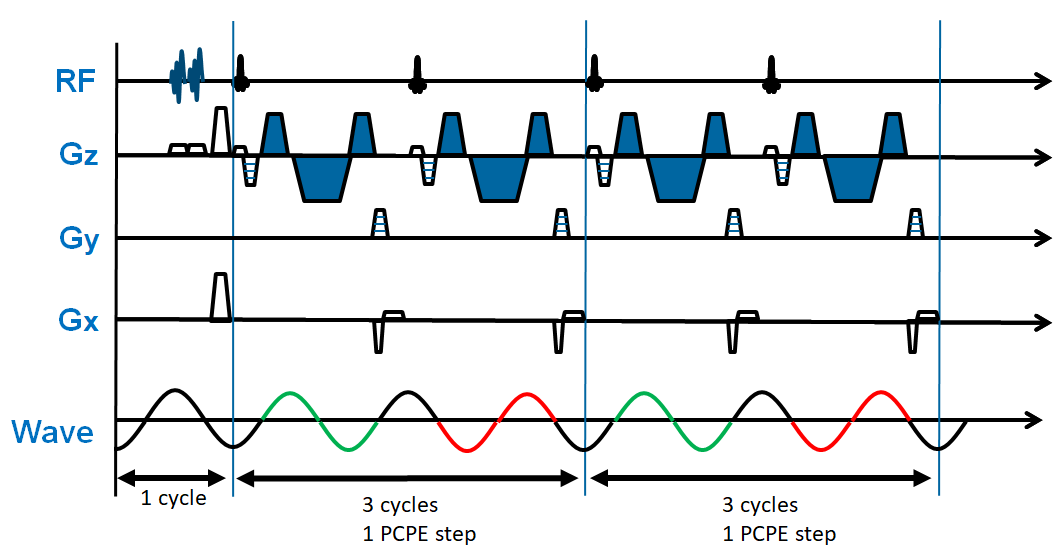
Figure 1. Schematic diagram of proposed
fast 3D MRE pulse sequence. Flow suppression pre-pulse are applied within one motion
cycle (16.67ms at 60Hz frequency) and are interleaved with variable phase-contrast
phase-encoding (PCPE) steps. In this diagram, two PCPE steps are shown. Each
PCPE step consists of two RF excitations with repetition time of 1.5 motion
cycles. The polarity of MEGs remains the same across TRs, as illustrated by the
MEG denoted in blue. Gz = slice select direction, Gy = phase encoding direction,
Gx = readout direction.
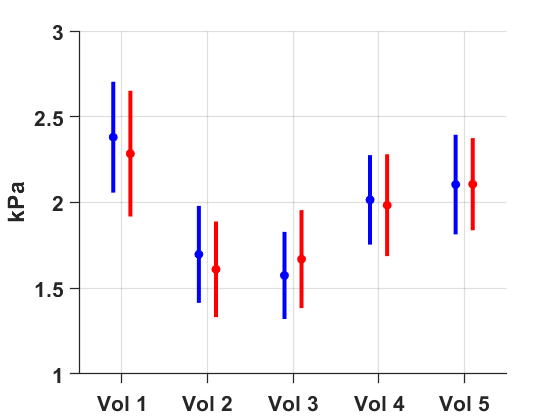
Figure 2. Mean and standard deviation of stiffness on each volunteer
(Vol) is 2.38 ± 0.32, 1.70 ± 0.28, 1.57 ± 0.25, 2.02
± 0.26, 2.10 ± 0.29 kPa for the conventional 2D MRE sequence (blue), and
2.28 ± 0.37, 1.61 ± 0.28, 1.67 ± 0.29, 1.98 ± 0.30,
2.11 ± 0.27 kPa for the fast 3D MRE sequence with interleaved inflow
saturation (red).
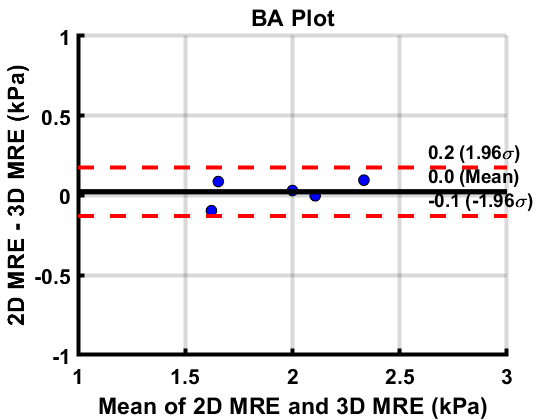
Figure 3. Bland-Altman Plot of conventional 2D MRE versus fast 3D MRE
derived stiffness values in 5 volunteers. Center line shows no mean difference
in stiffness values between these two techniques, and the upper/lower dotted
lines demarcate the 95% limits of agreement.
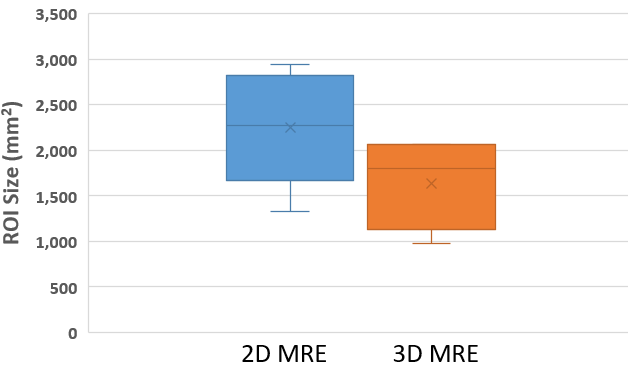
Figure 4. Box plot showing mean MRE elastogram Region of Interest (ROI)
area for the 5 volunteers. ROI area was larger for 2D MRE (2248 ± 564 mm2)
than for the 3D MRE (1633 ± 436 mm2) sequence.