2495
A Fast MR Elastography Sequence with Interleaved Inflow Saturation and Compressed SENSE
Hui Wang1,2,3, Amol Pednekar2,3, Jean A. Tkach2,3, Kaley R. Bridgewater2, Andrew T. Trout2,3, Jonathan R. Dillman2,3, and Charles L. Dumoulin2,3
1Philips, Cincinnati, OH, United States, 2Department of Radiology, Cincinnati Children’s Hospital Medical Center, Cincinnati, OH, United States, 3Department of Radiology, University of Cincinnati College of Medicine, Cincinnati, OH, United States
1Philips, Cincinnati, OH, United States, 2Department of Radiology, Cincinnati Children’s Hospital Medical Center, Cincinnati, OH, United States, 3Department of Radiology, University of Cincinnati College of Medicine, Cincinnati, OH, United States
Synopsis
We describe a fast field-echo Magnetic Resonance Elastography pulse sequence to measure liver stiffness in less than half the breath hold time (≈6.3 sec/slice) of the conventional implementation. Key features include: 1) non-alternating motion encoding gradients to allow a shorter TR while maintaining appropriate gradient waveform polarity synchronization with the applied mechanical motion; 2) interleaved flow saturation pre-pulses to suppress flow; and 3) pseudorandom undersampling k-space with Compressed SENSE reconstruction. The technique was validated in two gel phantoms differing in stiffness and used to evaluate liver stiffness in five volunteers.
Introduction
MR Elastography (MRE) provides noninvasive measurement of liver stiffness which correlates with histopathologic grading of fibrosis1-3. Two-dimensional (2D) fast field-echo (FFE) MRE with breath holding (BH) is the most common approach. In the established clinical paradigm using Cartesian sampling, each phase-contrast phase-encoding (PCPE) step is acquired over six 60Hz acoustic cycles resulting in a duration of 100 msec. Parallel imaging techniques like SENSE, GRAPPA, and ASSET can be employed to reduce BH time with typical acceleration factors of 2. We have implemented a fast MRE pulse sequence that uses modified motion encoding gradients (MEGs) to allow a shorter repetition time while maintaining appropriate synchronization with the mechanical wave in combination with spatial pre-saturation pulses4. In addition, we applied pseudorandom undersampling k-space with compressed SENSE (CS) reconstruction to further reduce BH time. This approach was compared to the conventional MRE technique in two gel phantoms with different stiffness, and in the livers of five volunteers.Methods
The conventional 2D FFE MRE sequence diagram is shown in Figure 1a. Each PCPE step is acquired in 6 acoustic cycles with reversal of the MEGs polarity every 3 cycles and pre-pulses applied independently each RF excitation. In the fast sequence with interleaved inflow saturation (Figure 1b), the saturation pre-pulses are applied independently every other RF excitation. In addition, the polarity of the MEGs is held constant and data is acquired during alternating phases of the mechanical motion wave. Each trigger of the mechanical driver sends 4 cycles of external motion4.The acquisition parameters for both sequences are TE = 20ms, FOV = 300 x 300, reconstruction matrix = 256 x 256, motion frequency = 60Hz, time offsets number = 4, slice thickness = 10mm, slice number = 4, slice gap = 1mm. Each slice is acquired in a single BH. FA = 25o for conventional sequence, and 20 o for fast sequence with interleaved flow saturation. For the fast 2D MRE sequence, CS is applied to further accelerate the acquisition. CS coalesces spatial domain variable density incoherent undersampling of k-space with a SENSE reconstruction algorithm using iterative reconstruction with sparsity constraints.
All imaging was performed on a Philips Ingenia 1.5T scanner (Best, The Netherlands). Two cylindrical gel phantoms with different stiffness (Resoundant, Inc., MN, USA) were scanned with a 15-channel head coil. Prospectively accelerated acquisitions of fast MRE were performed with different CS undersampling factors (CS = 2, 3, 4, 5) to determine the optimal acceleration factor for in-vivo scans. For this feasibility study, five volunteer subjects (mean age 42 ± 12 years, 4 M/1F) were recruited under an institutional review board approved protocol. The fast sequences w/wo interleaved inflow saturation and CS factor=3 were performed and compared with the conventional MRE sequence. Liver MRE was performed using a 28-channel anterior/posterior torso coil array. Four axial slices through the mid liver were obtained in four BHs for each sequence. MR elastograms were generated using a multimodal direct inversion (MMDI) algorithm (Mayo Clinic, Rochester, MN) from which stiffness measurements were made on all 4 slices, and the region of interest (ROI) weighted average of the mean stiffness value (kPa) measured for each slice was recorded.
Results
Phantom results: Acquisition time for conventional MRE with SENSE acceleration factor of 2 was 13.3 sec/slice. Acquisition times for fast MRE sequence with interleaved flow saturation were 9.2, 6.3, 4.9, and 4.1 sec/slice, for CS factor 2, 3, 4, 5, respectively. Mean and standard deviation of stiffness values for both phantoms are provided in Figure 2 a, b. Figure 3 shows representative magnitude images (top row), phase images (middle row), and calculated stiffness map (bottom row) for conventional MRE sequence (1st column) and the proposed fast MRE sequence with CS factor = 2, 3, 4, 5 (2nd – 5th column). Figure 3a are results from a stiffer phantom, while Figure 3b are results from a softer phantom.In-vivo liver results: For the human subjects, BH time was 13.3 sec/slice for conventional MRE, and 6.3 / 4.5 sec/slice for fast MRE w/wo interleaved flow saturation. The mean and standard deviation of the measured liver stiffness was 1.95 ± 0.28 kPa with conventional MRE sequence and 1.95 ± 0.29 kPa, 1.94 ± 0.31 kPa with the proposed fast MRE sequence w/wo interleaved flow saturation (Figure 4a). The ROI sizes between the conventional MRE and fast MRE w/wo interleaved flow saturation sequence were comparable, 2248 ± 564 mm2 vs 2061 ± 464 mm2 vs 2123 ± 426 mm2, as shown in Figure 4b. Figure 5 shows representative images on one volunteer with conventional MRE and fast MRE w/wo interleaved flow suppression. Pulsatile flow artifacts were suppressed on the fast MRE with interleaved flow saturation (middle row), comparing to the fast MRE without interleaved flow saturation (bottom row).
Conclusion
In this feasibility study, stiffness maps obtained in phantoms and five asymptomatic volunteers using proposed fast MRE sequence w/wo interleaved flow saturation were comparable to a conventional sequence. The proposed sequence shortened the BH time by combining the compact pulse sequence design with k-space undersampling with CS reconstruction while maintaining the pulsatile flow artifact suppression available in standard liver MRE.Acknowledgements
No acknowledgement found.References
[1] Yin et.al, Radiology 2016, 278(1):114-24. [2] Xanthakos et. al, J Pediatr 2014, 164(1):186-8. [3] Serai et. al, Abdom Imaging 2015, 40(4): 789-94. [4] Wang et.al, ISMRM2019, #1741.Figures
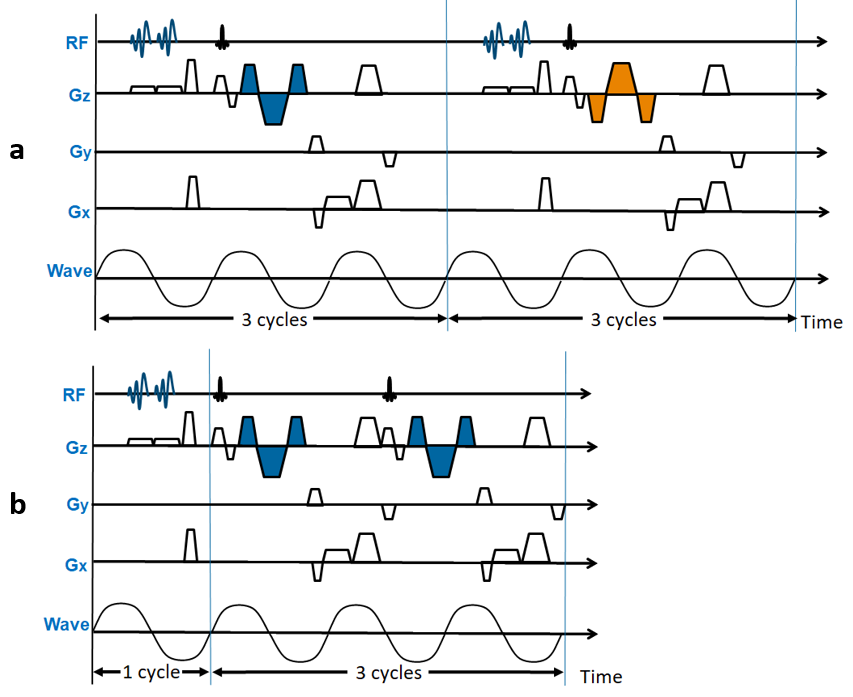
Figure 1. Schematic diagram. (a)
Conventional MRE consists of two RF excitations with repetition time of 3
mechanical cycles. The polarity of MEGs is reversed every RF excitation. Each
RF excitation triggers 3 cycles of external motion. (b)
Proposed fast MRE technique consists of two RF excitations with repetition time
of 1.5 mechanical cycles. The polarity of MEGs remains the same. Every other RF
excitation triggers 4 cycles of external motion. Three cycles for the PCPE
acquisition and one cycle for the application of two saturation pre-pulses.
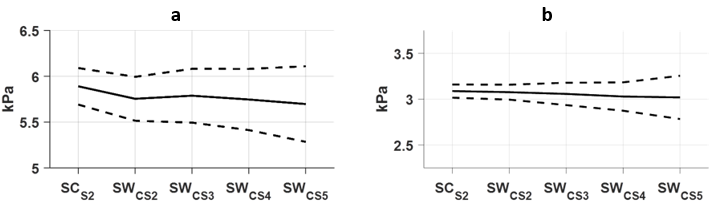
Figure 2. Phantom results. (a) The average measured mean and standard
deviation of stiffness on the stiffer phantom were 5.89 ± 0.20 kPa with the conventional
MRE sequence and 5.75 ± 0.24, 5.79 ± 0.29, 5.75 ± 0.33, 5.70 ± 0.41 kPa with
the proposed fast MRE sequence, with CS factor = 2, 3, 4, 5, respectively. (b) The
average measured mean and standard deviation of the stiffness on the softer
phantom were 3.09 ± 0.07 kPa with the conventional MRE sequence and 3.08 ±
0.08, 3.06 ± 0.12, 3.03 ± 0.16, 3.02 ± 0.24 kPa with the fast MRE sequence,
with CS factor = 2, 3, 4, 5, respectively.
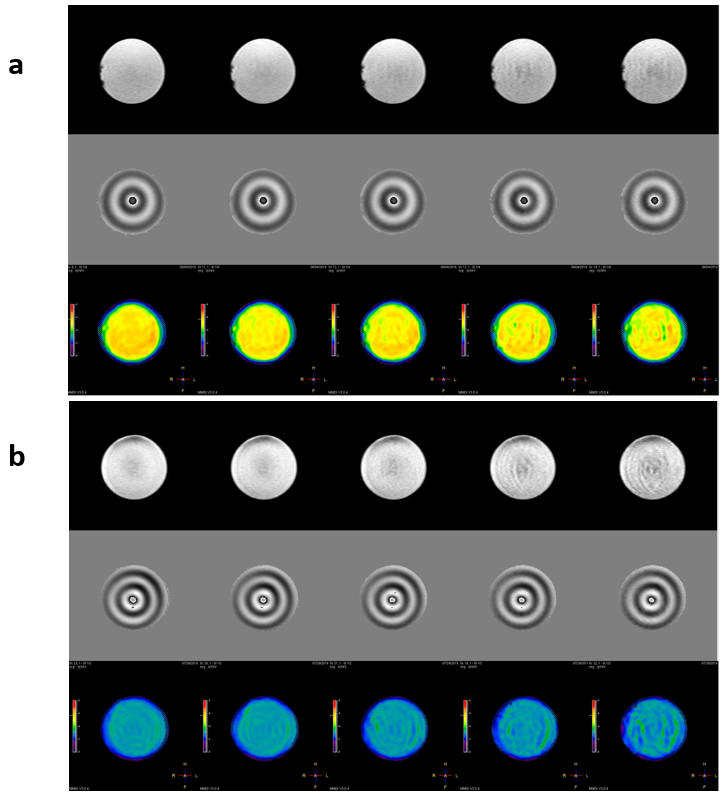
Figure 3. Representative
images on two phantoms (a - stiffer phantom, b - softer phantom) with conventional
MRE (column 1) and with fast MRE (column 2-5, with CS factor 2, 3, 4, 5,
respectively). For stiffer or softer phantom, top row are the magnitude images,
middle row are phase images, bottom row are the stiffness maps (kPa).
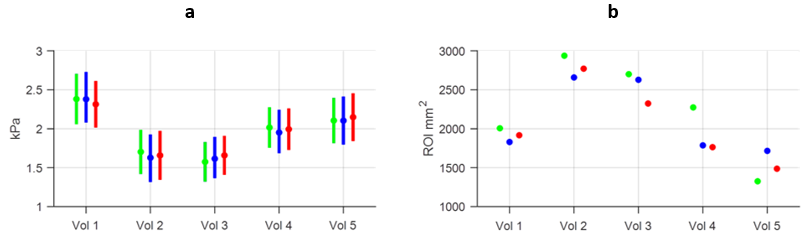
Figure 4. Volunteer results. (a) Mean and standard deviation of
stiffness on each volunteer were 2.38 ± 0.32, 1.70 ± 0.28, 1.57 ± 0.25, 2.02 ±
0.26, 2.10 ± 0.29 kPa with conventional MRE sequence (green), while 2.31 ±
0.30, 1.66 ± 0.32, 1.66 ± 0.25, 1.99 ± 0.27, 2.15 ± 0.31 kPa (blue color); 2.38
± 0.35, 1.63 ± 0.30, 1.61 ± 0.28, 1.95 ± 0.29, 2.10 ± 0.31 kPa (red) with the
fast MRE sequence w/wo interleaved inflow saturation. (b) The ROI size on each
volunteer with conventional MRE sequence (green), with the fast MRE sequence w (blue)/wo
(red) interleaved inflow saturation.
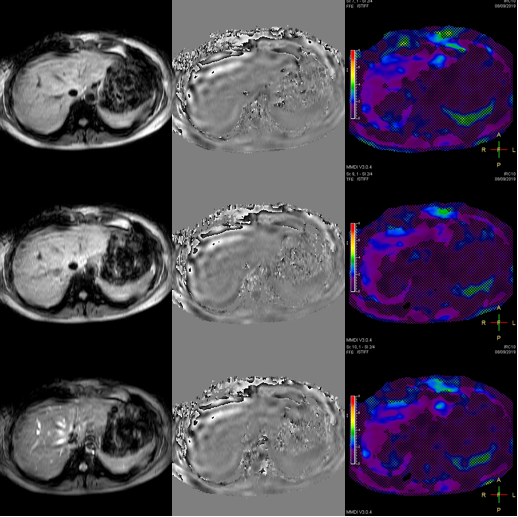
Figure 5. Representative
images in one volunteer with conventional MRE (top row), with fast MRE w/wo
interleaved flow saturation (middle and bottom row respectively). Column 1:
magnitude images. Column 2: phase images. Column 3: stiffness map (kPa). Flow
pulsation artifacts were suppressed on the fast MRE with interleaved flow
saturation (middle row), comparing to the fast MRE without interleaved flow
saturation (bottom row).