2494
Assessing the variation of MR and non-invasive markers in compensated cirrhosis: insights for assessing disease progression1Sir Peter Mansfield Imaging Centre, University of Nottingham, Nottingham, United Kingdom, 2NIHR Nottingham Biomedical Research Centre, Nottingham University Hospitals NHS Trust and University of Nottingham, Nottingham, United Kingdom
Synopsis
Baseline multi-organ MRI measures of structure and haemodynamics in the liver, spleen, heart and kidneys were collected in healthy volunteers, compensated cirrhosis (CC) and decompensated cirrhosis patients to benchmark the change in measures with disease severity. In a stable CC cohort, observed annually for 3 years, we show liver T1, liver perfusion, superior mesenteric artery flow, spleen perfusion, and renal cortex T1 (measures that predict negative liver related outcomes) have sufficient resolution to track disease progression.
Introduction
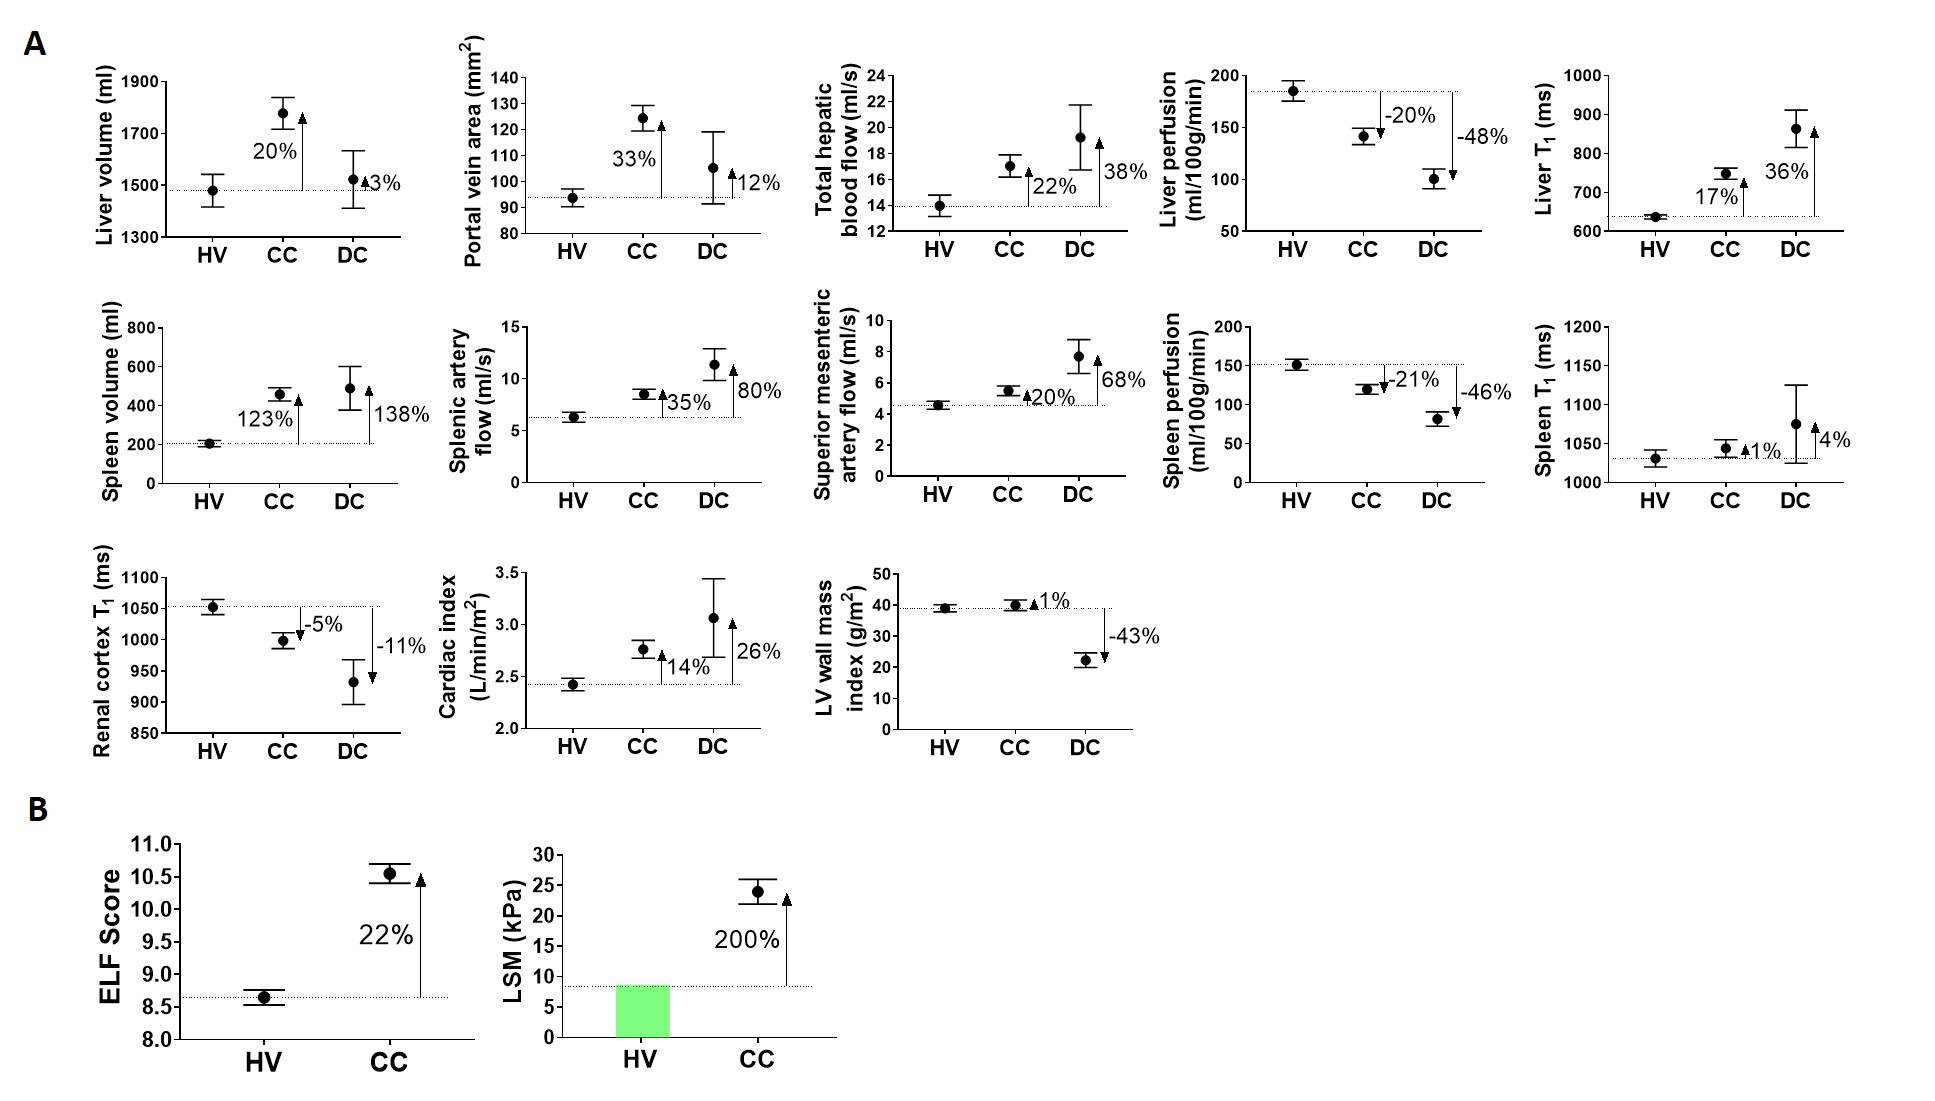
Non-invasive blood and imaging markers are used in clinical practice to diagnose liver disease. It is now recognised that multi-organ changes occur with liver disease, and these can be assessed using structural and haemodynamic MRI [1], with baseline MRI measures shown to differentiate disease severity (Fig. 1A) and predict liver related outcomes. Here, we study a cohort of patients with compensated cirrhosis annually to quantify the fluctuation over time in haemodynamic and structural MRI measures, as well as accompanying blood markers and liver stiffness measures (Fibroscan®), to assess their use as an endpoint in clinical trials.Methods
40 healthy volunteers (HV), 60 patients with compensated cirrhosis (CC) of varied aetiology (16 Non-Alcoholic Fatty Liver Disease (NAFLD), 27%; 12 Hepatitis-C Virus (HCV), 20%; 21 Alcoholic Liver Disease (ALD), 35%; 11 Other, 18%) and 7 decompensated cirrhosis (DC) patients were recruited to this study. Baseline measures were collected in all participants to benchmark the percentage change in measures with disease severity, Figure 1 [1]. Of the CC cohort, a subset of patients were observed annually for up to 3 years without developing any liver-related clinical outcomes. In this stable CC group, annual multi-organ MRI measures of structure and haemodynamics in the liver, spleen, heart and kidneys collected on a 1.5T Philips Achieva were reviewed.Non-invasive biomarkers:
At each study visit, patients underwent blood tests for clinical measures of MELD and UKELD, as well as APRI, FIB4 and ELF. In addition, liver stiffness measured (LSM) by transient elastography (Fibroscan®) was reported.
Structural MRI:
Liver and spleen volumes were estimated from bTFE localisers. Liver T1 was assessed using a modified respiratory-triggered fat suppressed SE-EPI inversion-recovery scheme (13 inversion times (TI) 100-1500ms in 100ms steps, 9 axial slices, ~2min) [2]. Spleen and renal cortex T1 maps [3] were formed using a modified respiratory-triggered inversion-recovery sequence with bFFE readout (TIs 100-900ms in 100ms steps, 5 coronal-oblique slices, ascend/descend slice order, ~3mins).
Haemodynamic MRI:
Liver and spleen perfusion was measured using a respiratory-triggered FAIR arterial spin labelling (ASL) [3] (slices matched to T1 map, post-label delay 1100ms, in-plane pre-saturation. Liver: 60 ASL pairs in ~8mins, Spleen: 30 ASL pairs in ~5 mins). Vessel flow (velocity, area and flux) was assessed using phase contrast (PC)-MRI with 15 phases across the cardiac cycle with VENC 100/50/100/140/200 cm/s for the hepatic artery (HA)/portal vein (PV)/splenic artery (SPA)/superior mesenteric artery (SMA)/ascending aorta (30 phases). Left ventricle (LV) wall mass was measured using a short-axis TFE cine (12 slices, 30 phases).
For all measures collected in the stable CC cohort, percentage change from baseline (Fig. 2, Fig. 3), and year-on-year coefficient of variation (CoV) (Fig. 2, Fig. 4) was computed.
Results
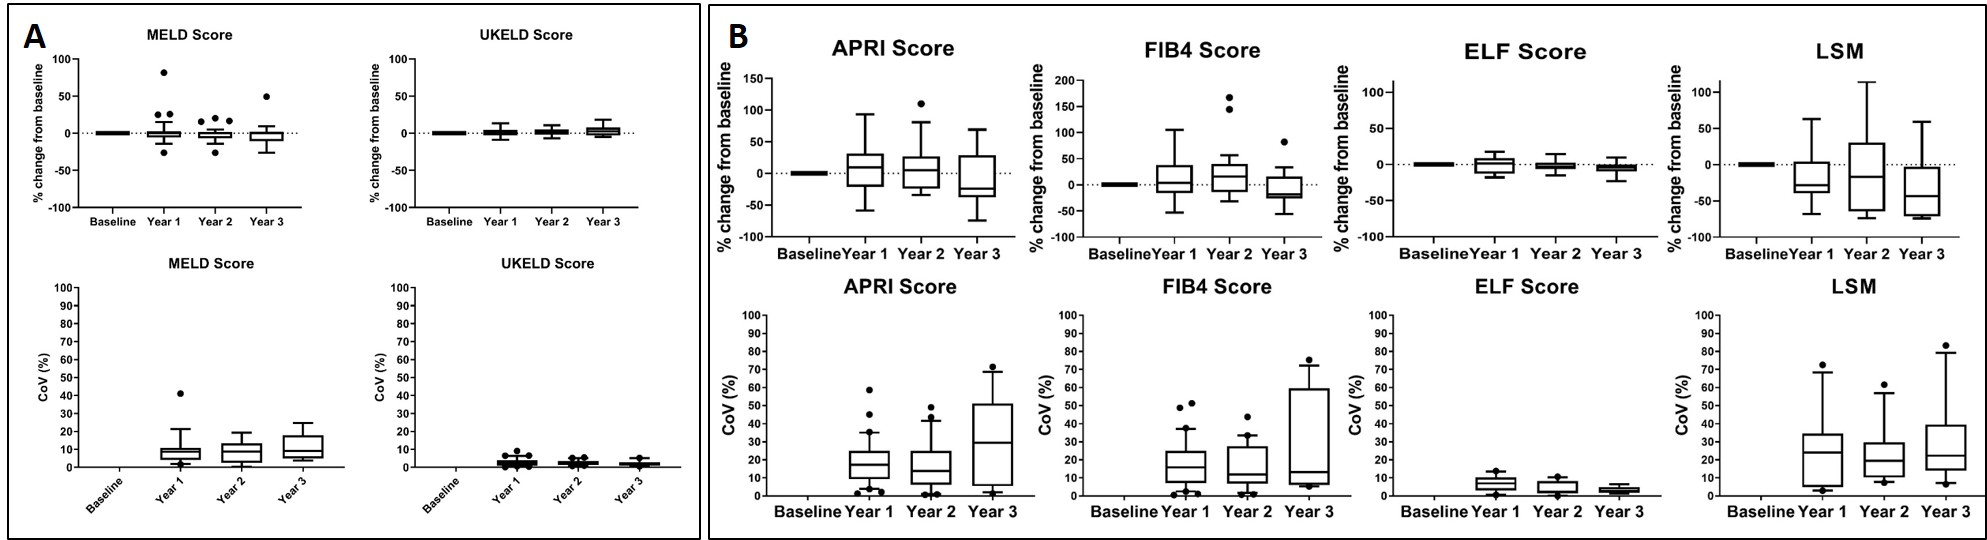
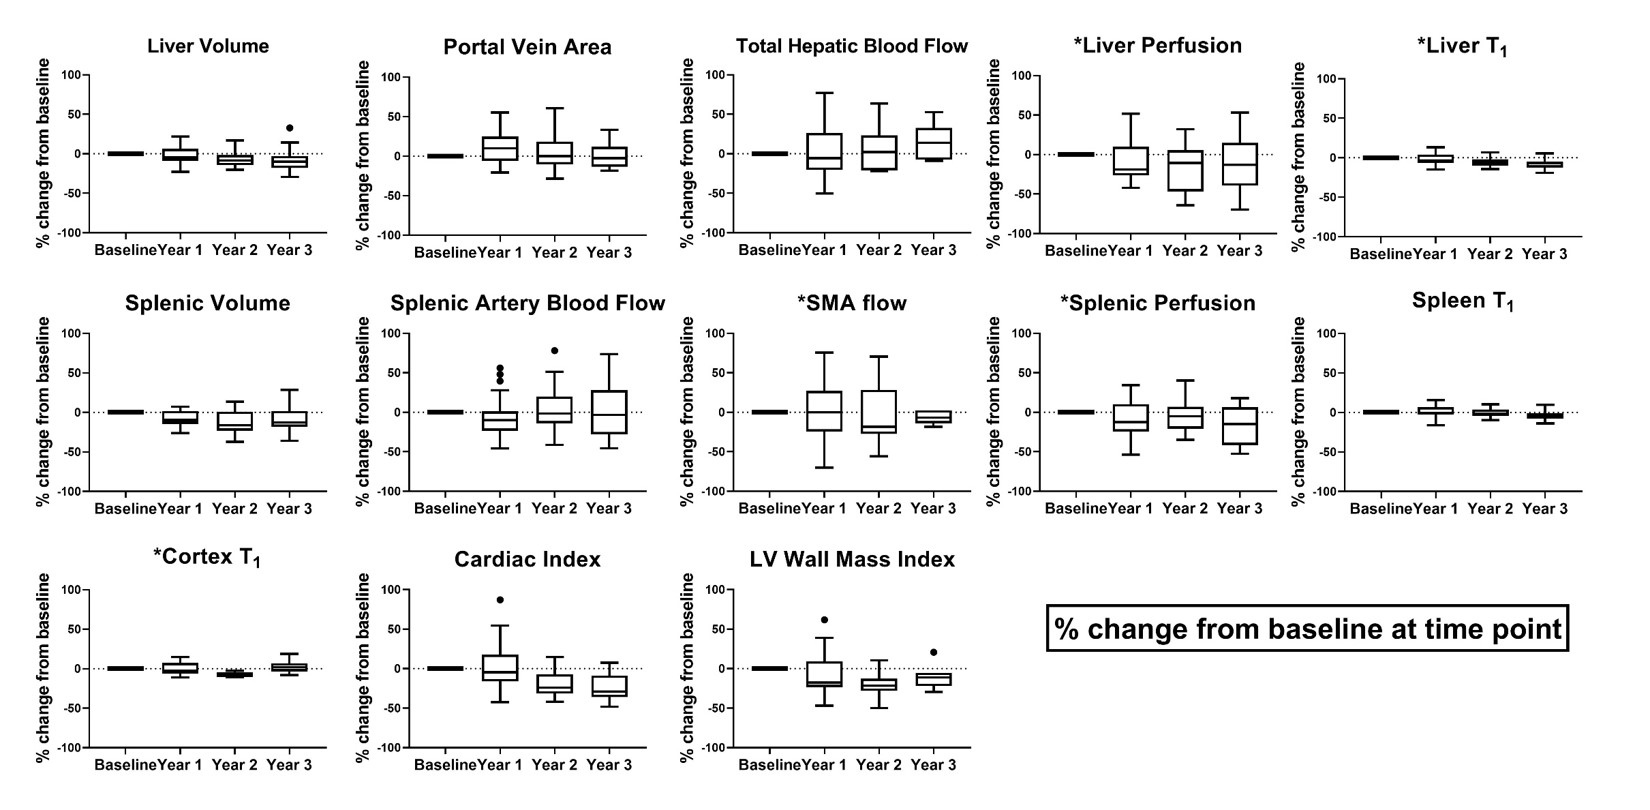
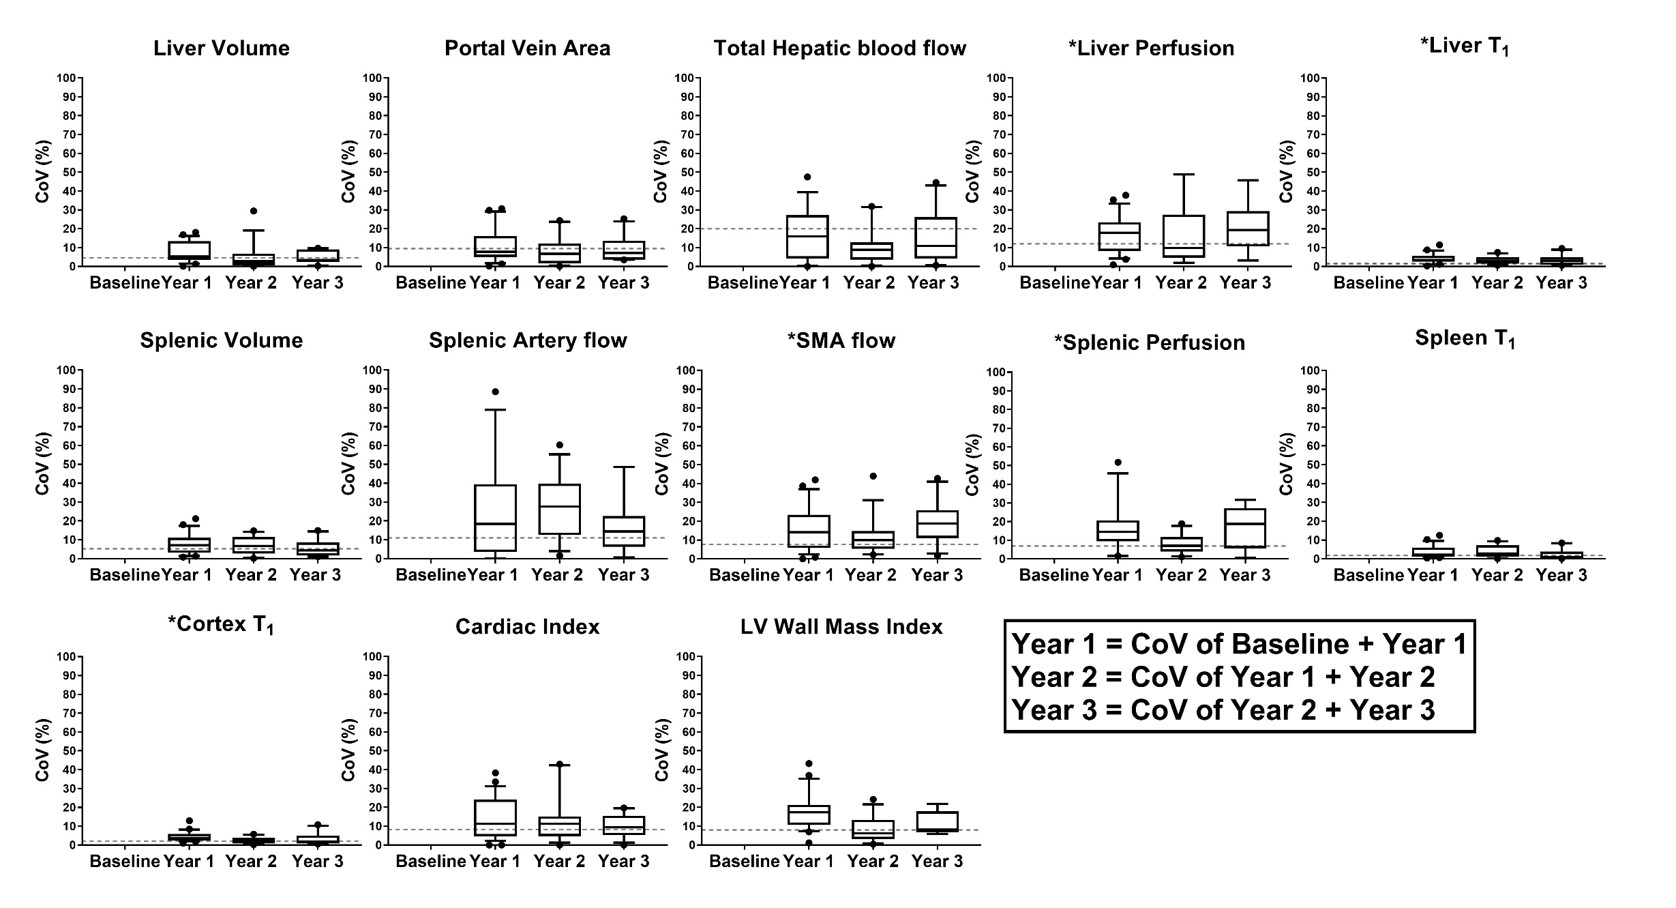
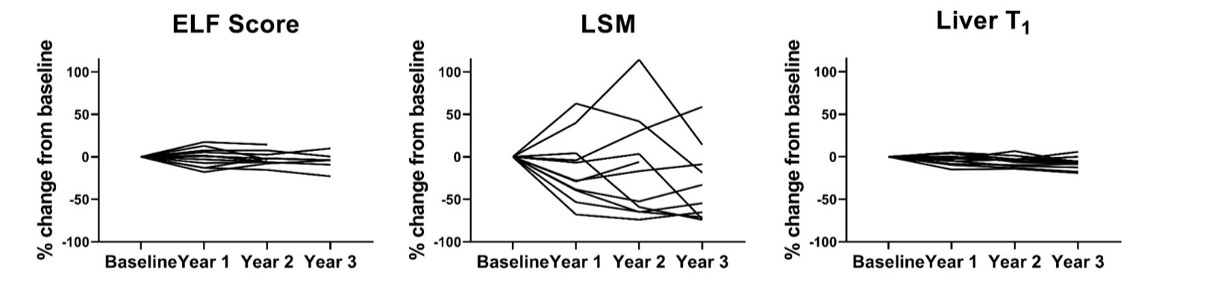
Figure 2A shows the MELD and UKELD scores in the stable CC patients, with no significant change from baseline and hence confirming the stability of the disease process in these patients. Non-invasive biomarkers of FIB4 and APRI scores show more variability than the ELF score, with a large variance observed in LSM. Figure 3 shows the percentage change from baseline in those MRI parameters shown to delineate liver disease (see cross-sectional cohort data in Fig. 1A). Figure 4 shows the year-on-year CoVs for these MRI parameters, and compares with the CoV of healthy volunteers scanned 1 week apart (dashed line). Note the low year-on-year CoV of liver T1 and renal cortex T1 compared to their change with disease severity. Figure 5 shows the individual CC patient measures of ELF, liver T1 and LSM from baseline, small changes observed in the ELF score and liver T1 markers, contrast with a large inconsistent variance in LSM.Discussion
We have shown, in a stable CC cohort, the year-on-year CoV in non-invasive and MRI measures. For MRI measures this CoV is similar to that of repeat measures in healthy volunteers scanned 1-week apart, and has sufficient resolution to track disease progression (as compared to percentage change measured from HV due to disease severity) for liver T1, liver perfusion, SMA flow, spleen perfusion, and renal cortex T1 – measures shown to predict negative liver related outcomes at baseline [1]. This suggests that these measures can be used to monitor longitudinal changes in disease progression or regression and potentially as an endpoint in clinical trials. This work also highlights the large variance in some of the non-invasive tests such as the LSM which emphasises the importance of interpreting any serial change in this test with caution. Here we highlight that without understanding the range of variation in a measure, the change in a marker may be mistakenly attributed to disease progression/regression which in turn could mislead patients and clinicians.Conclusion
This work highlights the markers that are useful for longitudinal disease monitoring or intervention assessment to study liver disease progression.Acknowledgements
We would like to thank the NIHR Nottingham BRC research nurses who conducted patient enrolment and performed clinical measures.References
1. Bradley CR, Cox EF, Scott RA, James MW, Kaye P, Aithal GP, Francis ST, Guha IN. Multi-organ assessment of compensated cirrhosis patients using quantitative magnetic resonance imaging. J Hepatol. 2018 Nov;69(5):1015-1024
2. Hoad CL, Palaniyappan N, Kaye P, Chernova Y, James MW, Costigan C, Austin A, Marciani L, Gowland PA, Guha IN, Francis ST, Aithal GP. A study of T1 relaxation time as a measure of liver fibrosis and the influence of confounding histological factors. NMR Biomed. 2015 Jun;28(6):706-14.
3. Cox EF, Buchanan CE, Bradley CR, Prestwich B, Mahmoud H, Taal M, Selby NM, Francis ST. Multiparametric Renal Magnetic Resonance Imaging: Validation, Interventions, and Alterations in Chronic Kidney Disease. Front Physiol. 2017 Sep 14;8:696.
Figures