2493
Effect of spatial resolution on Gradient Echo Magnetic Resonance Elastography at 3T1Sir Peter Mansfield Imaging Centre, University of Nottingham, Nottingham, United Kingdom, 2NIHR Nottingham Biomedical Research Centre, Nottingham University Hospitals NHS Trust and University of Nottingham, Nottingham, United Kingdom
Synopsis
Iron-mediated T2* effects are more prominent in MRE data acquired at 3T compared to 1.5 T, and have been suggested to lead to failure rates of up to 15% for MRE at 3T. MRE based liver stiffness was measured using the QIBA recommendation with a 2D gradient‐recalled‐echo MRE sequence using a 1.5x4.5x10 mm3 acqusition. For comparison, MRE data was also collected at 4.5mm isotropic spatial resolution. A larger voxel volume in the MRE acquisition provided higher SNR which in turn resulted in a higher proportion of voxels being fit for stiffness with confidence >0.95.
Introduction
Magnetic Resonance Elastography (MRE) is becoming an accepted biomarker of liver injury and is being widely adopted for clinical trials using the Quantitative Imaging Biomarker Alliance (QIBA) recommendations. However, higher failure rates of the gradient‐recalled‐echo (GRE) MRE sequences are observed, particularly in patients with fatty liver disease and/or iron overload. The iron-mediated T2* effects are more prominent at 3 T than 1.5 T, and have been suggested to lead to failure rates of up to 15 % for MRE at 3 T [1]. Here we assess the effect of liver T2* and acquired spatial resolution on GRE MRE stiffness maps.Methods
5 healthy volunteers (3M/2F, BMI 23.1 ± 1 kg/m2, age range 24-27 years) and 2 patients with liver disease (both Non-Alcoholic SteatoHepatitis, NASH) (1M/1F, BMI 29.9 ± 4 kg/m2, age range 31 - 51 years) were recruited. Participants attended an MRI scan after an overnight fast. Data was collected on a 3 T Philips Ingenia DDAS scanner (DS Anterior coil + posterior bed coil) to assess liver stiffness as assessed by MRE, liver tissue T2*.Data acquisition:
MRE based liver stiffness was measured using the QIBA recommendation with a 2D GRE MRE sequence (FOV 360x375 mm, voxel 1.5x4.5x10 mm3, TE = 20 ms, TR = 50 ms, 4 axial slices through the liver, slice gap 1 mm, 1 slice acquired per 18 second breath hold) [2]. For comparison, data was also collected at 4.5 mm isotropic spatial resolution with matched FOV, TE/TR and slice positioning. For both acquisitions, the passive acoustic driver (Resoundant, Rochester, MN) was placed against the lower right chest at the level of the xiphoid in the midclavicular line, and continuous vibrations of 60 Hz were applied. Liver T2* maps were collected using multi-echo fast-field echo (mFFE) data acquired at 12 echo times (TE1 = 2.5 ms, ΔTE = 2.5 ms, 9 axial slices, 3x3x8 mm3 voxel).
Data Analysis:
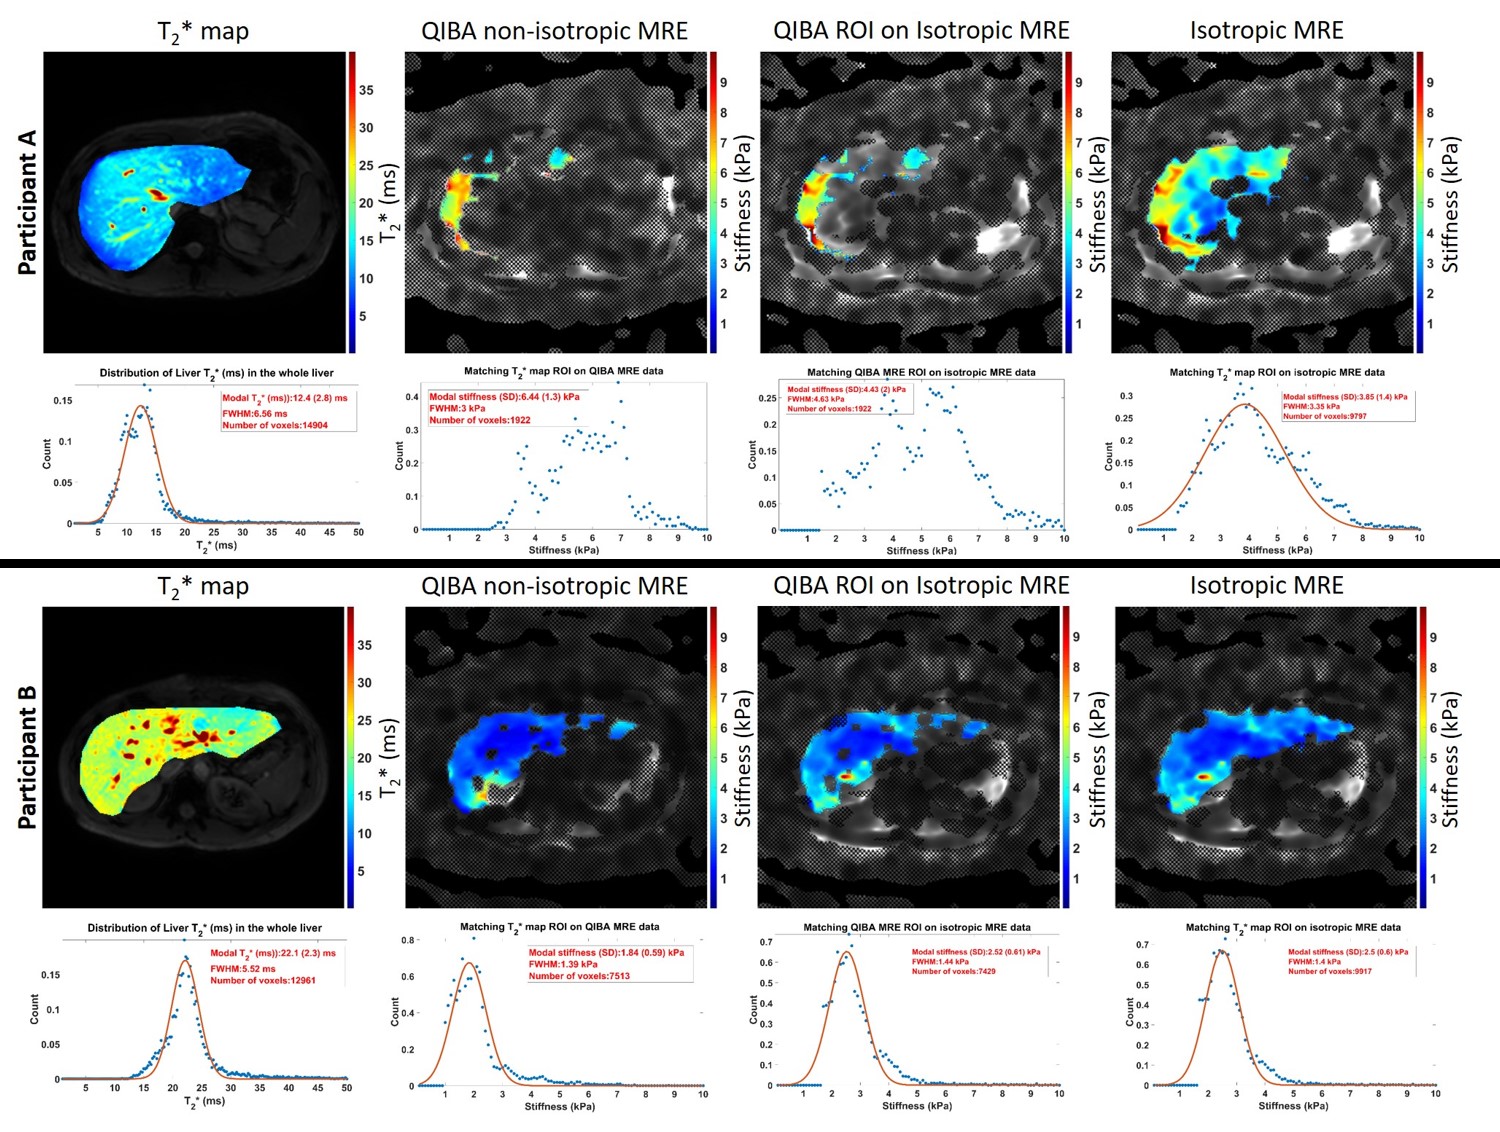
T2*: Manual ROIs were drawn on the scanner computed T2* map images, avoiding large blood vessels, bile ducts, and edges of the liver parenchyma. Histogram analysis was then performed to assess the distribution of T2* within the liver, the mode of the distribution was used to represent tissue T2* and FWHM to assess heterogeneity.
MRE: From the acquired magnitude and phase images, the scanner computed elastograms depicting the spatial distribution of the shear stiffness (ie, magnitude of the complex modulus, |G*|) in kPa, and confidence masks computed from voxels with confidence values >0.95. Data were then reshaped to match the resolution of the T2* maps. Liver stiffness measurements were calculated based on mode values from the elastograms within the intersection of manually drawn ROIs and confidence masks. The percentage of the liver in which a confidence mask was formed was computed. In addition liver stiffness values were computed within each confidence mask for each spatial resolution of MRE data.
Results
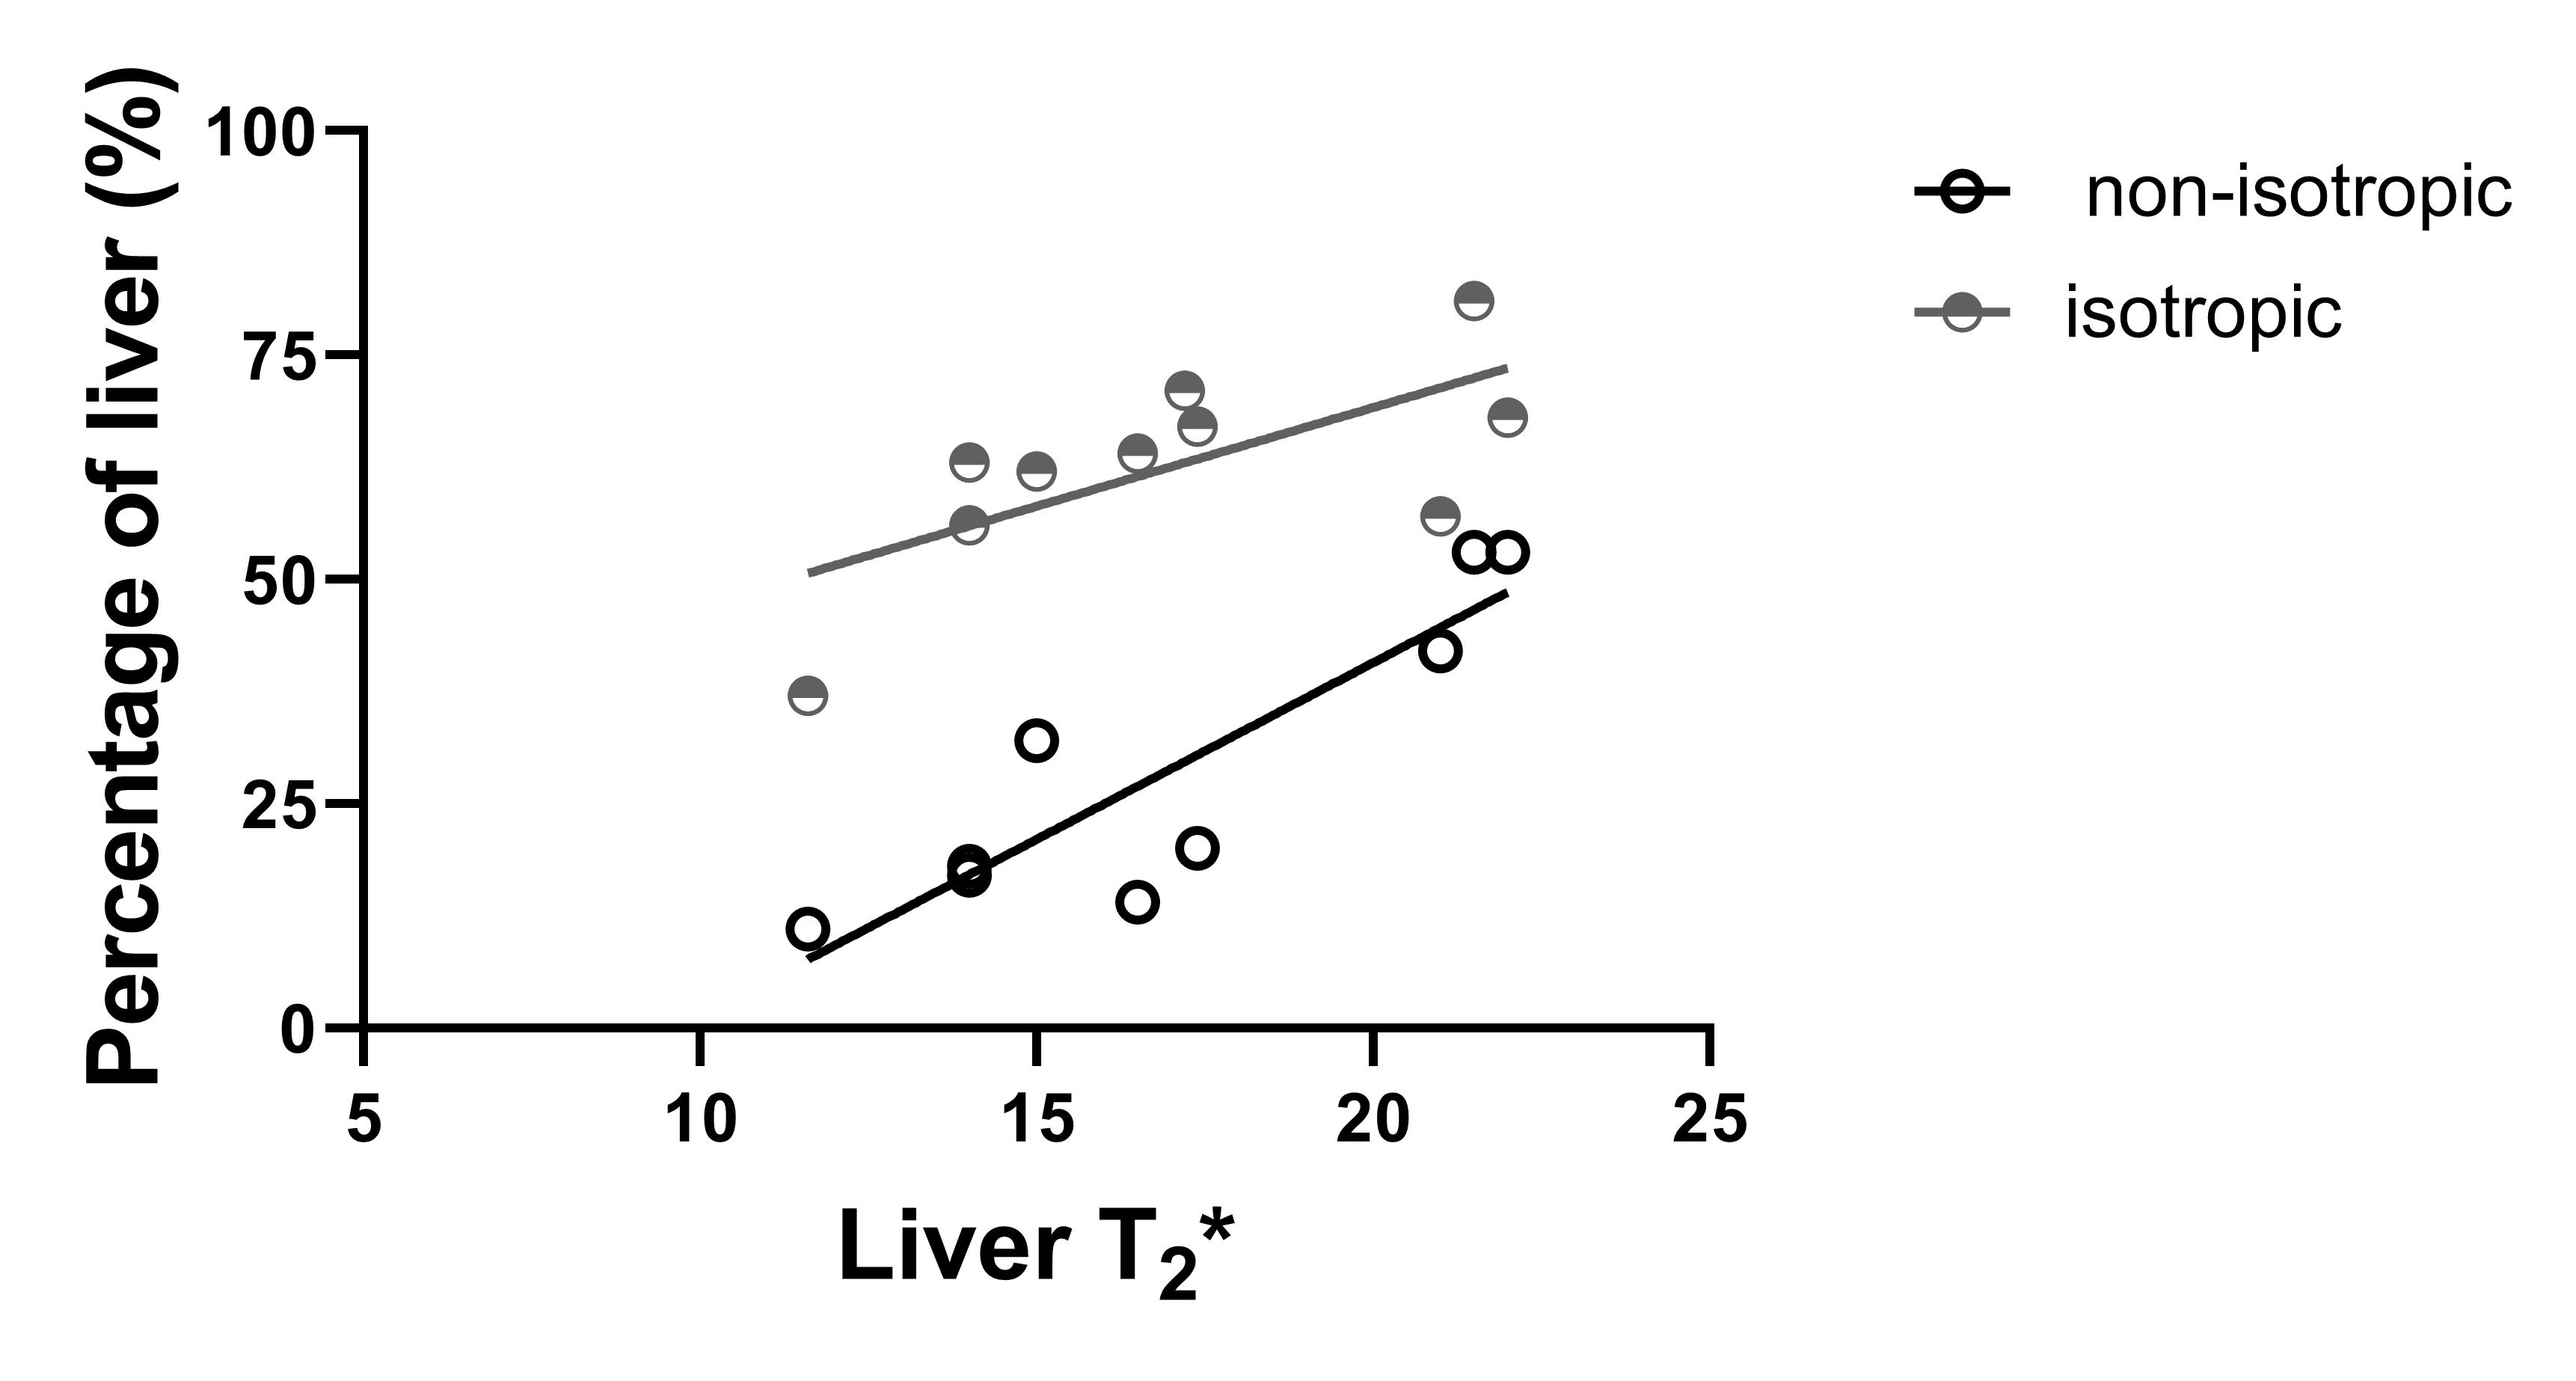
Figure 1 shows example liver stiffness maps computed for the non-isotropic and isotropic resolutions in two participants, one participant with a short T2* (12 ms mode) and one with a longer T2* (22 ms mode). For shorter liver T2* values, the percentage of the liver fit as defined by the confidence map is reduced when using the non-isotropic GRE-MRE protocol compared with the isotropic protocol, Fig. 2. Mean liver stiffness for the non-isotropic GRE-MRE protocol was 2.4 ± 2 kPa and 1.9 ± 1.4 kPa for the isotropic protocol.Discussion
Participants who have shorter liver T2* associated with higher iron content within the liver tissue, have a smaller percentage of the liver which fits with confidence (confidence >0.95), Fig. 2. The GRE acquisition is limited to a TE of 20 ms as the MRE motion encoding gradient frequency is set to match the mechanical driving frequency of 60 Hz. As a result, signal-to-noise ratio is limited in participants with a shorter liver T2* as rapid dephasing of the signal occurs during the echo time. We show that by choosing an isotropic resolution with larger voxel volume (91.1 ml isotropic compared to 67.5 ml for the non-isotropic QIBA recommendation), the goodness of fit in the stiffness maps is improved, and not dependent on the T2* of the liver, allowing successful spatial mapping of stiffness over a larger area of the liver (Fig. 2).Conclusion
Using a isotropic voxel size with larger volume as compared to the QIBA recommendation for the GRE MRE acquisition provides a higher SNR which in turn results in a higher proportion of voxels being fit for stiffness with confidence >0.95 within the liver tissue.Acknowledgements
We would like to thank the NIHR Nottingham BRC research nurses who conducted patient enrolmentReferences
1. Dong Wook Kim, So Yeon Kim, Hee Mang Yoon, Kyung Won Kim and Jae Ho Byun. Comparison of technical failure of MR elastography for measuring liver stiffness between gradient‐recalled echo and spin‐echo echo‐planar imaging: A systematic review and meta‐analysis. J Magn Reson Imaging. 2019 Aug 27.
2. QIBA MR Elastography of the Liver Biomarker Committee. Magnetic Resonance Elastography of the Liver. Profile Stage: Consensus. QIBA, May 2, 2018. Available from: http://qibawiki.rsna.org/index.php/Profiles
Figures