2492
Diffusion Kurtosis Imaging Quantification of Liver Microscopic Changes in Rats Following Partial Hepatectomy at Different Proportions1Tianjin First Center Hospital, Tianjin, China, 2MR Collaboration, Siemens Healthcare Ltd, Beijing, China, 3Siemens Healthcare GmbH, Erlangen, Germany
Synopsis
In this study, we used DKI to quantify the microscopic changes of residual liver in two groups of rats with different proportions of a partial hepatectomy (PH). All the rats underwent DWI to acquire DKI data at baseline and multiple time points after surgery. The results showed that DKI-derived MD in the 70% PH group were lower than in the 30% PH group at all time points after surgery. MD decreased to a minimum by the fifth day before rising back to baseline. This suggests that DKI is a practical technique for the timely evaluation of the liver regeneration process.
Introduction/purpose
Partial hepatectomy (PH) is an essential treatment for patients with liver malignancies such as hepatocellular carcinoma or liver metastases.[1] Depending on the status of the patients, the clinician will resect different portions of the liver . The degree of liver regeneration is a key factor affecting the success of surgery and the prognosis. Currently, the degree of liver regeneration is widely estimated using CT to measure the liver volume, but this ionizing method has obvious lag that cannot reflect the actual status of the remaining liver in time. As a non-invasive imaging method, magnetic resonance imaging (MRI), other than providing the biological morphology, also produces functional information. The longitudinal and transverse relaxation time, apparent diffusion coefficient (ADC), and magnetization transfer ratio (MTR) have been reported to be beneficial for the evaluation of liver regeneration [2,3,4,5]. Diffusion kurtosis imaging (DKI) is an emerging diffusion-weighted imaging technique that is analyzed based on a non-Gaussian model. Compared with conventional DWI, DKI is sensitive to tissue microstructure and conducive to reflecting the actual situation in the tissue [6]. Therefore, we hypothesized that DKI of the remnant liver might reflect the degree of liver regeneration. We could then elucidate the relationship between DKI of the remnant liver and the degree of liver regeneration in rats.Methods
In total, 22 male Sprague-Dawley rats (aged 7-8 weeks, 250 ± 30g in weight) were studied. The rats were divided into two equal groups based on different proportions of a completed partial hepatectomy (70% PH and 30% PH, respectively). The different liver lobes were surgically resected under isoflurane anesthesia with different proportions of a residual rat liver model and were examined immediately by MRI. MRI examinations were performed at baseline, and at days 1, 2, 3, 5, 7, 14, and 21 after PH. All the MRI data were collected on a MAGNETOM Prisma 3T MR scanner (Siemens Healthcare, Erlangen, Germany) with a dedicated 8-channel animal coil (Chenguang, Shanghai, China). A single-shot echo-planar imaging DWI sequence was used to acquire DKI data. The parameters were as follows: repetition time (TR) = 800 ms, echo time (TE) = 57 ms, field of view (FOV) = 120 x 98 mm2, slice thickness = 3 mm, and matrix = 120 x 98. Five b-values of 0, 500, 1000, 1500, and 2000 s/mm2 were obtained in three diffusion gradient directions. Post-processing of the diffusion-weighted images was analyzed using a prototype software (MR Body Diffusion Toolbox, Siemens Healthcare, Erlangen, Germany). The parameters (MD and MK values, MK: mean kurtosis) of DKI in the two groups were obtained and subsequently compared between the two groups by Student’s t-test using SPSS (IBM Corp., Armonk/NY, USA).Results
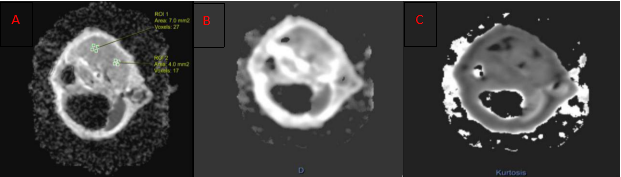
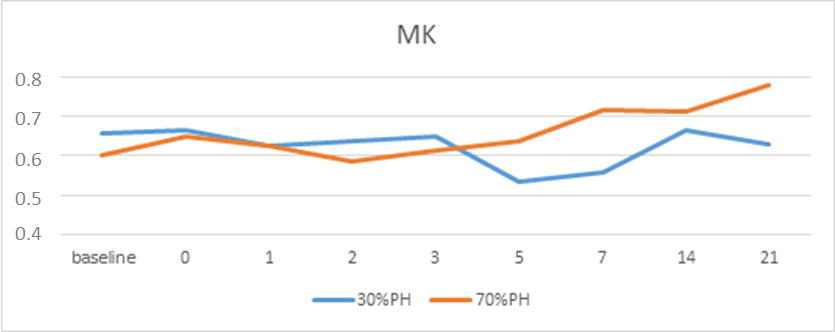
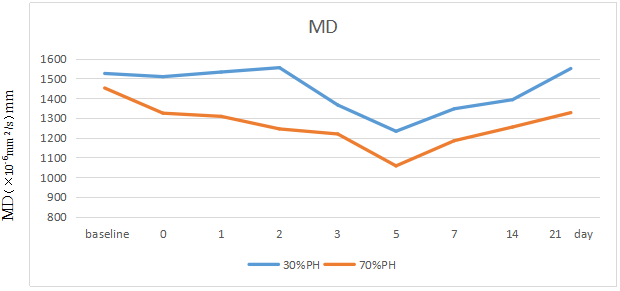
Typical MD and MK parametric maps in a rat with 70% PH on the first day after surgery are shown in Fig 1. Tables 1 and 2 show the changes of the parameters (MD and MK) of the two groups, respectively. Initially, the MD value decreased gradually until it reached a minimum on the fifth day; in the following days, the MD gradually increased and returned to baseline. The MK value over time showed no clear pattern but a trend of an initial decrease before a gradual increase was noted. Table 3 shows the comparison between the two DKI-derived parameters (MD and MK) of the two groups at eight time points. The MD of the 30% PH group appeared higher than that of the 70% PH group at all time points, although statistically significant values were reached only for day 0 (P < 0.05). The MK value was significantly different between the two groups only by the seventh day (P < 0.05).Discussion/conclusion
We found that both the DKI parameters MD and MK changed after PH. The results showed that the MD values in both groups decreased to a minimum by the fifth day. It has been reported that liver growth reaches a plateau on day 5 before gradually declining after hepatectomy in rats.[2] This consistency implicates the practical application of DKI in the timely evaluation of the process of liver regeneration. In conclusion, this study suggests the potential use of DKI for the evaluation of the liver regeneration process.Acknowledgements
No acknowledgement found.References
1. Clavien PA, Oberkofler CE, Raptis DA, Lehmann K, Rickenbacher A, El-Badry AM. What is critical for liver surgery and partial liver transplantation: size or quality? Hepatology. 2010; 52(2):715–29.
2.Hockings Paul D, Roberts Toby, Campbell Simon P, et al. Longitudinal magnetic resonance imaging quantitation of rat liver regeneration after partial hepatectomy[J]. Toxicol Pathol. 2002;30(5):606-610.
3. Le Bihan D. Apparent diffusion coefficient and beyond: what diffusion MR imaging can tell us about tissue structure[J]. Radiology. 2013;268(2):318-322.
4. Eberhardt Christian, Wurnig Moritz C, Wirsching Andrea, et al. Prediction of small for size syndrome after extended hepatectomy: Tissue characterization by relaxometry, diffusion weighted magnetic resonance imaging and magnetization transfer[J]. PLoS One. 2018;13(2):e0192847.
5. Sheng Ruo-Fan, Jin Kai-Pu, Yang Li, et al. Histogram Analysis of Diffusion Kurtosis Magnetic Resonance Imaging for Diagnosis of Hepatic Fibrosis[J]. Korean J Radiol. 2018;19(5):916-922.
6. Patrizio G, Pietroletti R, Pavone P, et al. An animal model for the study of liver regeneration by magnetic resonance imaging[J]. La Radiologia medica. 1990; 79(5):453-457.
Figures