2491
Comparative study of T1ρ and Gd-EOB-DTPA-enhanced T1mapping with extracellular volume fraction in assessment of liver fibrosis in rabbit model1Third Affiliated Hospital of Soochow University & First People's Hospital of Changzhou., changzhou, China, 2Clinical Science,Philips Healthcare, shanghai, China
Synopsis
This study aimed to compare the diagnostic performance for liver fibrosis staging of T1ρ and Gd-EOB-DTPA-enhanced T1mapping with extracellular volume fraction measurement in CCL4 rabbit model. Result showed that T1ρ performed better diagnostic performance and correlation with LF and fibrosis percentage of postive staining(%) than T1native.
Purpose
To compare the diagnostic efficacy of T1ρ value with Gd-EOB-DTPA-enhanced T1mapping by extracellular volume fraction in staging liver fibrosis (LF).Materials and Methods
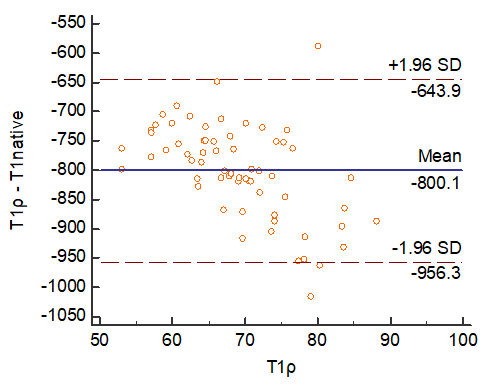
Sixty-four New Zealand white rabbits were included in this study, among which 55 rabbits were randomly injected with 4 weeks, 8 weeks, 12 weeks and 16 weeks CCl4 50% oil solution, whereas 9 rabbits served as the control group were given normal saline. For T1ρ imaging, a rotary echo spin-lock pulse was implemented in a 3D turbo field echo (TFE) sequence. Spin-lock frequency was set to 500 Hz, and the spin-lock times (TSL) of 1, 10, 20, 40, and 50 ms were used for T1ρ mapping. ECV values derived from T1mapping is calculated from the ratio of change in hepatic T1 relative to blood pool pre- and postcontrast T1. After T1mapping and T1ρ MRI scan, liver tissue around gallbladder (corresponding with paraffin-embeded samples of rabbit liver) were evaluated LF stages (F0-F4) and fibrosis percentage (FP) by masson staining was measured by pathologic image postprocessing. Liver T1ρ values, T1mapping native values, T1mapping values after Gd-EOB-DTPA 8 minutes and 20 minutes, and ECV derived from the T1mapping corrected by artery were measured respectively. Intra- and inter-observer agreement for all liver quantitative parameters (T1mapping relevent parameters and T1ρ values) were evaluated by using the intraclass correlation coeffcient (ICC) and statistical analysis including Bland–Altman (BA) comparison were performed. Correlations between MRI quantitative parameters and the LF stage, and FP were performed. Diagnostic performance in evaluating liver fibrosis stages was assessed and compared using receiver-operating characteristic analysis.Results
The number of rabbits in each LF stage was 9, 19, 12, 17 and 7 for F0-F4, respectively. Data were collected on a Philips 3.0T MR scanner(Philips Healthcare,Ingenia,Netherlands). A normal distribution of our data was performed using the normality test and distribution curve. Excellent intra- and inter-observer agreements of all quantitative parameters were demonstrated. Both T1native and liver T1ρ value increased as LF=F1-F3 increased but decreased when LF=F4 (F = 5.096,13.915 ,all P<0.001). T1native and liver T1ρ value displayed a moderate correlation with LF (r =0.479,0.650, P<0.001), and liver T1ρ value displayed higher correlation with FP(0.723, P<0.001) but lower correlation between T1native and FP(0.355, P<0.001); T18min, T120min ECV8min,ECV20min did not achieve statistical significance for LF (P = 0.868 and 0.171). Compared with T1native, the liver T1ρ value revealed better diagnostic efficacy in staging LF by masson score ≥ F1, ≥ F2, and ≥ F3 ( AUC 0.966 vs0.825, 0.808 vs 0.778, 0.857 vs 0.738 respectively ,all P<0.001),wheras no matter T1native or liver T1ρ value was not statistically significant in staging LF=F4 through ROC analysis (P=0.6160,0.1079).Discussion
Past experimental animal study showed that T1mapping-derived ECV has the potential to quantify experimental and possibly also human liver fibrosis [1]and ECV can minimizes systematic errors in image acquisition and enables better comparison of images at different points such as 10-min HBP and 20-min HBP T1 mapping after Gd-EOB-DTPA enhancement[2]. The liver collagen content (the major component of the extracellular matrix) is correlated with the degree of elevation of the T1ρ measurements, indicating that liver T1ρ quantification may play an important role for liver fibrosis diagnosis and staging[3]. To our knowledge, this is the first study that provides a head-to-head comparison of T1mapping and T1ρ that both reflect extracellular volume.We observed a moderate correlation between the T1ρ value, T1native, and the degree of fibrosis in a rabbit model of CCl4-induced liver fibrosis. Additionally, T1ρ imaging demonstrated good diagnostic performance for liver fibrosis staging better than T1native.But T18min T120min ECV8min, ECV20min did not achieve statistical significance for LF. The major reason may be the select error of the transversal maps of abdominal aorta ,then ECV values were normalized for hematocrit and calculated from pre- and postcontrast T1 values.Conclusion
T1native and liver T1ρ value, with excellent intra- and inter-observer agreements, were correlated with the LF stage and FP in CCl4-induced rabbits. More specifically, liver T1ρ value was superior to T1native for LF staging(F1-F3) but F4.Key Words
Liver fibrosis, T1ρ, Gd-EOB-DTPA, T1mapping, extracellular volume fractionAcknowledgements
This study was approved by the local Institutional Animal Care and Use Committee.References
[1] J. A. Luetkens et al., “Quantification of Liver Fibrosis at T1 and T2 Mapping with Extracellular Volume Fraction MRI: Preclinical Results,” Radiology, vol. 288, no. 3, pp. 748–754, Sep. 2018.
[2] Z.-P. Zhou, L.-L. Long, L.-J. Huang, T.-F. Yang, and Z.-K. Huang, “Gd-EOB-DTPA-enhanced MRI T1 mapping for assessment of liver function in rabbit fibrosis model: comparison of hepatobiliary phase images obtained at 10 and 20 min,” Radiol. Med. (Torino), vol. 122, no. 4, pp. 239–247, Apr. 2017.
[3] R. Li et al., “Liver fibrosis detection and staging: a comparative study of T1ρ MR imaging and 2D real-time shear-wave elastography,” Abdom. Radiol., vol. 43, no. 7, pp. 1713–1722, Jul. 2018.
Figures