2489
Quantitative Assessment of Liver Function by Using T1mapping based on Gadoxetic Acid–enhanced MRI1the Third People’s Hospital of Nantong, Nantong, China, 2Philips Healthcare, Shanghai, China
Synopsis
The purpose of this study was to investigate whether liver function as determined by indocyanine green (ICG) clearance can be estimated quantitatively from magnetic resonance T1mapping with Gd-EOB-DTPA. We used Look-Locker sequences to acquire T1 mapping images pre and post-contrast at 5, 10, 15 and 20 minutes after Gd-EOB-DTPA administration, T1 relaxation times of the liver were measured, reduction rates of T1 relaxation times were calculated, our study showed that Gd-EOB-DTPA-enhanced T1mapping MRI is helpful for the quantitative evaluation of liver function, T1 relaxation time post-contrast at 20 minutes was the independent factor to predict ICG R15>20%.
INTRODUCTION
The precise assessment of liver function can provide clinical physicians with valuable instructions to carry out exact treatment on patients with best prognosis. Gadolinium ethoxybenzyl diethylenetriamine pentaacetic acid (Gd-EOB-DTPA) is a novel magnetic resonance imaging (MRI) contrast agent which can be used both non-specificallyfor extracellular space and specifically for hepatocytes, uptake and metabolism of Gd-EOB-DTPA is related to hepatocyte function. The aim of this study was to investigate whether liver function as determined by indocyanine green (ICG) clearance can be estimated quantitatively from magnetic resonance T1mapping with Gd-EOB-DTPA.PURPOSE
To investigate whether liver function as determined by indocyanine green (ICG) clearance can be estimated quantitatively from magnetic resonance T1mapping with Gd-EOB-DTPA.METHODS
This retrospective study included 65 patients with chronic viral hepatitis B, and divided into two subgroups by using the indocyanine green retention test (ICG R15) as follows: 44 patients with ICG R15≤20% and 21 patients with ICG R15>20%. All patients were performed non-enhanced and Gd-EOB-DTPA enhanced MRI of liver. Look-Locker sequences with exactly the same scan parameters and geometry position (the level of porta hepatis) were performed pre and post-contrast separately at 5, 10, 15 and 20 minutes after Gd-EOB-DTPA administration. T1 relaxation times and reduction rates of T1 relaxation times (ΔT1) of the liver were measured and calculated. Independent samples t test was performed to compare T1 relaxation times and ΔT1 for ICG R15≤20% and ICG R15>20% groups. ROC analyses were done to differentiate the diagnostic performance of T1 relaxation times and ΔT1 between ICG R15≤20% and ICG R15>20% groups. Pearson correlation analysis was used to analysis the correction between T1 relaxation times, ΔT1 and ICG R15. Logistic regression analysis was used to evaluate the relationship between ICG R15 and the influenced factors.RESULTS
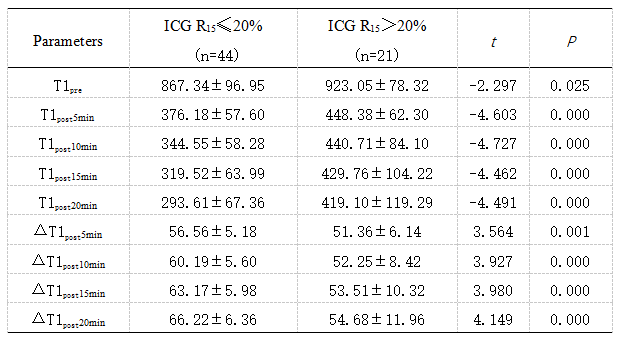
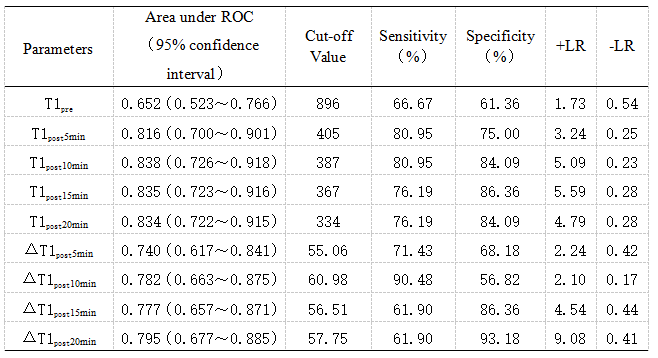
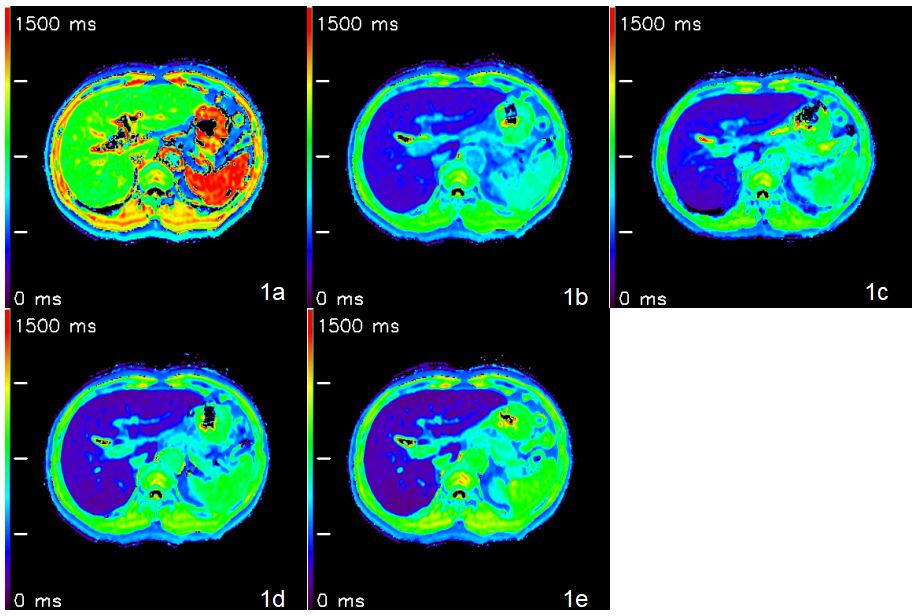
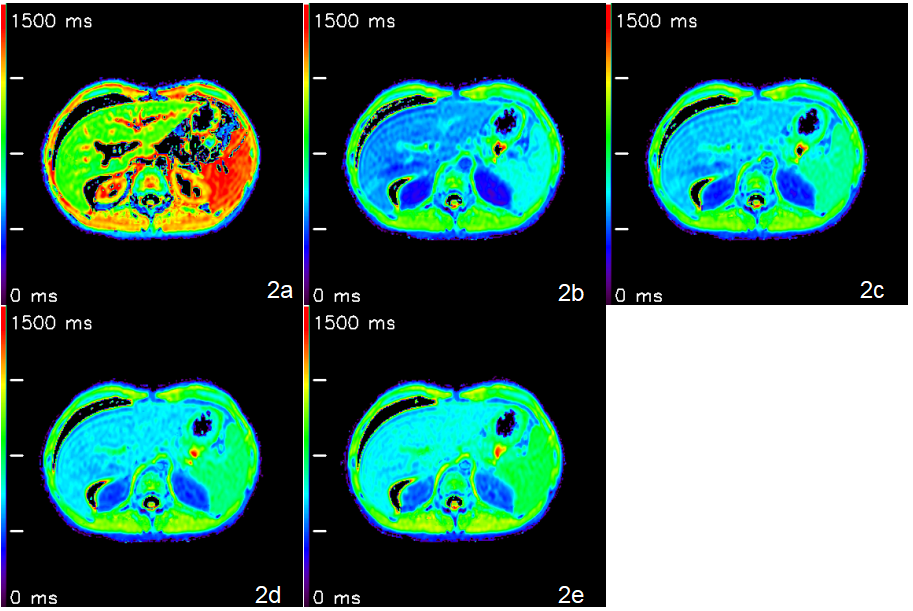
Liver T1 relaxation times and ΔT1 of ICG R15≤20% and ICG R15>20% groups were shown in table 1 (Fig.1-2).Diagnostic performance for T1 relaxation times and ΔT1 in assessing ICG R15>20% groups by ROC analyses were shown in table 2.
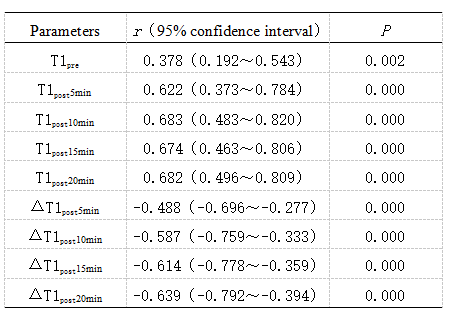
Correlation between T1 relaxation times, ΔT1 and ICG R15 were shown in table 3.
Logistic regression analysis showed that T1 relaxation time post-contrast at 20 minutes was the independent factor to predict ICG R15>20% , B=0.016, OR=1.016(1.007~1.025), P<0.05.
DISCUSSION
Liver function can be evaluated by using T1 relaxation time of the liver parenchyma before and after Gd-EOB-DTPA enhancement1-3. In our study, T1 relaxation times of ICG R15≤20% and ICG R15>20% groups reduced with the scanning time increasing and ΔT1 decreased, T1 relaxation times pre and post-contrast at 5, 10, 15 and 20 minutes of ICG R15>20% group were significantly higher than those of ICG R15≤20%, ΔT1 post-contrast at 5, 10, 15 and 20 minutes of ICG R15>20% group were significantly lower than those of ICG R15≤20%, due to that hepatitis or cirrhosis can give rise to decreased expression of organic anion transporter polypeptide 1 (OATP1) on the surface of hepatocytes and up-regulation of multidrug resistance proteins 2 (MRP2), thereby reducing the uptake of Gd-EOB-DTPA while promoting its excretion from hepatocytes4-7. Our study showed that the areas under ROC curve of T1 relaxation time pre and post-contrast at 5, 10, 15 and 20 minutes for assessment ICG R15>20% were 0.652, 0.816, 0.838, 0.835, and 0.834, respectively, the correction coefficients between T1 relaxation time and ICG R15 were 0.378, 0.622, 0.683, 0.674 and 0.682, respectively, the areas under ROC curve of ΔT1 post-contrast at 5, 10, 15 and 20 minutes for evaluation ICG R15>20% were 0.740, 0.782, 0.777 and 0.795, respectively, the correction coefficients between ΔT1 and ICG R15 were -0.488, -0.587, -0.614 and -0.639, respectively, T1 relaxation time post-contrast at 20 minutes was the independent factor to predict ICG R15>20%.CONCLUSIONS
Gd-EOB-DTPA -enhanced T1mapping MRI is helpful for the quantitative evaluation of liver function, T1 relaxation time post-contrast at 20 minutes was the independent factor to predict ICG R15>20%.Acknowledgements
No acknowledgement found.References
[1] Besa C, Bane O, Jajamovich G, et al. 3D T1 relaxometry pre and post gadoxetic acid injection for the assessment of liver cirrhosis and liver function[J]. Magn Reson Imaging, 2015, 33(9): 1075-1082.
[2] Yoon JH, Lee JM, Kim E, et al. Quantitative liver function analysis: volumetric T1 mapping with fast multisection B1 inhomogeneity correction in hepatocyte-specific contrast-enhanced liver MR imaging[J]. Radiology, 2017, 282(2): 408-417.
[3] Haimerl M, Schlabeck M, Verloh N, et al. Volume-assisted estimation of liver function based on Gd-EOB-DTPA-enhanced MR relaxometry[J]. Eur Radiol, 2016, 26(4): 1125-1133.
[4] Nakagawa M, Namimoto T, Shimizu K, et al. Measuring hepatic functional reserve using T1 mapping of Gd-EOB-DTPA enhanced 3T MR imaging: A preliminary study comparing with 99mTc GSA scintigraphy and signal intensity based parameters[J]. Eur J Radiol, 2017, 92: 116-123.
[5] Wang L, Collins C, Kelly EJ, et al. Transporter expression in liver tissue from subjects with alcoholic or hepatitis C cirrhosis quantified by targeted quantitative proteomics[J]. Drug Metab Dispos, 2016, 44(11): 1752–1758.
[6] Ba-Ssalamah A, Bastati N, Wibmer A, et al. Hepatic gadoxetic acid uptake as a measure of diffuse liver disease: Where are we? [J]. J Magn Reson Imaging, 2017, 45(3): 646-659.
[7] Tsuda N, Matsui O. Cirrhotic rat liver: reference to transporter activity and morphologic changes in bile canaliculi--gadoxetic acid-enhanced MR imaging[J]. Radiology. 2010, 256(3): 767-773.
Figures