2488
A unified model for hepatobiliary transporter function assessment using Gadoxetate DCE-MRI
Sirisha Tadimalla1,2 and Steven Sourbron2,3
1Institute of Medical Physics, University of Sydney, Sydney, Australia, 2Department of Biomedical Imaging Sciences, University of Leeds, Leeds, United Kingdom, 3Department of Infection, Immunity and Cardiovascular Disease, University of Sheffield, Sheffield, United Kingdom
1Institute of Medical Physics, University of Sydney, Sydney, Australia, 2Department of Biomedical Imaging Sciences, University of Leeds, Leeds, United Kingdom, 3Department of Infection, Immunity and Cardiovascular Disease, University of Sheffield, Sheffield, United Kingdom
Synopsis
A variety of models for Gadoxetate DCE-MRI in the liver has been proposed, but comparing results of different groups is difficult due to a lack of consistency in the definitions, nomenclature and units. We perform a rigorous classification of existing models and definitions by defining a general unified Gadoxetate DCE-MRI liver model, and identifying the relationship with existing models. Six distinct models were identified in the literature and a translation table was derived to allow direct comparison of measured quantities. The method provides a rational basis for a new standard in this field.
Introduction
There is increasing interest in the use of Gadoxetate DCE-MRI for the assessment of hepatocellular function, for example, in chronic liver disease1,2 and drug-induced liver injury.3,4 Quantitative metrics such as the rates of uptake and excretion of Gadoxetate by hepatocytes provide a direct measurement of function and can be obtained by kinetic model fitting. A variety of models have been proposed1-4,7-10 but direct comparison of results by different groups is not currently possible due to a lack of consistency in the definitions, nomenclature and units of physiologically equivalent kinetic parameters, as well as the assumptions made in deriving them. The purpose of this work was to (i) propose a transparent, unified framework for pharmacokinetic modelling of Gadoxetate kinetics in the liver, and (ii) use this model to derive relationships between the various parameters in current literature.Methods
The dual-inlet three-compartment Gadoxetate DCE-MRI model (Fig.1) is defined by ten independent parameters (arterial and venous plasma flows FA and FV, biliary flow FB, Extracellular volume VE, Hepatocyte volume VH, Intrahepatic bile duct volume VB, total tissue volume V, Hepatocyte uptake rate KHE, sinusoidal back-flux KEH and biliary excretion rate KBH). All volumes, flows and transport rate constants are defined in absolute units of mL, mL/min and mL/min, respectively. Linear kinetics of hepatobiliary uptake, back-flux and excretion are assumed. ca(t) and cv(t) represent concentrations of the contrast agent in the hepatic artery and portal vein. Absolute amounts of the contrast agent in the extracellular, hepatocyte and intra-hepatic bile duct compartments are denoted by NE, NH and NB, respectively in units of mmols. The dashed arrows indicate fluxes that do not transport the contrast agent.The system is defined mathematically by expressing indicator mass conservation in each compartment, leading to Eqns. (1-3).
$$\frac{dN_E}{dt}=F_Ac_a(t)+F_Vc_v(t)-(K_{HE}+F_A+F_V-F_B)\frac{N_E(t)}{V_E}+K_{EH}\frac{N_H(t)}{V_H}$$ (1)
$$\frac{dN_H}{dt}=K_{HE}\frac{N_E(t)}{V_E}-(K_{BH}+K_{EH})\frac{N_H(t)}{V_H}$$ (2)
$$\frac{dN_B}{dt}=K_{BH}\frac{N_H(t)}{V_H}-F_B\frac{N_B(t)}{V_B}$$ (3)
The equations were solved using different assumptions to derive six literature models (I-VI).
- Models I-III are animal liver models and assume mean transit time in extracellular space = 0.
- Model I (Giraudeau et al.1) bears similarity to radio-tracer kinetic models 5,6 and consists of three compartments, a single-inlet and steady state concentrations in the intrahepatic bile compartment.
- Models II (Georgiou et al.7) and III (Ulloa et al.3 and Karageorgis et al.4) consists of two compartments, assuming a negligible biliary compartment, no sinusoidal back-flux and a single-inlet (Models III and IV).
- Models IV-V (Georgiou et al.8 and Sourbron et al.9) are two-compartment human liver models, assuming a negligible biliary compartment, negligible sinusoidal back-flux, and in the case of Model V, negligible biliary excretion.
- Model VI (Forsgren et al.10) is a three-compartment human liver model, with a separate plasma and extracellular-extravascular compartment and no biliary compartment.
Results
Table 1 presents tissue composition and kinetic parameters derived from the unified model. Mathematical relationships between physiologically equivalent parameters in models I-VI from literature are presented. Arterial and venous flow fractions cannot be measured in models where extracellular mean transit time is assumed 0 (Models I-III and VI). Compartmental volume fractions were not defined for Model I and are indicated as undefined in the table. They need to be measured or assumed in order to directly relate model parameters to the unified model.Table 2 presents Gadoxetate uptake and excretion rates in healthy, male Han-Wistar rats as reported in 1,3,4, before and after conversion to the proposed standard definition, nomenclature and units. Uptake and excretion rates were both orders of magnitude different between the studies prior to correction. The correction included removal of absolute units and a scaling factor of 1000 in results from 3,4, possibly introduced during model-fitting in these studies.11 Excretion rates reported in 1 (Model I) could not be corrected due to mathematical errors in the model definition. In the publication, the tissue response function was derived as given in Eqn. 4, and modified to include fixed volume fractions with an assumption that $$$k_3=k_{32}$$$ to obtain Eqn. 5.
$$h(t)=k_{21}-\frac{k_{21}k_{32}}{k_{32}+k_{12}-k_3}e^{-(k_{32}+k_{12})t}+\frac{k_{21}k_{32}}{k_{32}+k_{12}-k_3}e^{-k_3t}$$ (4)
$$h(t)=0.99k_{21}\left(1-\frac{k_{21}k_{32}}{k_{12}}\right)e^{-(k_{32}+k_{12})t}+0.01\frac{k_{21}k_{32}}{k_{12}}e^{-k_{32}t}$$ (5)
Under the same assumptions, an equivalent tissue response function derived from the unified model is shown in Eqn. 6. Applying the model parameter conversions given in Table 1, we obtain Eqn. 7, which is comparable to Eqn. 4, correcting for the missing parentheses for the first exponential term.
$$h(t)=k_{he}\left(1-\frac{k_{bh}}{v_h\left(\frac{k_{bh}+k_{eh}}{v_h}-\frac{k_{bh}}{v_b}\right)}\right)e^{-\left(\frac{k_{bh}+k_{eh}}{v_h}\right)t}+\frac{k_{bh}k_{he}}{v_h\left(\frac{k_{bh}+k_{eh}}{v_h}-\frac{k_{bh}}{v_b}\right)}e^{-\frac{k_{bh}}{v_b}t}$$ (6)
$$h(t)=k_{21}\left(1-\frac{k_{32}}{k_{32}+k_{12}-k_3}\right)e^{-\left(k_{32}+k_{12}\right)t}+\frac{k_{21}k_{32}}{k_{32}+k_{12}-k_3}e^{-k_3t}$$ (7)
As the kinetic parameters are already scaled by the compartmental volume fractions, equivalence with Eqn. 5 cannot be achieved.
Discussion
Comparison of Gadoxetate uptake and excretion rates in literature shows clear variability in the definitions of tissue kinetic parameters. In several cases, kinetic parameters are scaled by compartmental volume fractions (Models I, III and VI). As these parameters are often reported in inverse time units, contributions of these scaling factors are not usually explicit. Comparisons of kinetic parameters between different studies must therefore be performed with appropriately applied corrections.Conclusion
The analysis identified clear relationships between published parameters that allows for the first time a direct comparison of literature results in Gadoxetate DCE-MRI. The proposed unified Gadoxetate DCE-MRI model can form the basis for a standard in nomenclature, definitions and units for quantification of hepatocellular function using DCE-MRI.Acknowledgements
This work is funded by Innovative Medicines Initiative 2 Joint Undertaking, Grant Agreement number 116106. This joint undertaking receives support from the European Union’s Horizon 2020 research and innovation programme and EFPIA.References
- Giraudeau C, Leporq B, Doblas S, et al. Gadoxetate-enhanced MR imaging and compartmental modelling to assess hepatocyte bidirectional transport function in ratswith advanced liver fibrosis. Eur Radiol. 2017;27:1804-1811.
- Leporq B, Daire J-L, Pastor CM, et al. Quantification of hepatic perfusion and hepatocyte function with dynamic gadoxetic acid-enhanced MRI in patients with chronic liver disease. Clin Sci (Lond). 2018;132:813-824.
- Ulloa JL, Stahl S, Yates J, et al. Assessment of Gadoxetate DCE-MRI as a biomarker of hepatobiliary transporter inhibition. NMR Biomed. 2013;26:1258-1270.
- Karageorgis A, Lenhard SC, Yerby B, et al. A multi-center preclinical study of gadoxetate DCE-MRI in rats as a biomarker of drug induced inhibition of liver transporter function. PLoS ONE 2018;13(5): e0197213.
- Gambhir SS, Hawkins RA, Huang S-C, et al. Tracer kinetic modelling approaches for the quantification of hepatic function with Technitium-99m DISIDA and scintigraphy. J Nucl Med. 1989;30:1507-1518.
- Hepatobiliary kinetics of Technitium-99m-IDA analogs: Quantification by linear systems theory. J Nucl Med. 1996;37:1323-1330.
- Georgiou L, Penny J, Nicholls G, et al. Modeling Gadoxetate liver uptake and efflux using dynamic contrast-enhanced magnetic resonance imaging enables preclinical quantification of transporter drug-drug interactions. Invest Radiol. 2018;53(9):563-570.
- Georgiou L, Penny J, Nicholls G, et al. Quantitative assessment of liver function using Gadoxetate-enhanced magnetic resonance imaging: Monitoring transporter-mediated processes in healthy volunteers. Invest Radiol. 2017;52(2):111-119.
- Sourbron S, Sommer WH, Reiser MF, et al. Combined quantification of liver perfusion and function with dynamic Gadoxetic acid–enhanced MR imaging. Radiology 2012;263(3):874-883.
- Forsgren MF, Leinhard OD, Dahlstrom N, et al. Physiologically realistic and validated mathematical liver model reveals hepatobiliary transfer rates for Gd-EOB-DTPA using human DCE-MRI data. PLoS ONE 2014;9(4):e95700.
- Forsgren MF. A mathematical modeling approach to monitoring liver function in drug trials. Wolfram Blog. January 6, 2015. https://blog.wolfram.com/2015/01/06/can-astrazeneca-count-on-your-liver-a-mathematical-modeling-approach-to-monitoring-liver-function-in-drug-trials.
Figures
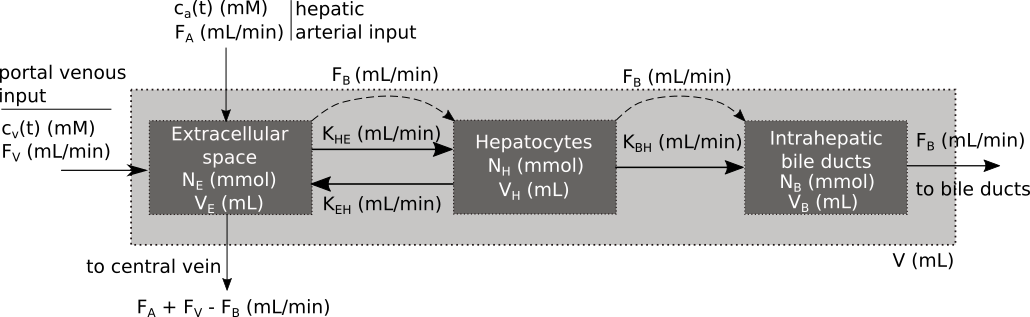
Figure 1. Three-compartment unified Gadoxetate
DCE-MRI liver model. The light grey box models liver tissue - either a voxel,
ROI, segment or whole liver. The dark grey boxes represent the compartments
within liver tissue.
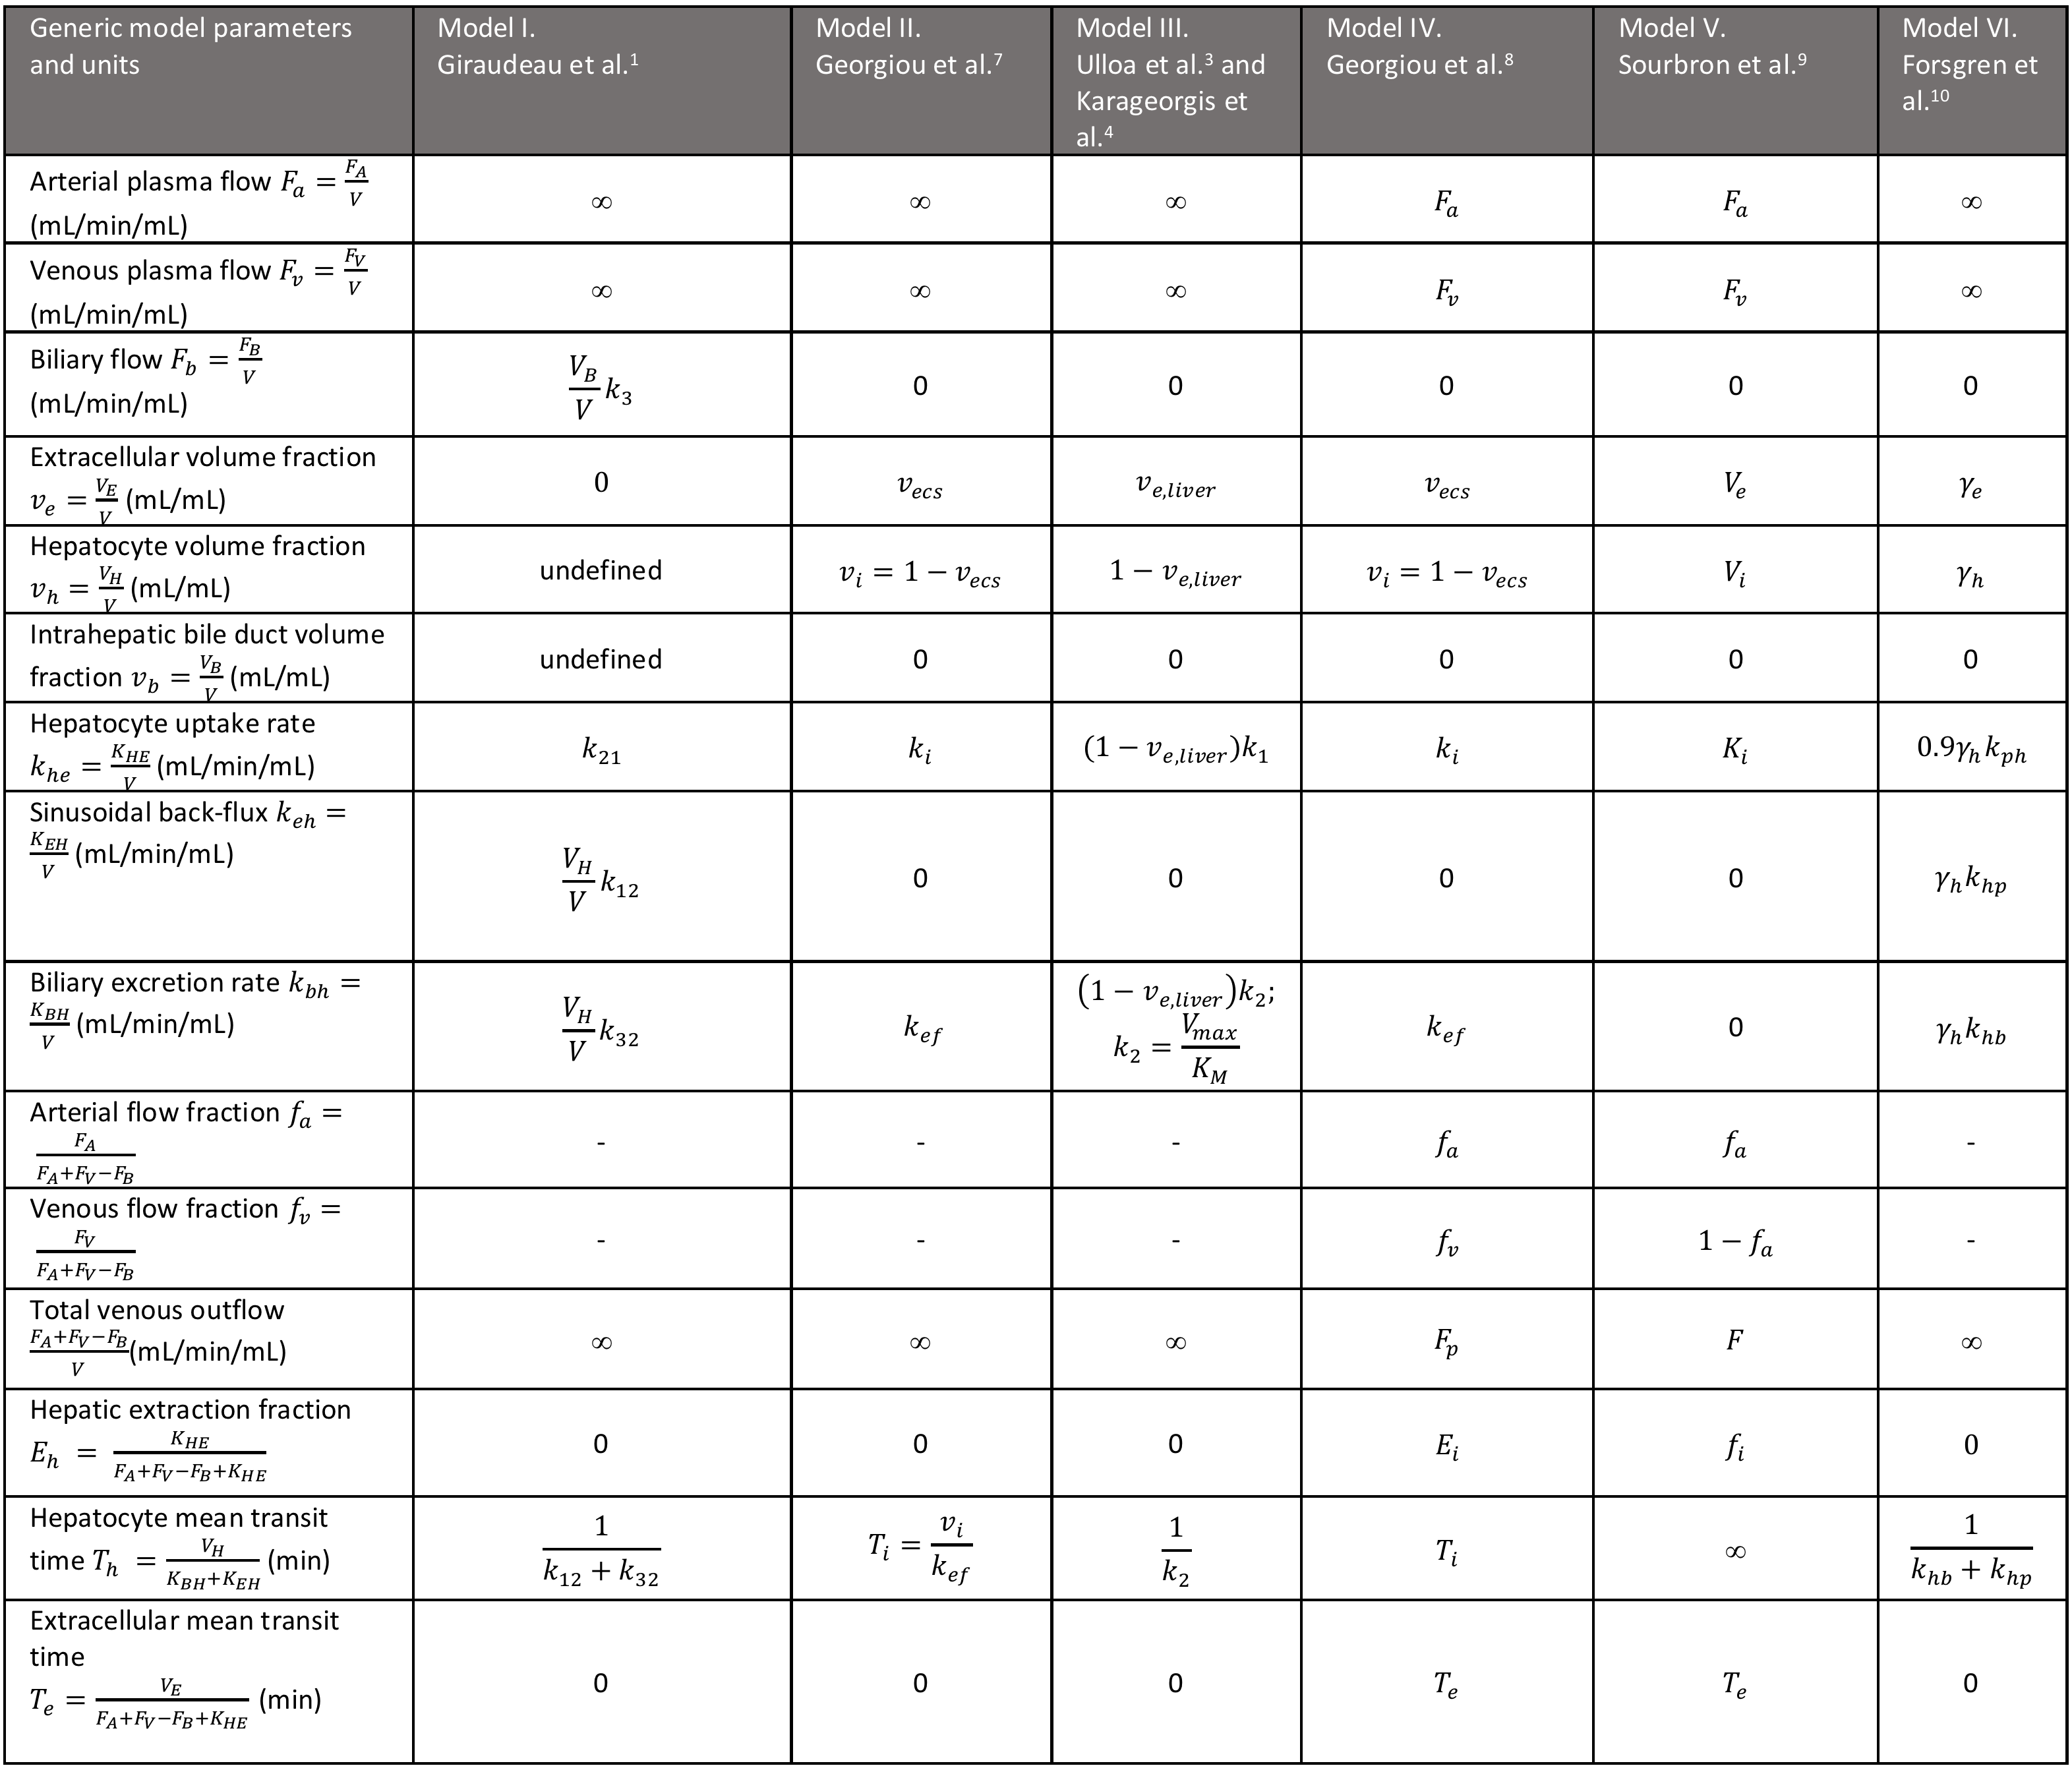
Table 1. Proposed standard tissue parameter definitions
and units and their relationships with parameters found in literature.
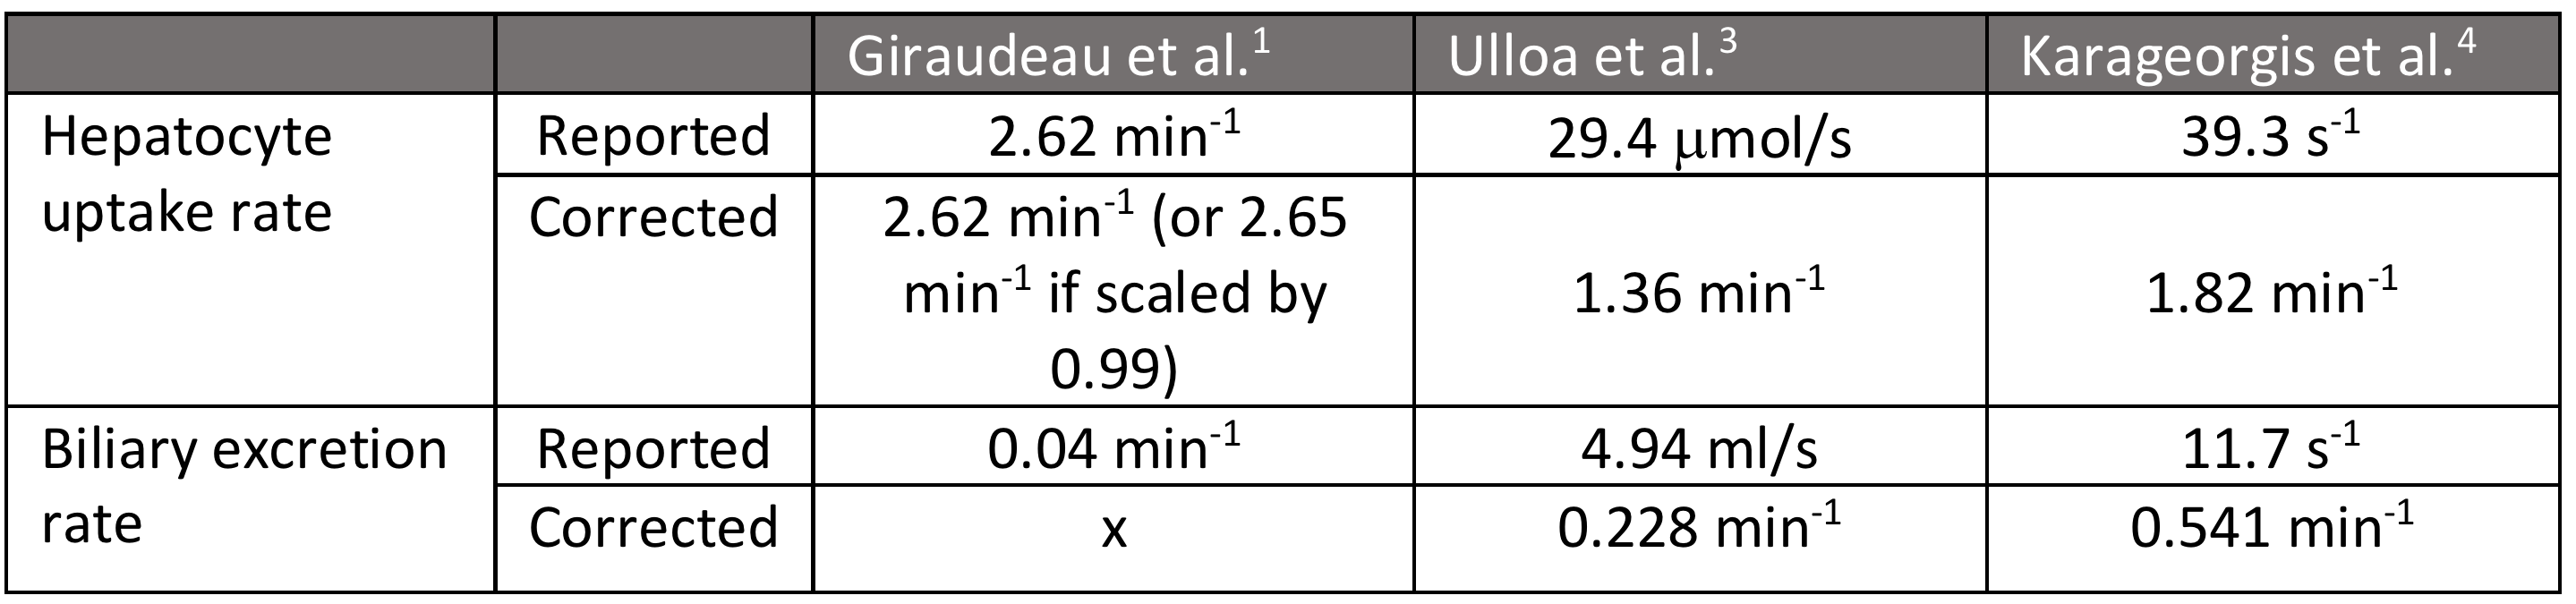
Table 2. Gadoxetate uptake and excretion rates reported in healthy,
male, Han-Wistar rats in literature, before and after standardisation. A fixed
volume fraction of ve = 0.233,4 was assumed.