2485
Evaluation of liver function using the hepatocyte fraction based on gadoxetic acid–enhanced MR imaging1Third Affiliated Hospital of Nantong University & Nantong Third People's Hospital, Nan Tong, China, 2Philips Healthcare Shanghai, China, Shang Hai, China
Synopsis
The purpose of this study was to evaluate the feasibility of using the hepatocyte fraction based on gadoxetic acid–enhanced MRI for the assessment of liver function. Firstly, T1 mapping imaging was performed before and 20 minutes after Gd-EOB-DTPA administration, The following parameters are then obtained from the images: pre- and postcontrast T1 values of the liver (T1pre and T1post), increase in the T1 relaxation rate (Δ R1), rate of the decrease of the T1 relaxation time (Δ T1), hepatocyte fraction (HeF), and uptake coefficient (K). Our study showed that hepatocyte fraction is an effective method to evaluate liver function in patients with hepatitis B cirrhosis.
Introduction
Preoperative assessment of liver function is of great significance for Patients with liver cancer ready for surgical treatment[1-2]. Hepatocyte fraction is a new evaluation tool that can be used to obtain the hepatocyte uptake of contrast agents using T1 mapping sequences and double intergenerational models to evaluate liver function[3]. The purpose of this study was to evaluate the feasibility of using the hepatocyte fraction based on gadoxetic acid–enhanced MRI for the assessment of liver function.Objectives
To evaluate the feasibility of using the hepatocyte fraction based on gadoxetic acid–enhanced MRI for the assessment of liver function.Methods
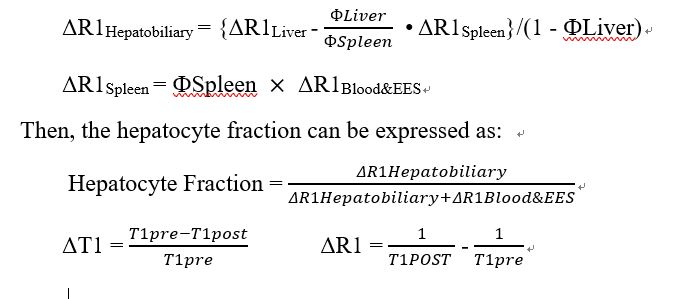
60 Child-Pugh A (LCA) patients, 18 Child-Pugh B (LCB) patients, and 20 normal liver function (NLF) patients were enrolled, and Gd-EOB-DTPA-enhanced MRI was conducted. T1 mapping imaging was performed before and 20 minutes after Gd-EOB-DTPA administration. The following parameters from different Child-Pugh grading groups were compared by one-way analysis of variance: pre- and postcontrast T1 values of the liver (T1pre and T1post), increase in the T1 relaxation rate (Δ R1), rate of the decrease of the T1 relaxation time (Δ T1), hepatocyte fraction (HeF), and uptake coefficient (K). The receiver operating characteristic curve was used to evaluate the effectiveness of each parameter in differentiating the NLF group + LCA group from the LCB group. The parameters of Δ R1, Δ T1, HeF and K are calculated using the following formula (Fig. 1)Results
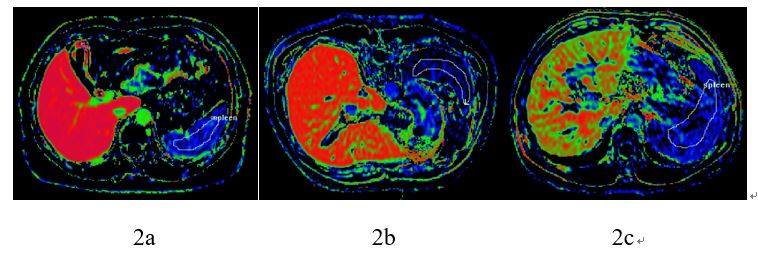
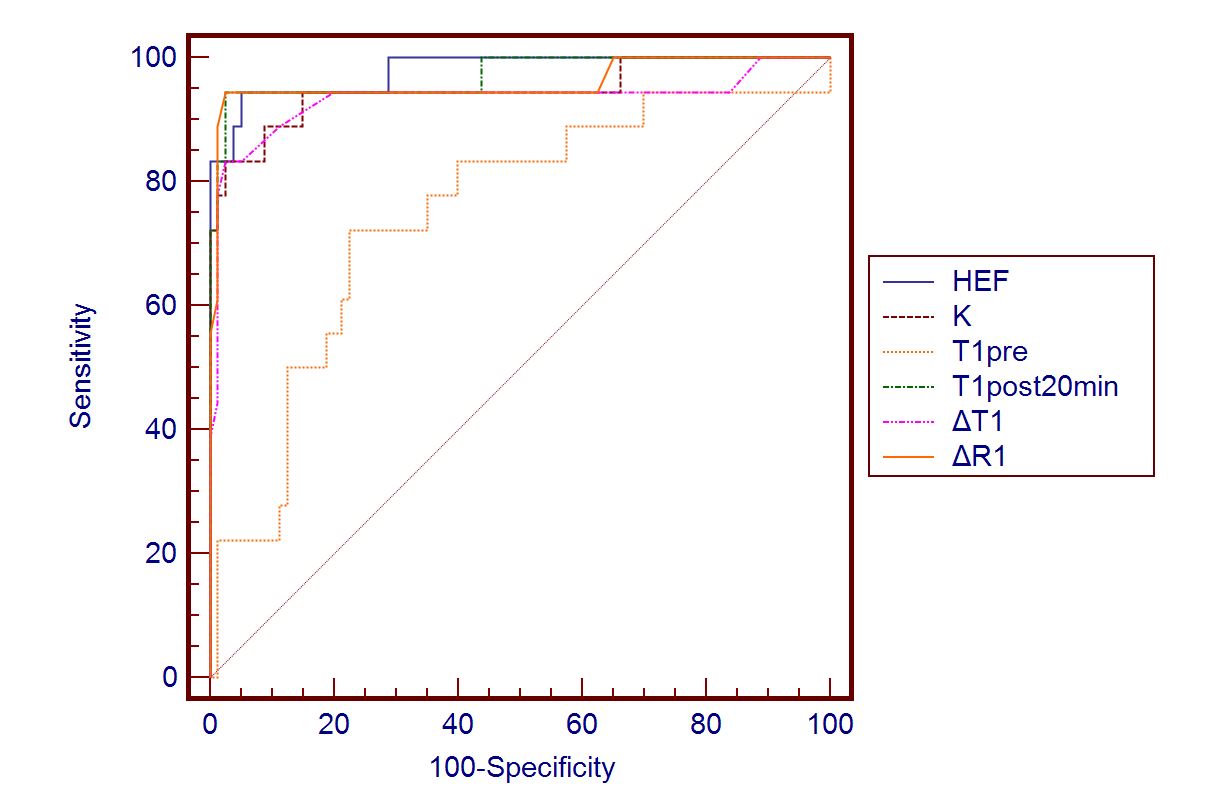
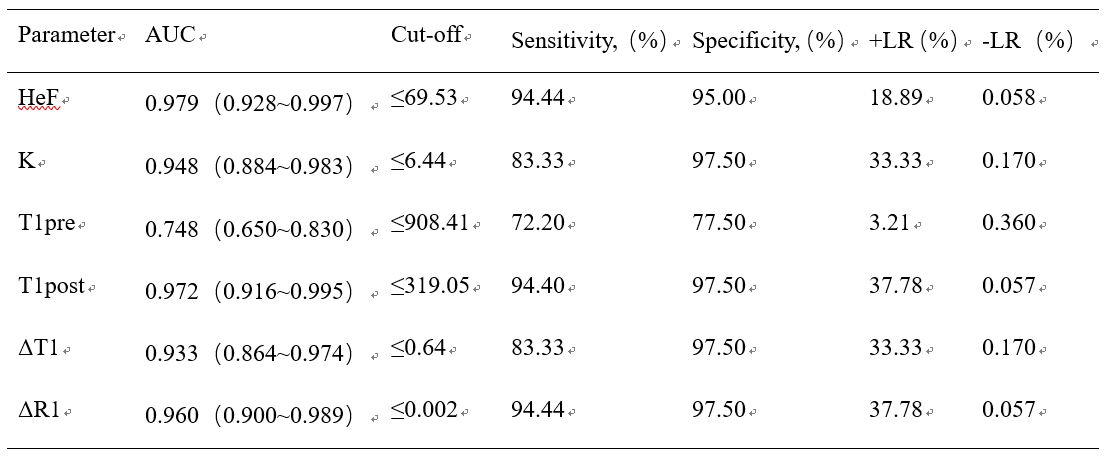
The values of HEF, K, Δ T1, and Δ R1 decreased with the increase in liver function damage, while the values of T1post and T1pre increased with the increase in liver function damage (Table 1, Fig. 2). There were significant differences in T1post, Δ T1, Δ R1, and HeF between different Child-Pugh grades, except for the LCA and NLF groups (p < 0.05). However, no significant difference was observed in the T1pre among the three groups of different Child-Pugh grades (p > 0.05). The largest area under the ROC curve was HEF.( Table 2,Fig. 3)Discussion
The purpose of this study was to provide a non-invasive method for evaluating liver function. The results showed that the values of HEF, K, Δ T1, and Δ R1 decreased with the increase in the degree of liver function damage, while the values of T1post and T1pre increased with the increase in the degree of liver function damage. This phenomenon may be due to the downregulation of organic anion-transporting polypeptides and the increased expression of multidrug–resistant proteins caused by hepatitis and cirrhosis, resulting in the decrease in Gd-EOB-DTPA uptake and increase in Gd-EOB-DTPA excretion by hepatocytes [4]. In this study, no significant difference was detected among the different Child-Pugh grades of T1pre. Therefore, some problems still exist in using plain T1 relaxation time to evaluate liver function. The hepatocyte fraction was found to have the largest area under the ROC curve, indicating that it was more effective than other T1 mapping parameters in evaluating liver function. This observation can be accounted for by a dual compartment model: the hepatocyte fraction removes the effect of the contrast agent in the extracellular space, whereas T1post, ΔT1, and ΔR1 are simultaneously affected by contrast agents in the intracellular and extracellular spaces [3].Conclusion
The hepatocyte fraction is an effective method for evaluating the liver function in patients with hepatitis B cirrhosis.Acknowledgements
References
1. Schreckenbach T, Liese J, Bechstein WO, et al. Posthepatectomy liver failure[J]. Dig Surg, 2012,29(1):79-85.
2. Rahbari NN, Garden OJ, Padbury R, et al. Posthepatectomy liver failure: a definition and grading by the International Study Group of Liver Surgery (ISGLS)[J]. Surgery, 2011,149(5):713-724.
3. Dahlqvist Leinhard O, Dahlström N, Kihlberg J, et al. Quantifying differences in hepatic uptake of the liver specific contrast agents Gd-EOB-DTPA and Gd-BOPTA: a pilot study[J]. Eur Radiol, 2012,22(3):642-653.
4. Tsuda N, Harada K, Matsui O. Effect of change in transporter expression on gadolinium-ethoxybenzyl-diethylenetriamine pentaacetic acid-enhanced magnetic resonance imaging during hepatocarcinogenesis in rats[J]. J Gastroenterol Hepatol, 2011,26(3):568-576.
Figures