2484
Gadolinium-BOPTA Contrast-enhanced MRI in the Hepatobiliary Phase: Evaluating Liver Function based on the visualizing degree of Biliary System1Department of Radiology, Shandong Provincial Hospital, Jinan, China, 2MR Scientific Marketing, Diagnostic Imaging, Siemens Healthcare Ltd, Beijing, China, 3MR Scientific Marketing, Diagnostic Imaging, Siemens Healthcare Ltd, shanghai, China
Synopsis
Gd-BOPTA, as a widely used hepatobiliary-specific MR contrast agent, has advantages in diagnosing focal liver lesions and may be a valuable assessment tool for the estimation of liver function. The aim of our study was to evaluate liver function according to the degree of biliary system visualization using Gd-BOPTA. Our results suggested that the degree of biliary system visualization using Gd-BOPTA-enhanced MRI may be used as a quantifiable metric to estimate liver function and liver function reserve.
Introduction
Gd-BOPTA, as a widely used hepatobiliary-specific MR contrast agent, has advantages in diagnosing focal liver lesions and may be a valuable assessment tool for the estimation of liver function (1,2). Long delay time (90 min) of the hepatobiliary phase increases the rate of biliary excretion of hepatobiliary-specific MR contrast agents, especially in patients with cirrhosis (3,4). Gd-BOPTA contrast-enhanced MRI in the hepatobiliary phase may improve the degree of biliary system visualization. The aim of our study was to evaluate liver function according to the degree of biliary system visualization using Gd-BOPTA.Materials and methods
In this retrospective study, 343 patients (208 female; mean age 52±1.2 years) were enrolled in the present study, including 132 with normal liver function (NLF group) and 211 with hepatic cirrhosis (hepatic cirrhosis group). According to Child-Pugh classification, hepatic cirrhosis group were sub-classified into three groups: Child-Pugh class A (LCA, 107); Child-Pugh class B (LCB, 70); and Child-Pugh class C (LCC, 34]). All subjects underwent MRI scan at a 3T scanner (MAGNETOM Prisma, Siemens Healthcare, Erlangen, Germany) with an 18-channel body matrix coil. The axial fat-saturated T1-weighted VIBE sequence was acquired with the following parameters: TR/TE, 3.31/1.3ms; slice thickness, 3 mm; number of partitions, 72; FOV, 380 mm × 308 mm; flip angle, 9°; bandwidth, 450 Hz/pixel; matrix size, 182×320; and acquisition time, 17 s. T1-weighted VIBE sequences were acquired with breath holding both before and after contrast media injection in the arterial phase (20 s), late arterial phase (50 s), portal venous phase (80 s), and hepatobiliary phase (90 min).Imaging analysis
MR images at the pre-contrast and hepatobiliary phases were independently evaluated by two experienced radiologists, blinded to all clinical information. ROIs were manually drawn in the upper end of the common bile duct (CBD) to extract SIup and lower end of the CBD (SIlow). The SI of the erector spinae muscle (SIm) was measured using the same size ROI in the erector spinae muscles. Finally, the relative enhancement (RE) ratio of the biliary system was calculated as follows: RE = (SI up/SI m + SI low/SI m)/2. To quantitatively measure SI of the liver parenchyma, the ROIs were placed at 2 locations in the left lobe (lateral and medial segments) and in the right lobe (anterior and posterior segments). The RE ratio of the liver parenchyma (LRE) was calculated from SI measurements performed before (SI pre) and 90 min after (SI post) the intravenous administration of Gd-BOPTA using the following formula: LRE = (SI post − SI pre)/SI pre.
Statistical analysis
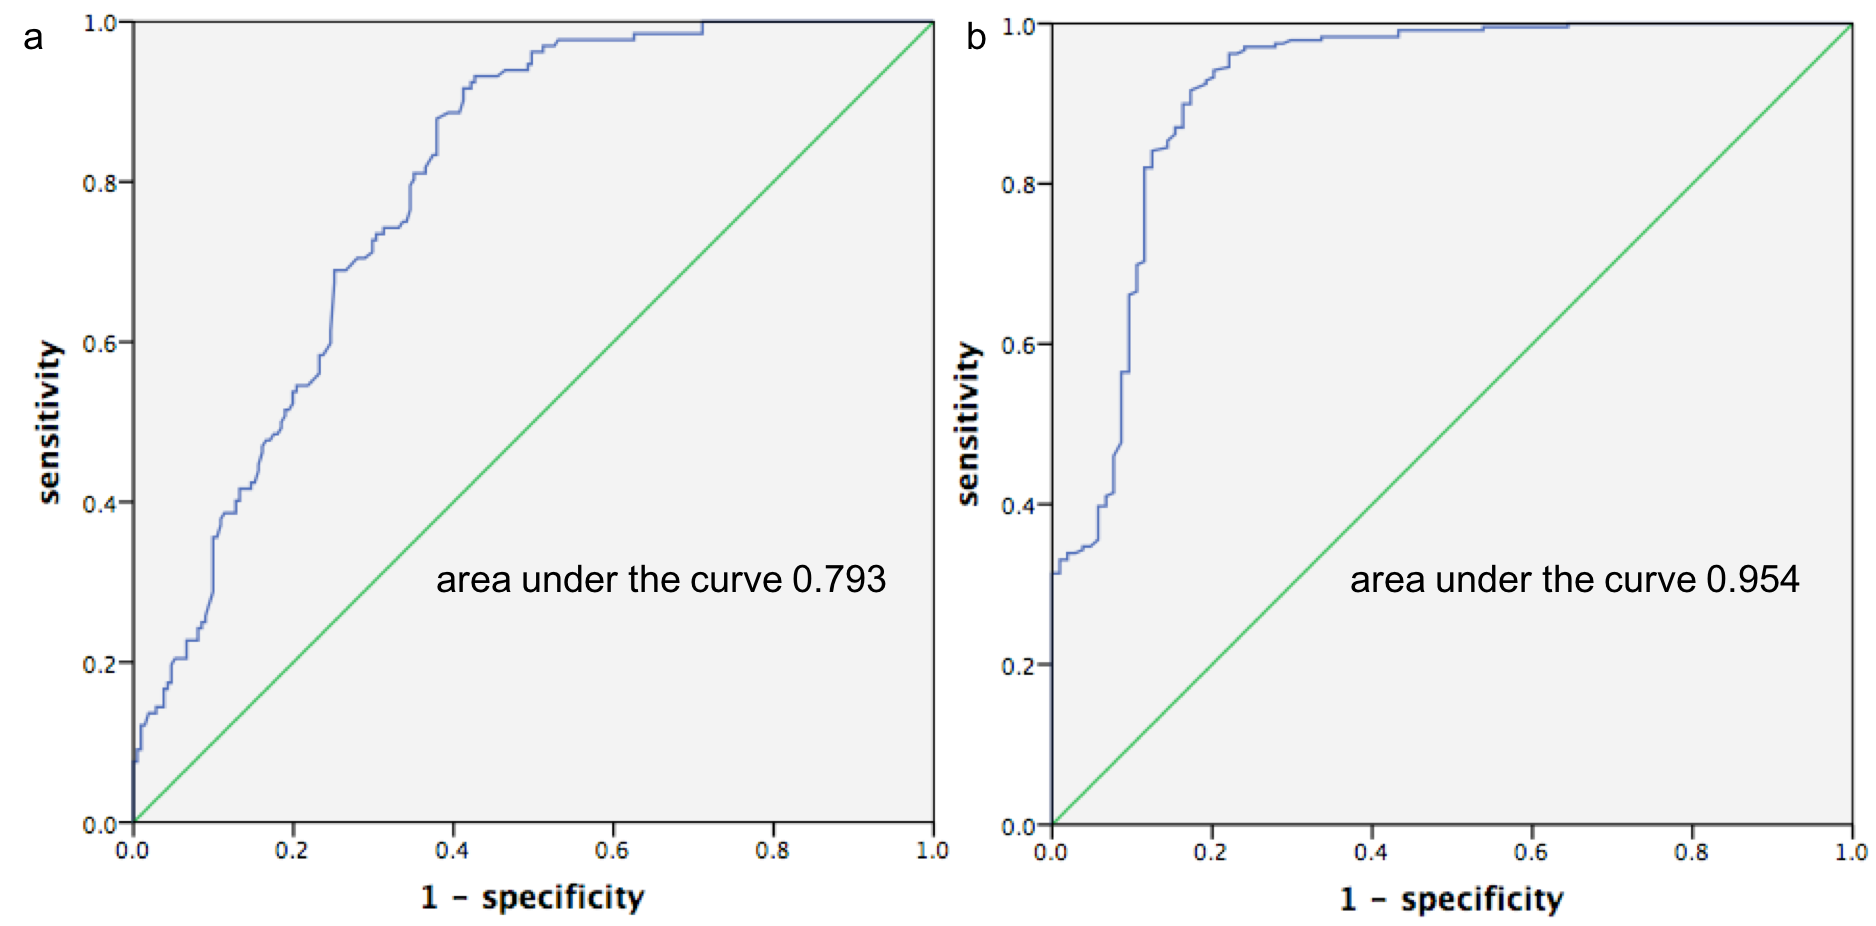
All data were analyzed using SPSS version 22.0 (IBM Corporation, Armonk, NY, USA). The RE ratios and serum parameters (total bilirubin, prothrombin time (PT), and albumin) were the continuous variables. Pearson’s correlation analysis, one-way ANOVA, and post hoc pairwise comparisons were performed for statistical analysis; P < 0.05 was considered as statistically significant. Diagnostic performance in quantitatively evaluating liver function was assessed using receiver operating characteristic (ROC) curve analysis. The corresponding optimal cut-off values and AUCs were also determined.
Results
Total bilirubin, PT, albumin, and RE ratios of the biliary system for patients in each group were summarized in Table 1. Figure 1 shows an example of MR images in the hepatobiliary phase.RE ratios of the biliary system were negatively correlated with total bilirubin (r = -0.542, P < 0.01) and PT (r = -0.520, P <0.01). RE ratio of the biliary system was positively correlated with albumin level (r = 0.555, P < 0.01) and liver parenchyma in all patients (r = 0.457, P < 0.001) (Figure 2). RE ratio of the biliary system in the NLF group was significantly higher than those of the LCA, LCB and LCC groups (all P < 0.001). RE ratio of the biliary system in the LCA group was significantly higher than in the LCB and LCC (both P < 0.001) groups (Figures 3). Analysis of the ROC curves (Figure 4a) yielded a cut-off value of ≥ 2.695 for RE ratio of the biliary system (sensitivity, 0.81; specificity, 0.93; AUC, 0.793) for patients in the NLF group. A cut-off value of ≥ 2.305 for RE ratio of the biliary system (sensitivity, 0.83; specificity, 0.92; AUC 0.954) was found for patients in the LCA group (Fig. 4b).
Discussion
The RE ratios for the biliary system in Gd-BOPTA MRI demonstrated a significant negative correlation with total bilirubin, which is associated with hepatocellular excretory function (5), and were correlated with LRE. This correlation can be explained by their pharmacokinetics: decreased liver function leads to increased bilirubin level, decreased liver parenchymal enhancement, and biliary enhancement with Gd-BOPTA. The RE ratio of the biliary system (≥ 2.695) could identify patients with normal liver function and without hepatic cirrhosis, which can be useful to determine cirrhosis patients. What’s more, RE ratios of the biliary system (≥ 2.305) identified patients with adequate liver function reserve. Thus, the degree of biliary system visualization using Gd-BOPTA provided a valuable method for surgical planning and the prediction of postoperative survival rates.Conclusion
The degree of biliary system visualization using Gd-BOPTA-enhanced MRI may be used as an imaging-based, quantifiable metric to estimate liver function and liver function reserve.Acknowledgements
NoneReferences
1. Wong, Y.C., et al., Detection and characterization of traumatic bile leaks using Gd-EOB-DTPA enhanced magnetic resonance cholangiography. Sci Rep, 2018. 8(1): p. 14612.
3. Esterson, Y.B., et al., Improved parenchymal liver enhancement with extended delay on Gd-EOB-DTPA-enhanced MRI in patients with parenchymal liver disease: associated clinical and imaging factors. Clin Radiol, 2015. 70(7): p. 723-9.
4. Kinner, S., et al., Added value of gadoxetic acid-enhanced T1-weighted magnetic resonance cholangiography for the diagnosis of post-transplant biliary complications. Eur Radiol, 2017. 27(10): p. 4415-4425.
5. Yoon, J.H., et al., Quantitative Liver Function Analysis: Volumetric T1 Mapping with Fast Multisection B1 Inhomogeneity Correction in Hepatocyte-specific Contrast-enhanced Liver MR Imaging. Radiology, 2017. 282(2): p. 408-417.
Figures
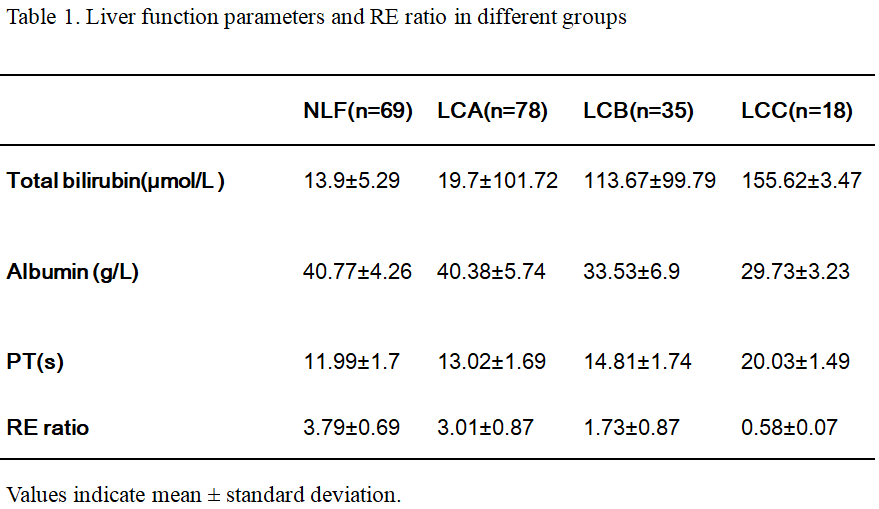
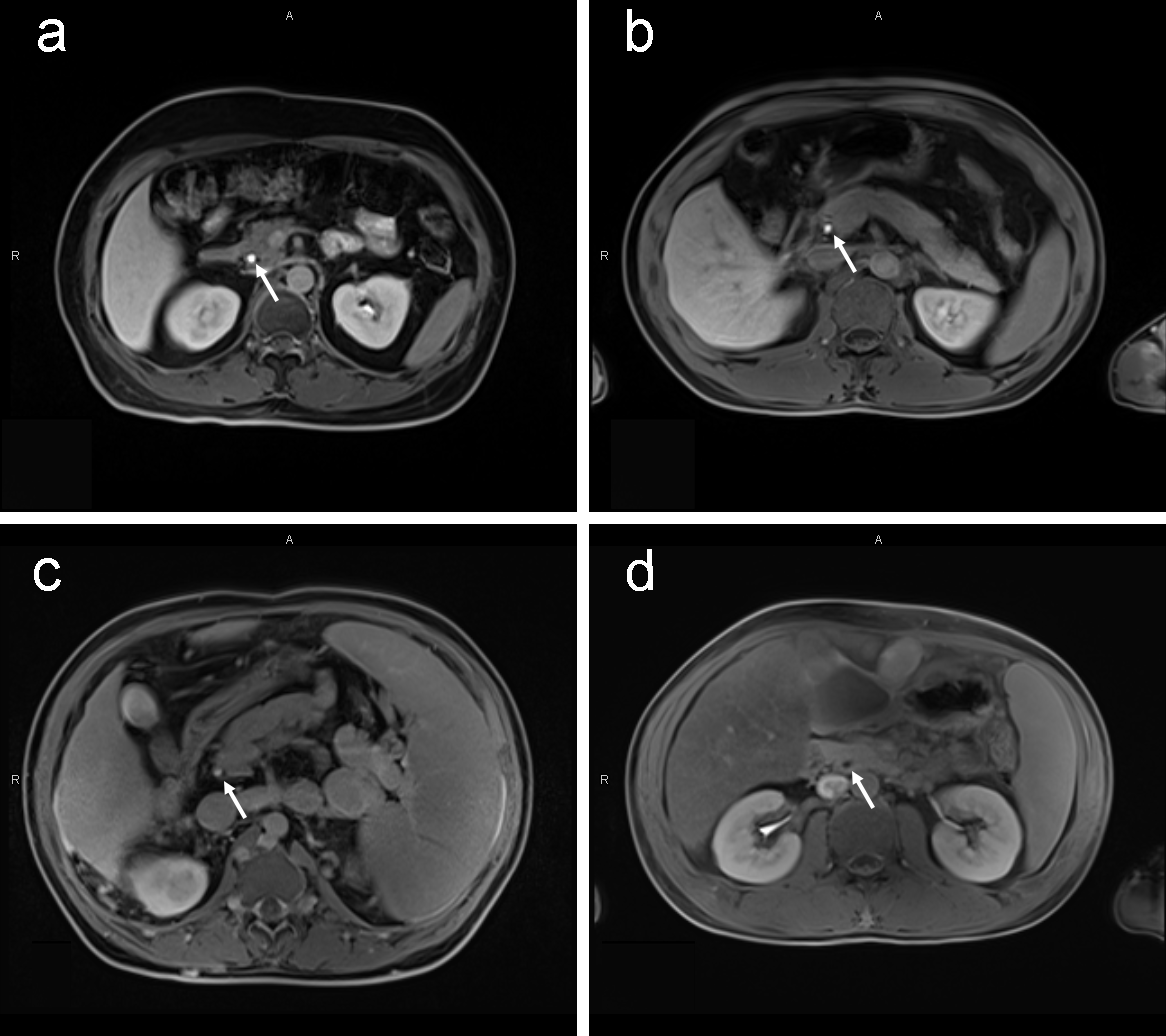
Figure 1. An example of MR images in the hepatobiliary phase to display the common bile duct (arrow). Images a to d were selected from the patient closest to the median RE ratio in each group: NLF (a); LCA (b); LCB (c); and LCC (d). The RE ratios of the biliary system of each patient were 3.79 (a), 3.01 (b), 1.73 (c), and 0.58 (d), respectively.
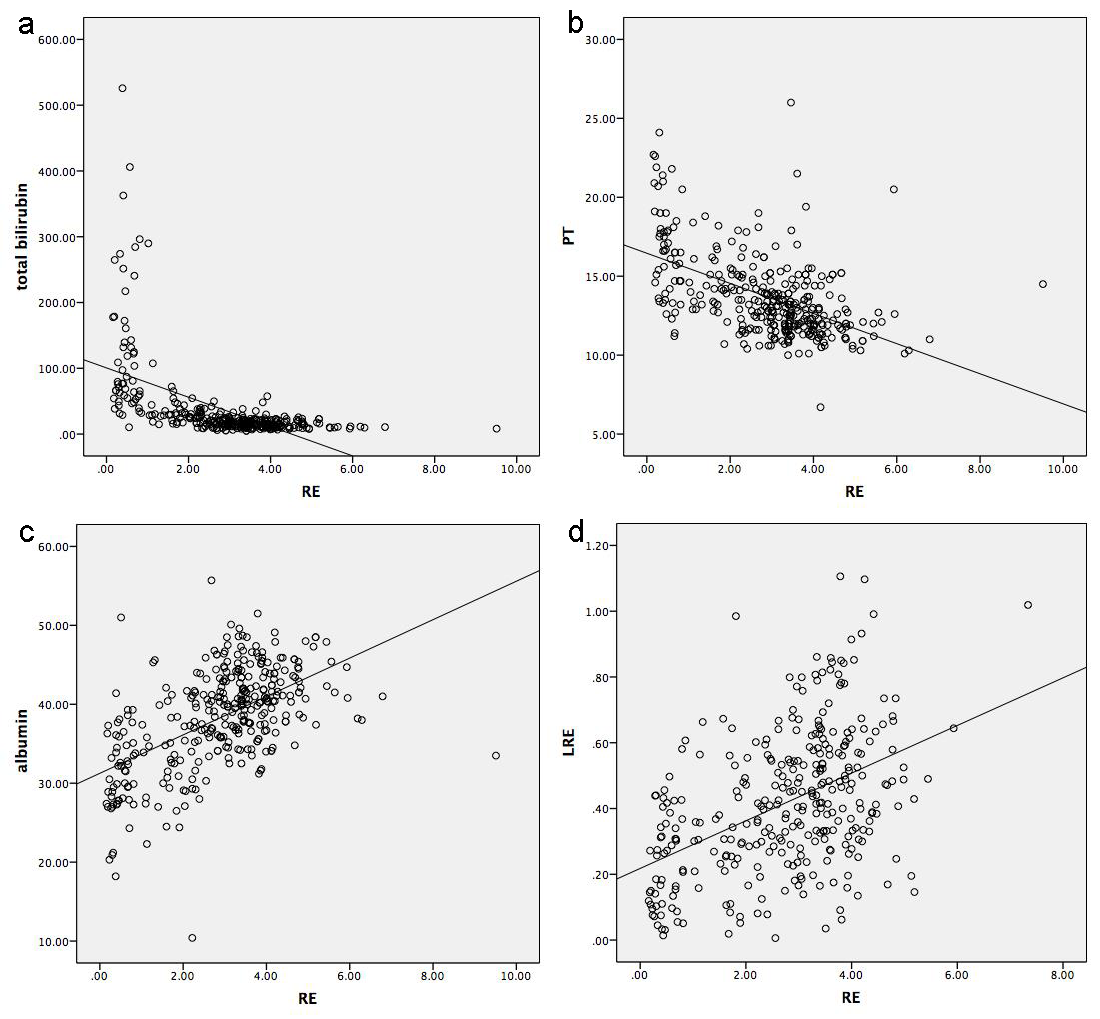
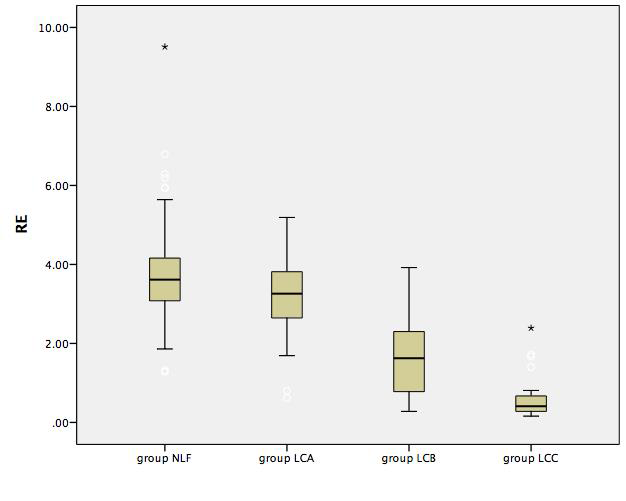
Figure 3. Boxplots illustrating relative enhancement (RE) ratios of the biliary system for the NLF, LCA, LCB, and LCC groups. RE shows (SI up/SI m + SI low/SI m)/2. SI up and SI low represent the signal intensity (SI) of the upper end of the common bile duct (CBD) and the lower end of the CBD, respectively.