2483
Gd-BOPTA-enhanced MRI predicts the severity of esophageal varices (EV) and portal vein pressure in hepatitis B cirrhosis patients1Department of Radiology, Shandong Provincial Hospital, Jinan, China, 2MR Scientific Marketing, Diagnostic Imaging, Siemens Healthcare Ltd, shanghai, China, 3MR Scientific Marketing, Diagnostic Imaging, Siemens Healthcare Ltd, Beijing, China
Synopsis
The characteristics of liver cirrhosis are usually hepatic dysfunction and portal hypertension. Portal hypertension further leads to ascites and esophageal varices (EV). To our knowledge, no methods are currently available for the simultaneous evaluation of portal hypertension and EV severity. The results of this study positively illustrate that Gd-BOPTA-enhanced MRI can serve as a novel and efficient tool to simultaneously and accurately evaluate portal hypertension and high-risk EVs. Relative enhancement ratio (RE) is correlated with estimated HVPG. The formula (-6.483+15.612*portal vein width + 2.251 * RE - 0.176 * platelet count) could be used for the prediction of high-risk EVs.
Purpose
The main objective of this study was to explore the effectiveness of Gd-BOPTA-enhanced magnetic resonance imaging (MRI) in the prediction of portal hypertension and high-risk esophageal varices (EV) in hepatitis B cirrhosis patients.Methods
In this retrospective study, hepatitis B cirrhosis patients were enrolled from Shandong Provincial Hospital affiliated to Shandong University between June 2017 and January 2018. In total, 71 and 30 patients were recruited in the training and validation groups, respectively. The major baseline characteristics of the training and validation subgroups were summarized in Table 1. There were no significant differences between the two groups. All patients underwent liver Gd-BOPTA-enhanced MR imaging on a 3T system (MAGNETOM Verio; Siemens Healthcare, Erlangen, Germany), upper gastrointestinal endoscopy, routine blood tests, blood coagulation analysis and liver function tests. Additionally, 56 from all the patients underwent upper abdominal contrast-enhanced computed tomography (CECT) (Fig. 1). The T1-weighed images were acquired using the following parameters: TR/TE = 3.92/1.39 ms; flip angle, 9°; slice thickness, 3 mm; number of partitions, 80; bandwidth, 400 Hz/pixel; field of view, 380×308 mm2; matrix, 182×320; acceleration factor, 2; acquisition time, 17 s.Four regions of interest (ROIs) with the same size, located respectively in the lateral left segment, medial left segment, anterior right segment, and posterior right segment were manually drawn on the pre/post-contrast T1W images (Fig. 2). The RE ratio was calculated as (SIpost − SIpre)/SIpre (SIpre representing SI measurements before intravenous administration of Gd-BOPTA and SIpost representing SI measurements 90 min after enhancement). The relationships between the relative enhancement ratio (RE) of Gd-BOPTA-enhanced MRI and portal vein pressure were further explored.
Hepatic venous pressure gradient (HVPG) is the only validated parameter that allows the accurate prediction of changes in portal vein pressure2. A new non-invasive predictive model to accurately and reproducibly evaluate HVPG in hepatitis B cirrhosis patients using the following equation: HVPG score=13.651-6.187×ln (liver/spleen volume) +2.755×[classification of varices score (small: 1; large; 2)]1. In this study, we adopted this formula with the aim of assessing the correlation of REs of Gd-BOPTA-enhanced MRI with the estimated HVPG score, reflecting portal vein pressure.
The eligible 71 subjects were categorized into high-risk and non-high-risk EV groups (Table 2). Univariate analysis revealed significant differences in sex (P=0.001), platelet count (P=0.000), RE (P=0.000), Child-Pugh score (P=0.000), portal vein width (P=0.000) and spleen diameter (P=0.000) between the two groups, but no differences were observed based on age. Subsequently, the above predictors were included for a stepwise logistic regression formula. Ultimately, platelet count (P<0.001), portal vein width (P<0.001) and RE (P<0.001) were recognized as independent predictors of high-risk EVs.
Statistical analyses were carried out with SPSS 16.0 (SPSS Inc., Chicago, IL, USA). Comparisons between continuous and categorical variables were performed using Students’ t-test (or one-way analysis of variance, if appropriate) and χ2 test, respectively. Variables with P<0.05 in the univariate analyses were entered into the subsequent multivariate analyses. Next, we applied multiple logistic regression to select variables with P<0.05 to generate the final formula for predicting high-risk EVs. Differences in diagnostic performance were analysed by comparing ROC curves. P<0.05 was considered as statistically significant.
Results
Platelet count, portal vein width and RE were identified as independent predictors of high-risk EVs. Based on these parameters, we calculated the EV score model as: -6.483+15.612*portal vein width+2.251*RE-0.176*platelet count. The AUROC in training set and validation set were determined to be 0.903 and 0.919, respectively. (Fig. 3)In total, 56 patients subjected to CECT imaging in the training group were included in this analysis. Significant negative correlations were observed between REs of Gd-BOPTA-enhanced MRI and estimated HVPG (R=-0.6266, P=0.000), consistent with data from scatter plots (Fig. 4). Thirty patients in the validation group also achieved the same conclusion (R=-0.5971, P=0.000).
Discussion & conclusion
The hallmarks of decompensated liver cirrhosis usually are hepatic dysfunction and portal hypertension. Portal hypertension further leads to ascites and EVs. No tools are currently available for the simultaneous evaluation of portal hypertension and EV severity. The results of this study in hepatitis B cirrhosis patients suggest Gd-BOPTA-enhanced MRI is a promising diagnostic test for the simultaneous assessment of both portal hypertension and EV severity, facilitating a cost-effective and comprehensive evaluation of decompensated cirrhosis.In conclusion, Gd-BOPTA-enhanced MRI was successfully applied to evaluate high-risk EVs and portal hypertension. These results in this study suggest Gd-BOPTA-enhanced MRI as an accurate non-invasive model for detecting high-risk EVs, eliminating the need to perform endoscopy in all cirrhosis patients.
Acknowledgements
NoneReferences
Figures
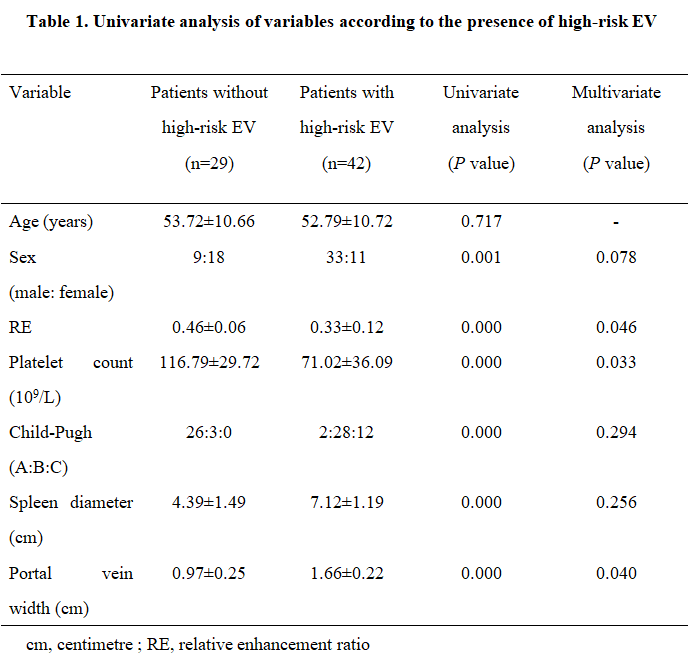
Table 1. Univariate analysis of variables according to the presence of high-risk EV
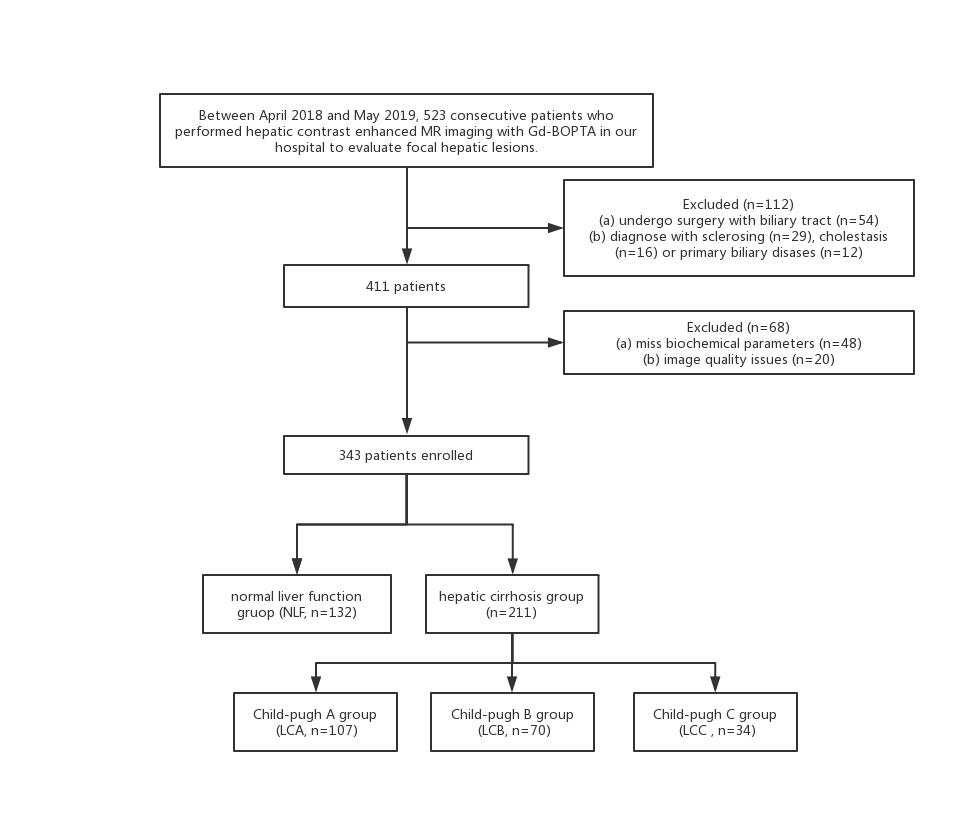
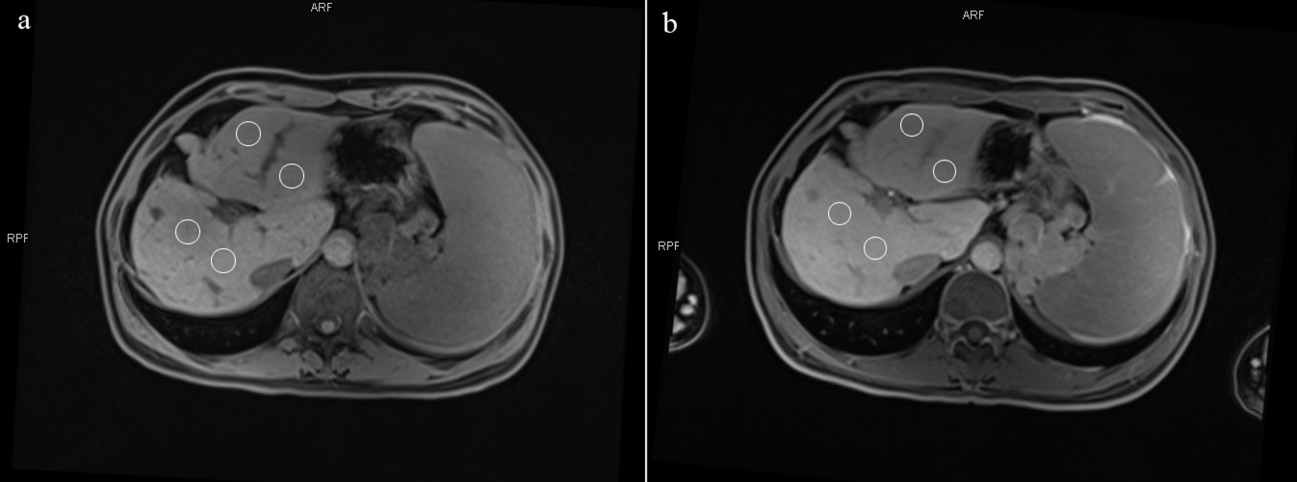
Fig. 2. An example showing the measurement of SI of the liver parenchyma by drawing four ROIs of the same size, located respectively in the lateral left segment, medial left segment, anterior right segment, and posterior right segment.
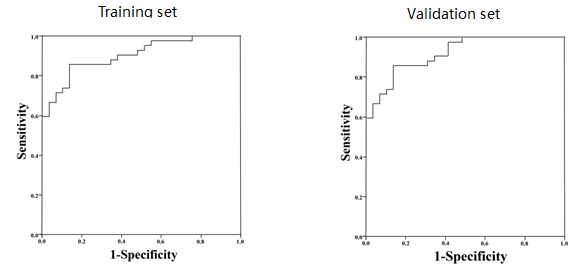
Fig. 3. ROC curve of EV scores for diagnosing high-risk EV in the training set (left) and validation set (right). The AUROC was determined as 0.903 and 0.919.
Abbreviations: AUROC, area under the receiver-operating characteristic curve; EV, esophageal varices; ROC, receiver-operating characteristic.
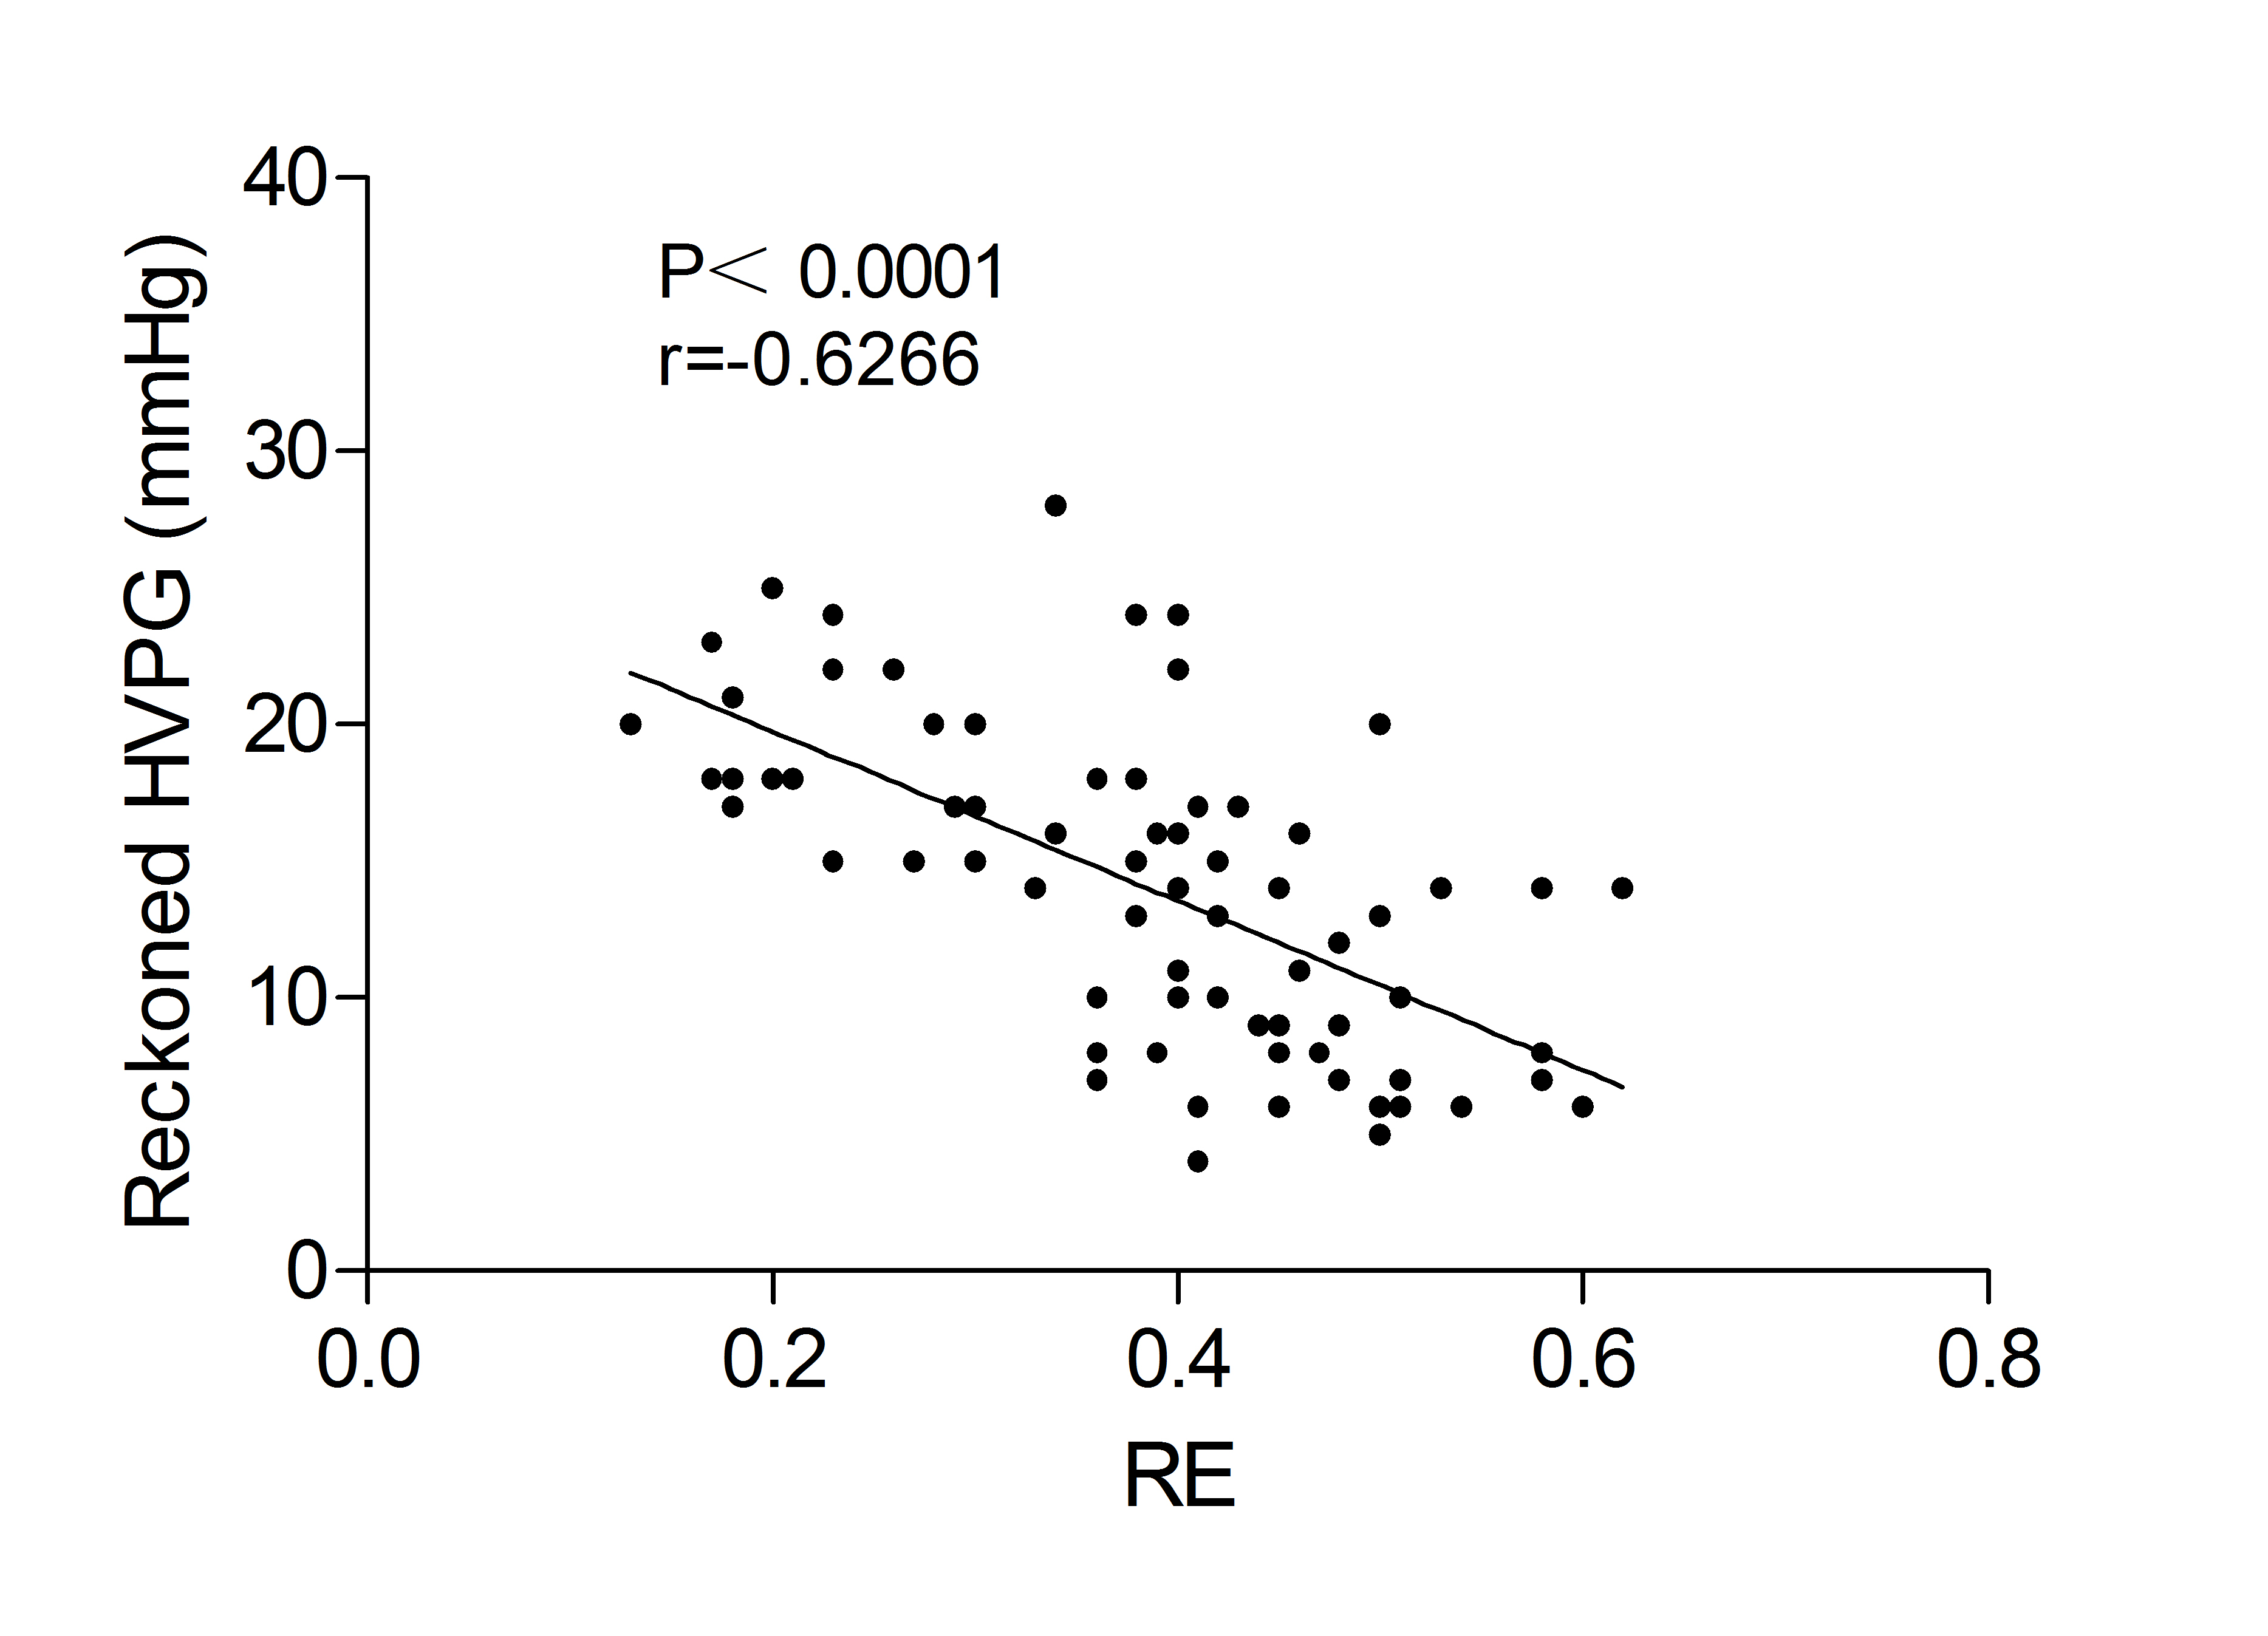
Fig. 4. Scatter plot of the relationship between REs of Gd-BOPTA-enhanced MRI and portal vein pressure in patients with hepatitis B-related cirrhosis showing significant negative correlations (R=-0.6266, P=0.000).