2479
Multiparametric MRI evaluation of liposomal prostaglandin E1 intervention on hepatic warm ischemia-reperfusion injury in rabbits1Tianjin First Central Hospital, Tianjin, China, 2Siemens Healthcare GmbH, Erlangen, Germany, 3MR collaboration, Siemens Healthcare Ltd, Beijing, China
Synopsis
This study evaluated if multiparametric magnetic resonance imaging (MRI) could identify changes in warm ischemia-reperfusion injury (WIRI) after liposomal prostaglandin E1 (Lipo-PGE1) intervention in rabbit livers. We measured blood oxygen level–dependent, diffusion tensor, and intravoxel incoherent motion imaging on functional hepatic parameters in rabbits exposed to 1) warm ischemia at different times, 2) Lipo-PGE1 interventions, and 3) sham operations. The parameters were sensitive to perfusion and oxygenation changes during WIRI. Multiparametric MRI successfully identified changes after Lipo-PGE1 intervention. These results offer new insights to quantitatively evaluate the effect of drugs on hepatic WIRI after liver transplantation and hepatectomy.
Background and Purpose
Hepatic warm ischemia-reperfusion injury (WIRI) often occurs in clinical conditions, such as liver transplantation and eventually leads to damage in liver microcirculation[1]. Finding ways to effectively reduce liver damage is particularly significant. Previous studies have shown that liposomal prostaglandin E1 (Lipo-PGE1) could protect livers from WIRI by improving hepatic microcirculation and reducing the damage caused by oxidative stress [2]; however, quantitative methods were lacking in these studies. Therefore, in this study, we used multiparametric MRI to quantitatively evaluate liposomal prostaglandin E1 (Lipo-PGE1) intervention on WIRI) in rabbit livers.Methods and materials
Seventy healthy adults New Zealand white rabbits were randomly divided into seven groups of 10 animals each. There was one sham-operated group (A0), three warm ischemia time groups (A1-A3 with 30, 40, 60 min ischemic times, respectively), and three corresponding Lipo-PGE1 interventional groups (I1-I3, injected with Lipo-PGE1 before blocking blood flow). After 6 hours of reperfusion, all the rabbits underwent conventional magnetic resonance imaging (MRI), blood oxygen level–dependent (BOLD) MRI, diffusion tensor imaging (DTI), and prototype intravoxel incoherent motion (IVIM) diffusion-weighted imaging (DWI) using a 3-Tesla (3T) MR scanner (MAGNETOM Trio a Tim system, Siemens Healthcare, Erlangen, Germany). Rabbits were sacrificed after MRI to perform serum biochemical and histopathologic examinations. All MRI parametric maps (R2*, apparent diffusion coefficient [ADC], fractional anisotropy [FA], slow diffusion [Dslow], fast diffusion [Dfast] and perfusion fraction [PF]) and biochemical analytes (alanine aminotransferase [ALT], aspartate aminotransferase [AST], and lactate dehydrogenase (LDH) were analyzed using the one-way analysis of variance (ANOVA), independent-sample t-test, Spearman correlation analysis, and receiver operating characteristic curve (ROC) analysis. The BOLD, DTI and IVIM parameters were entered into multiple logistic regression models to determine areas under the ROC curve (AUC) of the different MRI sequences. A p-value <0.05 was considered significant.Results
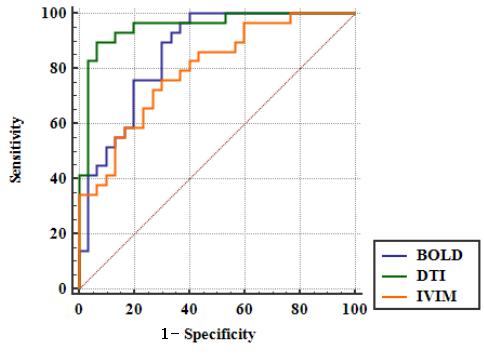
Prolonged warm ischemia times resulted in higher R2* and FA values and gradually lower ADC, Dslow, Dfast, and PF values (all P<0.05; Table 1). The R2* and FA values were lower, and the ADC, Dslow, Dfast, and PF values were higher in the Lipo-PGE1 intervention groups compared with those in the warm ischemia group for each paired time. However, none of the parameters reached the levels of the A0 group (all P<0.05). At the shortest (30 min), middle (40 min), and longest (60 min) ischemia times, three (ADC, Dslow and Dfast), four (R2*, ADC, Dfast, and PF), and five (R2*, ADC, FA, Dslow and Dfast) parameters were different between the WIRI and intervention groups, respectively. (all P<0.05; Table 2, Figure 1). ADC, Dslow, Dfast, and PF values were negatively correlated, and R2*, FA values were positively correlated with the ALT and AST concentrations (all P<0.05). ADC and Dfast values showed significant negative correlations, and R2* showed significant positive correlations with the LDH concentrations (all P<0.05; Table 3). ROC analysis showed that the AUC of DTI had the strongest ability to identify the Lipo-PGE1 intervention effects (Figure 2). Finally, the histopathologic results demonstrated that the degree of hepatocyte damage, inflammatory cell infiltration, and liver sinus congestion in the Lipo-PGE1 intervention groups was not as severe as those in the hepatic WIRI groups.Discussion
This study used multiparametric MRI to noninvasively and quantitatively evaluate the different degrees of hepatic WIRI and the effect of Lipo-PGE1 interventions. We showed that Lipo-PGE1 alleviated hepatic WIRI in rabbits and that DTI has the strongest ability to identify this intervention. The results of our study showing that the R2* and FA values were decreased and ADC, Dslow, Dfast and PF values were increased in the Lipo-PGE1 intervention groups compared with the hepatic WIRI groups confirmed that Lipo-PGE1 could protect the liver from WIRI by improving hepatic microcirculation and reducing damage from oxidative stress. In addition, we showed that greater improvements from the Lipo-PGE1 interventions were seen as ischemia times increased. The most obvious interventional role of Lipo-PGE1 was shown to be the improvement of hepatic blood perfusion, which was followed by an improvement in blood oxygen levels and hepatocyte edema. The significant correlations between MRI parameters (R2*, ADC, FA, Dslow, Dfast, and PF) and biochemical analytes (AST, ALT, and LDH), seen in this study, showed that MRI parameters could noninvasively identify liver injury changes.Conclusions
We showed that multiparametric MRI could evaluate the degree to which that Lipo-PGE1 alleviated hepatic WIRI in rabbits, and DTI was the best diagnostic method. Our results provide a new method to quantitatively evaluate the effect of drug intervention in hepatic WIRI after liver transplantation and hepatectomy.Acknowledgements
No acknowledgement found.References
[1] Olthof P B, Van Golen R F, Meijer B, et al. Warm ischemia time-dependent variation in liver damage, inflammation, and function in hepatic ischemia/reperfusion injury[J]. Biochimica et Biophysica Acta (BBA) - Molecular Basis of Disease, 2017, 1863(2):375-385.
[2] Radojkovic M, Stojanovic M, Stanojevic G, et al. Ischemic preconditioning vs adenosine vs prostaglandin E1 for protection against liver ischemia/reperfusion injury[J]. Brazilian Journal of Medical and Biological Research,2017,50(8):e6185-6190.
Figures
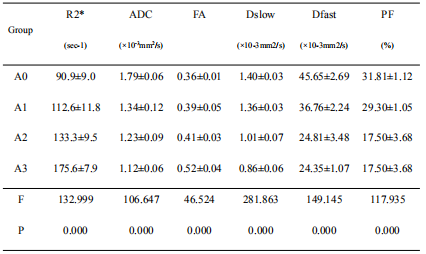
Table 1: Comparison among the sham-operated and warm ischemia groups
Data was reported as mean±SD. Comparison among four groups: one-way ANOVA. ADC, apparent diffusion coefficient; FA, fractional anisotropy; Dslow, slow diffusion; Dfast, fast diffusion; PF, perfusion fraction

Table 2: Comparison between the warm ischemia groups and the corresponding intervention groups with the concurrent warm ischemia times
Data was reported as mean±SD. A comparison between the two groups: independent sample t-test.*: P<0.05, **: P<0.001. ADC, apparent diffusion coefficient; FA, fractional anisotropy; Dslow, slow diffusion; Dfast, fast diffusion; PF, perfusion fraction
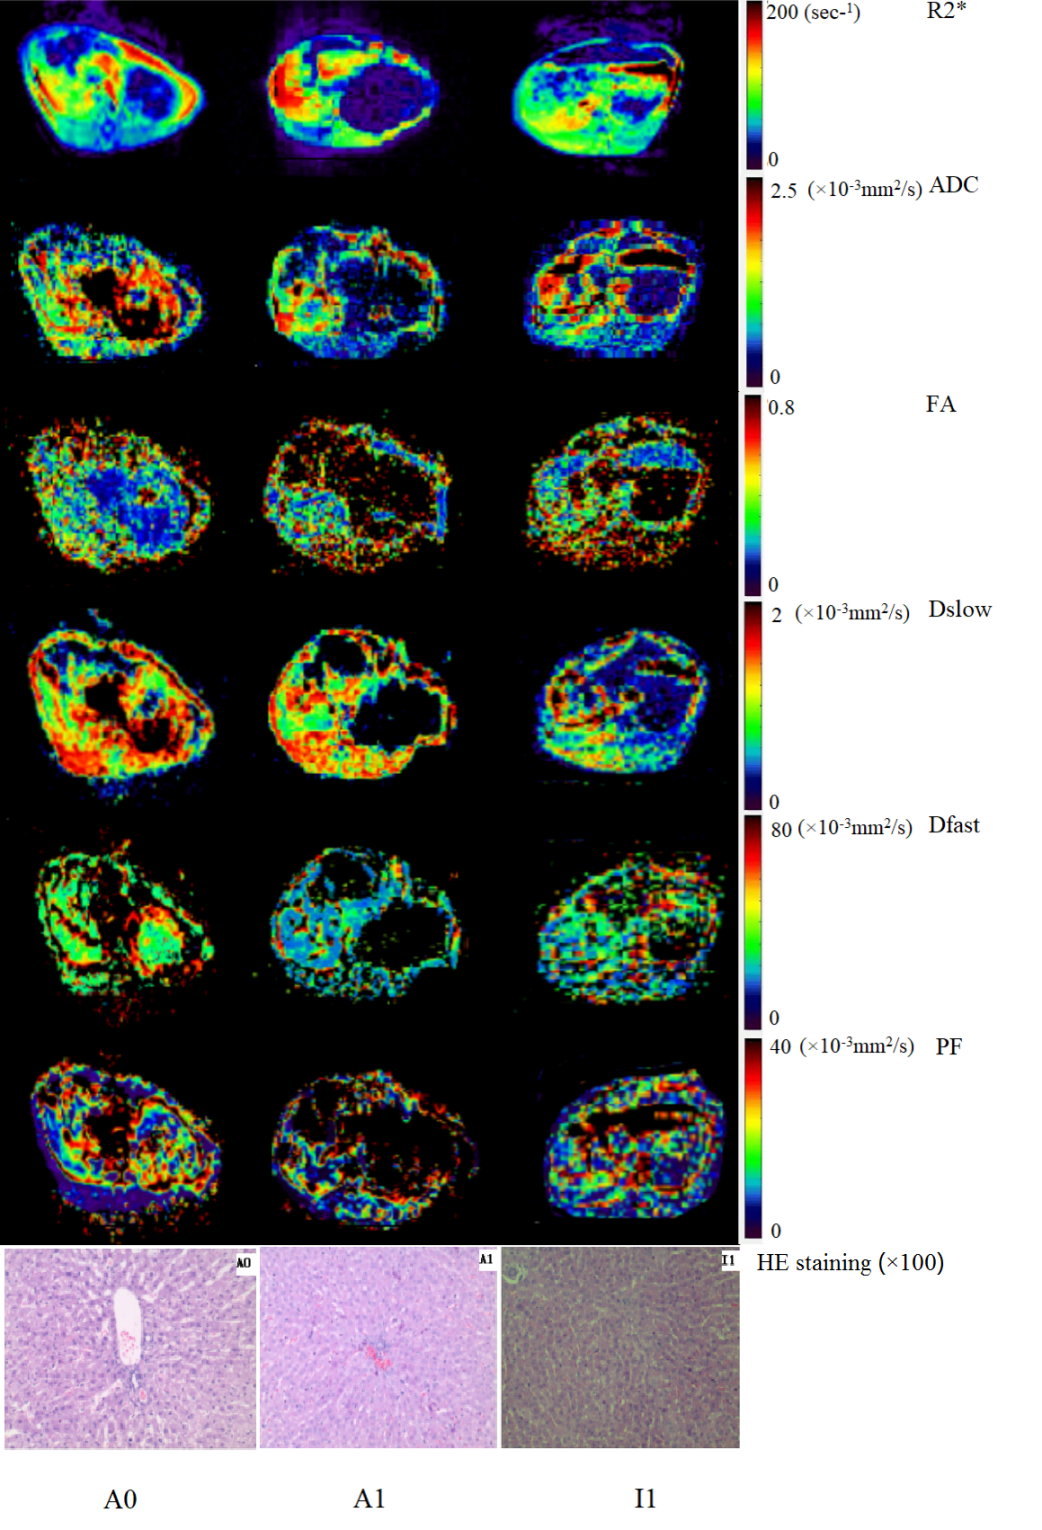
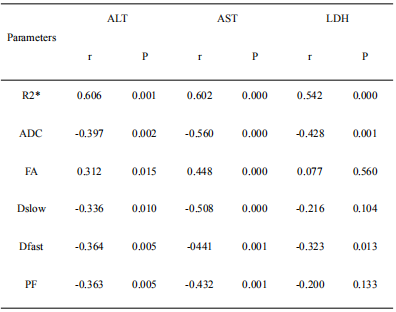
Table 3: Correlation analysis between the biochemical indices and MRI parameters
ADC, apparent diffusion coefficient; FA, fractional anisotropy; Dslow, slow diffusion; Dfast, fast diffusion; PF, perfusion fraction