2478
Simultaneous T1 and Fat Fraction Quantification using Multi-Echo Radial Look-Locker Imaging
Mahesh Bharath Keerthivasan1, Xiaodong Zhong2, Marcel Dominik Nickel3, David Garcia4, Maria Altbach4, Berthold Kiefer3, and Vibhas Deshpande5
1Siemens Healthcare USA, Tucson, AZ, United States, 2Siemens Healthcare USA, Los Angeles, CA, United States, 3Siemens Healthcare Gmbh, Erlangen, Germany, 4University of Arizona, Tucson, AZ, United States, 5Siemens Healthcare USA, Austin, TX, United States
1Siemens Healthcare USA, Tucson, AZ, United States, 2Siemens Healthcare USA, Los Angeles, CA, United States, 3Siemens Healthcare Gmbh, Erlangen, Germany, 4University of Arizona, Tucson, AZ, United States, 5Siemens Healthcare USA, Austin, TX, United States
Synopsis
Abdominal T1 mapping has been used for the quantification of various pathologies including the characterization of focal liver lesions and liver fibrosis. The presence of fat and iron in the liver act as confounding factors resulting in T1 estimation errors. In this work, we present a multi-echo inversion-recovery radial Look-Locker technique with FLASH readouts for simultaneous T1w, T2* and PDFF quantification. We also propose two fitting strategies to generate water-only T1 estimates from the acquired data. Performance of the method is evaluated on phantoms and in vivo results are presented.
Introduction
Abdominal T1 mapping has been used for the quantification of various pathologies including the characterization of focal liver lesions and liver fibrosis1-5. However, presence of fat and iron in the liver act as confounding factors resulting in T1 estimation errors and necessitating the need for techniques to overcome the effect of fat and estimate water-only T1 (T1w) values.Techniques have been proposed that make either make use of separate proton density fat fraction (PDFF) estimates6 or employ multi-echo acquisition schemes7,8 to compute T1w. While these methods have been proposed for breath-held abdominal imaging, they have a reduced slice efficiency and the use of Cartesian sampling schemes makes them more sensitive to motion artifacts. Moreover, the use of separate PDFF quantification sequences to obtain estimates of T1w makes the technique susceptible to mis-registration while also increasing the overall scan time.
In this work, we present a multi-echo inversion-recovery radial Look-Locker technique with FLASH readouts for simultaneous T1, T2* and PDFF quantification. We also propose two fitting strategies to generate water-only T1 estimates from the acquired data. Performance of the method is evaluated on phantoms and in vivo results are presented.
Materials and Methods
Multi-Echo Radial Look-LockerFigure 1 shows the proposed pulse sequence and data sampling scheme for a multi-echo inversion recovery radial Look-Locker technique. Following inversion preparation, the magnetization curve is sampled continuously using radial readouts at different TEs. The acquired radial spokes for each TE are grouped together to generate under-sampled k-space data which are reconstructed using a tiered view-sharing approach9. Thus data acquired using this technique generates co-registered images at different TEs and inversion times (TI).
Parameter Estimation
The signal at each voxel in an inversion recovery Look-Locker acquisition can be expressed as follows: $$S(TE,TI) = [Mxy_{w}(TI,T1_{w})e^{-TE/T2^*_w} + (Mxy_{f}(TI,T1_f)e^{-TE/T2^*_f } \sum_i C_i e^{2 \pi i f_n TE} )] e^{2\pi \phi TE} [1]$$ Where, $$$Mxy_w$$$ and $$$Mxy_f$$$ are the observed transverse magnetization for the water and fat components and $$$T2^*_w, T2^*_f, T1_w, T1_f$$$ are the T2* and T1 relaxation times for the two components. The model assumes a multi-spectral fat model and $$$\phi$$$ corresponds to the background field. With Look-Locker sampling, the transverse magnetization for each component can be modeled as: $$Mxy_i(TI,T1_i,M_{0i}) = M_{0i} f(T1_i,TI,TE,B1,TR,\alpha) [2]$$
where $$$f(.)$$$ represents the signal evolution over TIs.
The multi-echo signal model in Equation[1] allows two different strategies for parameter estimation(Figure 2):
- Sequential Fitting: Use multi-echo fat water separation algorithms12-14 to estimate PDFF and T2* at each inversion time followed by fitting the water-only signal to generate the T1w map.
- 3-parameter Joint Fitting: Re-formulating Equation[2] as: $$Mxy_i(TI,T1_i,M_{0i}) = M_0 Mxy_{i}(TI_{max}) f(T1_i,TI,TE,B1,TR,\alpha) [3]$$ where, $$$Mxy_{i}(TI_{max}$$$ is the magnetization of individual components at the last TI sampled. A multi-echo fat water decomposition is first performed using the multi-echo data at $$$TI_{max}$$$ to estimate the $$$\phi, T2^*, Mxy$$$ for the two components. Using these values along with Equations [3] and [1] the $$$T1_w,T1_f$$$ and scaling factor $$$M_0$$$ are estimated.
Phantom Imaging
The prototype sequence was tested on a Magnetom Skyra (Siemens Healthcare, Erlangen, Germany) 3T scanner. Quantification accuracy was evaluated using a set of emulsions prepared by combining peanut oil with agarose gel and Gadolinium. Reference values for PDFF and T2* were obtained using a spectroscopic technique15 and a multi-echo Cartesian FLASH (ME-DIXON) sequence respectively. Data were acquired with the radial Look-Locker sequence with: FOV=25cm, base resolution=160, radial views=512, #echoes=6, TEs=[1.32,2.46,3.6,4.74,5.88,7] ms, TR=8.02 ms. Reference T1 values for the phantoms were obtained using a fat suppressed multi-TR spin echo pulse sequence.
In vivo Imaging
Data were acquired on a volunteer after informed consent. Following a spectroscopy acquisition15, a breath-held Cartesian multi-echo sequence was used to obtain reference R2* values. The radial Look-Locker acquisition had the following parameters: FOV=36cm, base resolution=192, radial views=512, #echoes=6, TEs=[1.32,2.46,3.6,4.74,5.88,7] ms, and TR=8.02 ms.
Results
In order to test the effect of inversion preparation on PDFF and R2* quantification, data were acquired using a multi-echo FLASH pulse sequence with and without inversion preparation. Figure 3 shows PDFF and R2* maps from a normal volunteer without any inversion preparation and at TI = 600 ms. The estimated PDFF and R2* values from ROIs in the liver were not statistically different for the two cases, indicating no effect of inversion preparation on PDFF quantification.The Bland-Altman plot in Figure 4(A,B) shows PDFF and R2* values obtained using the multi-echo radial Look-Locker sequence compared to the reference. Note that PDFF estimates are comparable to conventional ME-DIXON. Figure 4(C) shows T1w estimates from the two fitting techniques compared to the multi-TR spin echo reference. We can observe better water-T1 estimates when using the Sequential Fitting approach.
Figure 5 illustrates the proposed technique on a volunteer with 8.3% fat in the liver. Note that the proposed multi-echo Look-Locker acquisition can generate co-registered inversion-weighted water-only images, PDFF, R2*, as well as T1w maps from a single acquisition. An ROI analysis shows mean PDFF of 9.85% from the proposed sequence compared to 9.11% from ME-DIXON. The mean R2* was 43.06s-1 with the multi-echo Look-Locker compared to 41.69s-1 from ME-DIXON.
Conclusion
We present a multi-echo radial Look-Locker pulse sequence along with an efficient fitting algorithm for simultaneous quantification of PDFF, R2*, and T1-water in the liver.Acknowledgements
No acknowledgement found.References
- Ding Y, Rao SX, Zhu T, Chen CZ, Li RC, Zeng MS. Liver fibrosis staging using T1 mapping on gadoxetic acid-enhanced MRI compared with DW imaging. Clinical radiology. 2015 Oct 31;70(10):1096-103.
- Kamimura K, Fukukura Y, Yoneyama T, Takumi K, Tateyama A, Umanodan A, Shindo T, Kumagae Y, Ueno SI, Koriyama C, Nakajo M. Quantitative evaluation of liver function with T1 relaxation time index on Gd‐EOB‐DTPA‐enhanced MRI: Comparison with signal intensity‐based indices. Journal of Magnetic Resonance Imaging. 2014 Oct;40(4):884-9.
- Cassinotto C, Feldis M, Vergniol J, Mouries A, Cochet H, Lapuyade B, Hocquelet A, Juanola E, Foucher J, Laurent F, De Ledinghen V. MR relaxometry in chronic liver diseases: comparison of T1 mapping, T2 mapping, and diffusion-weighted imaging for assessing cirrhosis diagnosis and severity. European journal of radiology. 2015 Aug 1;84(8):1459-65.
- Katsube T, Okada M, Kumano S, Hori M, Imaoka I, Ishii K, Kudo M, Kitagaki H, Murakami T. Estimation of liver function using T1 mapping on Gd-EOB-DTPA-enhanced magnetic resonance imaging. Investigative radiology. 2011 Apr 1;46(4):277-83.
- Banerjee, R., Pavlides, M., Tunnicliffe, E. M., Piechnik, S. K., Sarania, N., Philips, R., Collier, J. D., Booth, J. C., Schneider, J. E., Wang, L. M., Delaney, D. W., Fleming, K. A., Robson, M. D., Barnes, E., … Neubauer, S. (2014). Multiparametric magnetic resonance for the non-invasive diagnosis of liver disease. Journal of hepatology, 60(1), 69-77.
- Ferenc E. Mozes, Elizabeth M. Tunnicliffe, Ahmad Moolla, Thomas Marjot, Christina K. Levick, Michael Pavlides, Matthew D. Robson, Mapping tissue water T1 in the liver using the MOLLI T1 method in the presence of fat, iron and B0 inhomogeneity, NMR in BioMedicine, DOI: 10.1002/nbm.4030
- Benjamin Leporq & Hélène Ratiney & Frank Pilleul, Olivier Beuf. Liver fat volume fraction quantification with fat and water T1 and T2* estimation and accounting for NMR multiple components in patients with chronic liver disease at 1.5 and 3.0 T, Eur Radiol (2013) 23:2175–2186 [
- Richard B Thompson, Kelvin Chow , and Justin Grenier. Simultaneous Proton Density Fat Fraction Imaging and Water T1-Mapping with Low B1+ Sensitivity (PDFF-T1). Proceedings of the ISMRM #0035, 2018
- Maria I. Altbach, Ali Bilgin, Zhiqiang Li, Eric W. Clarkson, Theodore P. Trouard, and Arthur F. Gmitro. Prcessing of Radial Fast Spin-Echo Data for Obtaining T2 Estimates from a Single K-Space Data Set. Magn. Reson. Med. 54:549-559 (2005)
- Felix Lugauer, Jens Wetzl, Christoph Forman, Manuel Schneider, Berthold Kiefer, Joachim Hornegger, Dominik Nickel, Andreas Maier, Single‑breath‑hold abdominal T1 mapping using 3D Cartesian Look‑Locker with spatiotemporal sparsity constraints, Magnetic Resonance Materials in Physics, Biology and Medicine (2018) 31:399–414
- Shao, J., Rapacchi, S., Nguyen, K. L., & Hu, P. (2016). Myocardial T1 mapping at 3.0 tesla using an inversion recovery spoiled gradient echo readout and bloch equation simulation with slice profile correction (BLESSPC) T1 estimation algorithm. Journal of Magnetic Resonance Imaging, 43(2), 414-425.
- Hu, H. H., Kim, H. W., Nayak, K. S., & Goran, M. I. (2010). Comparison of fat–water MRI and single‐voxel MRS in the assessment of hepatic and pancreatic fat fractions in humans. Obesity, 18(4), 841-847.
- Yu, Huanzhou, Ann Shimakawa, Catherine DG Hines, Charles A. McKenzie, Gavin Hamilton, Claude B. Sirlin, Jean H. Brittain, and Scott B. Reeder. "Combination of complex‐based and magnitude‐based multiecho water‐fat separation for accurate quantification of fat‐fraction." Magnetic resonance in medicine 66, no. 1 (2011): 199-206.
- Hernando, Diego, P. Kellman, J. P. Haldar, and Z‐P. Liang. "Robust water/fat separation in the presence of large field inhomogeneities using a graph cut algorithm." Magnetic Resonance in Medicine: An Official Journal of the International Society for Magnetic Resonance in Medicine 63, no. 1 (2010): 79-90.
- Sharma P, Martin DR, Pineda N, Xu Q, Vos M, Anania F, Hu X: Quantitative analysis of T2-correction in single-voxel magnetic resonance spectroscopy of hepatic lipid fraction. J Magn Reson Imaging 2009, 29(3):629-635. PMID: 19243059.
Figures
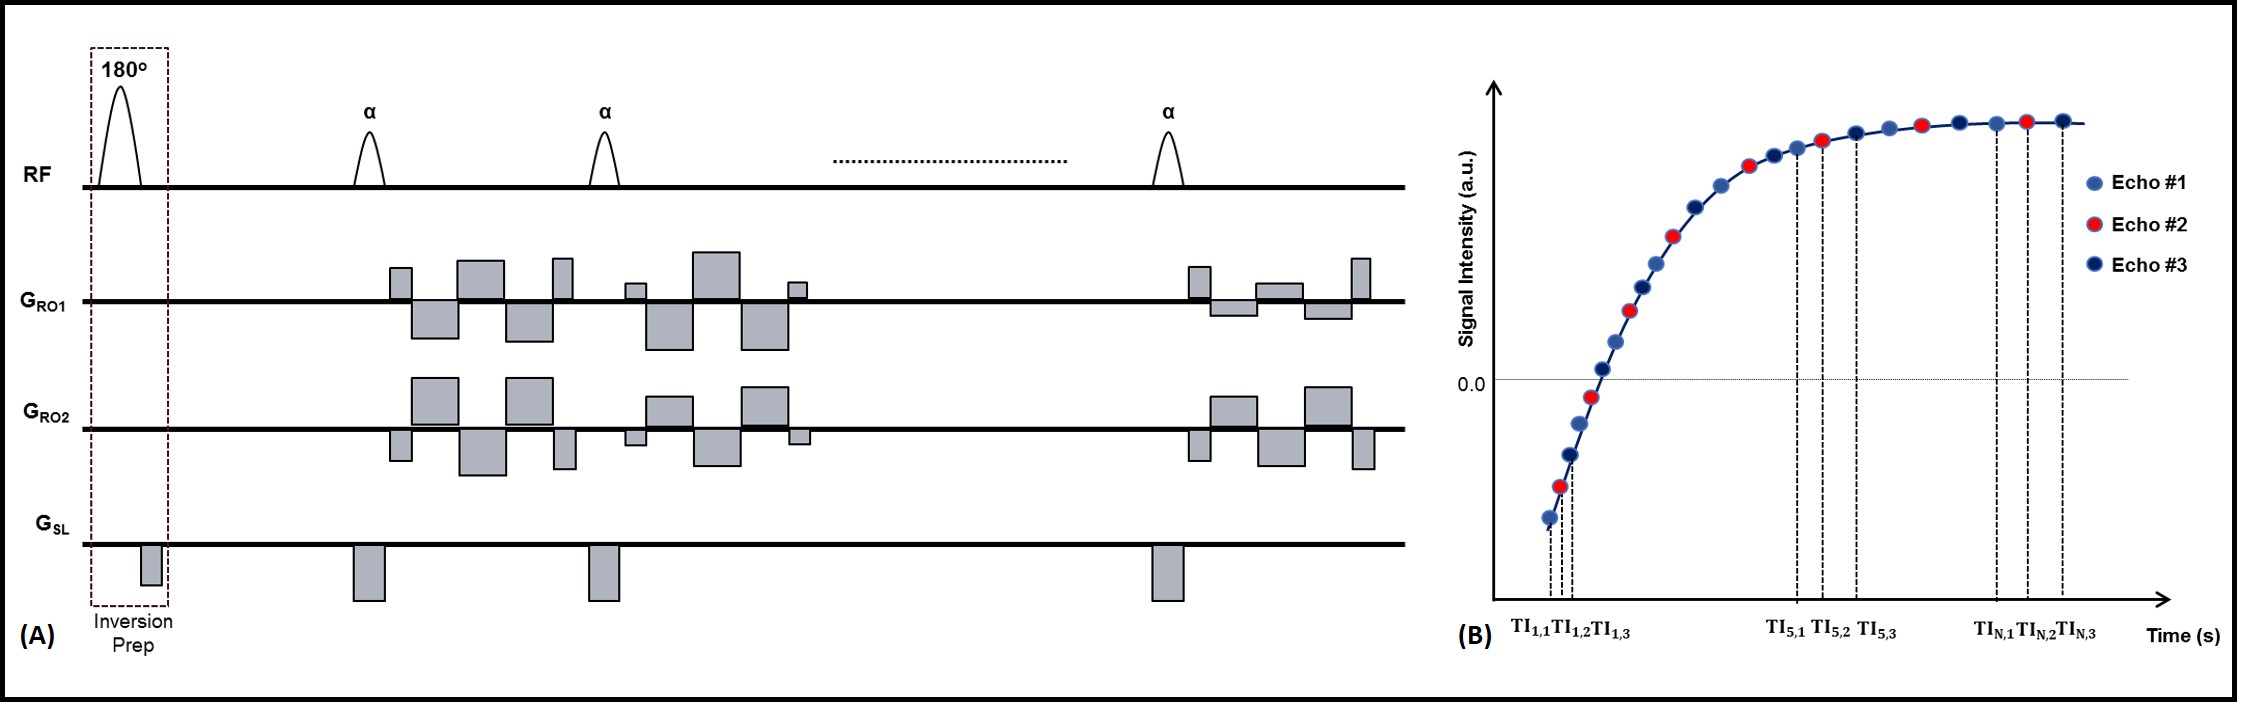
(A)
Pulse sequence diagram and (B) sampling scheme for a multi-echo radial
Look-Locker T1 Mapping technique.
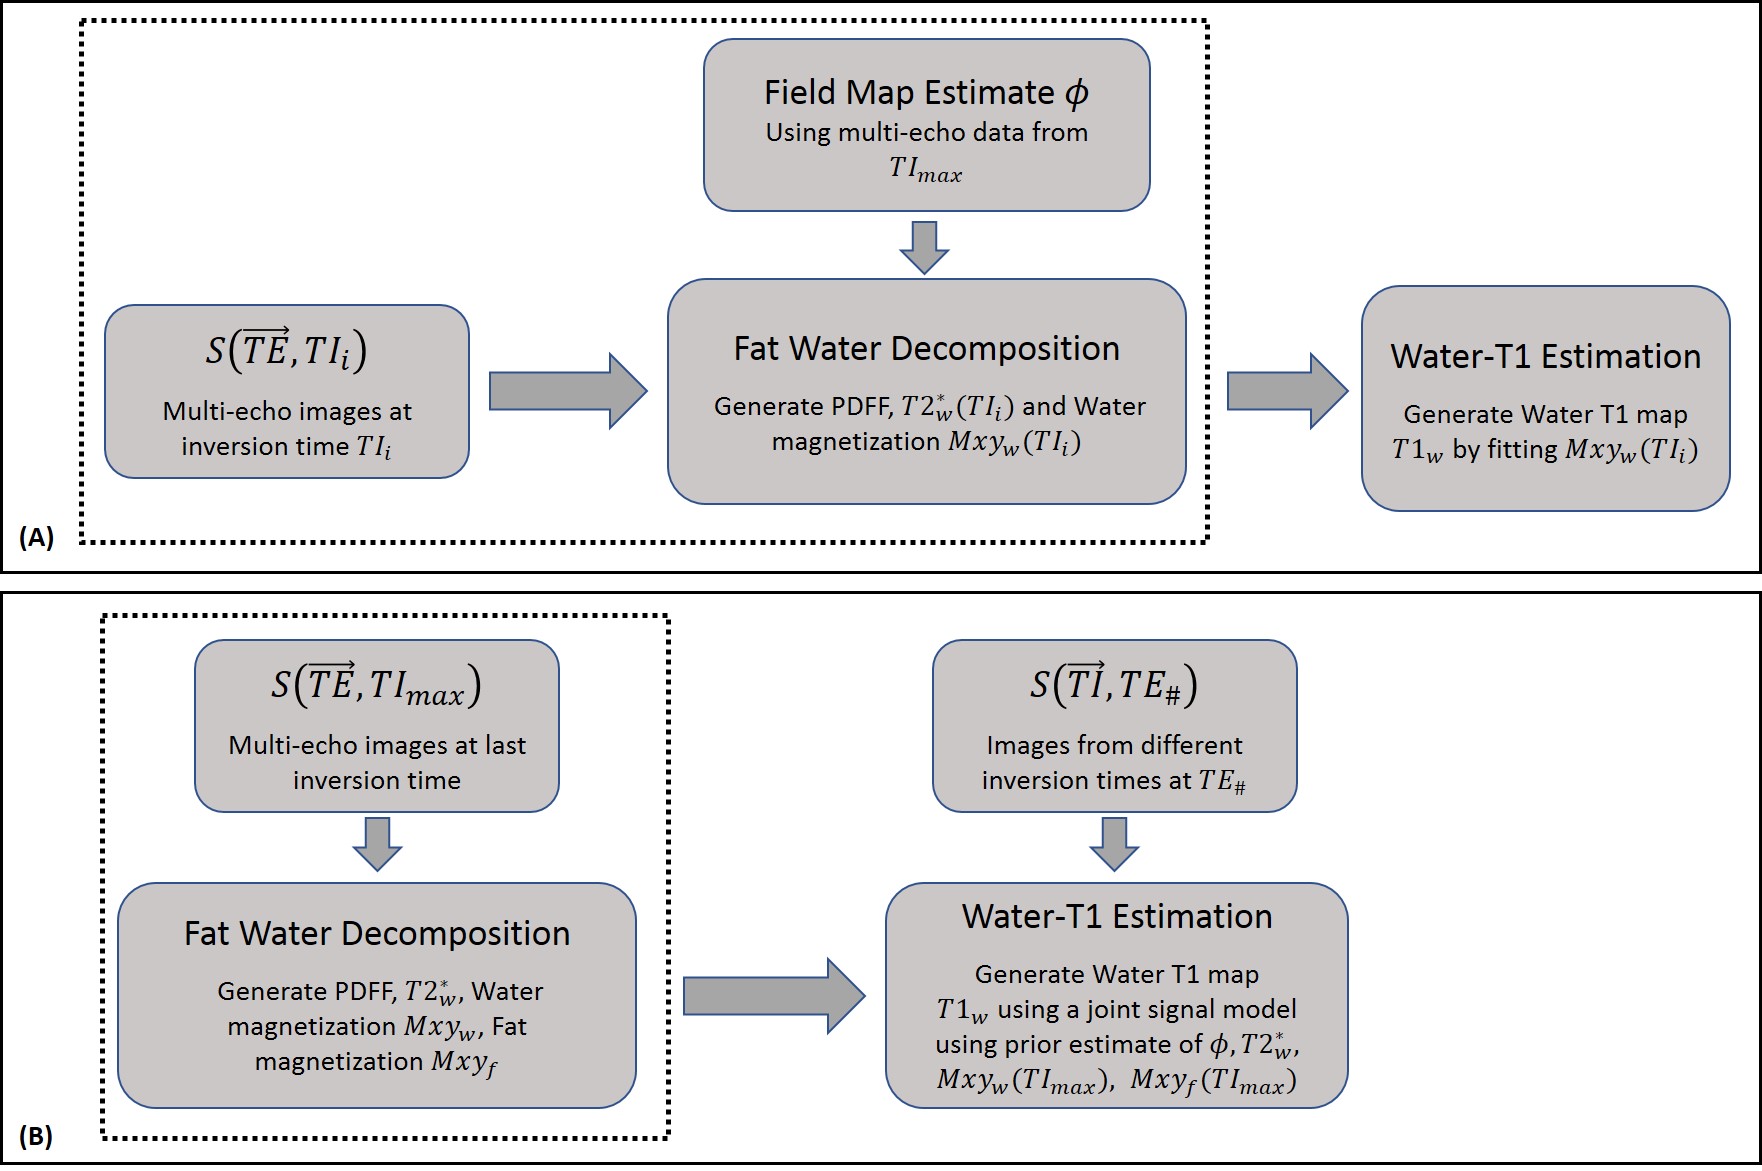
Water-T1 Estimation: (A) A sequential fitting approach that first estimates the water component at each point in the inversion recovery curve. This is followed by fitting the water signal to compute a T1 map. (B) A joint fitting scheme that uses T2* and PDFF estimates from the last TI as priors for T1w estimation using Equation [1]
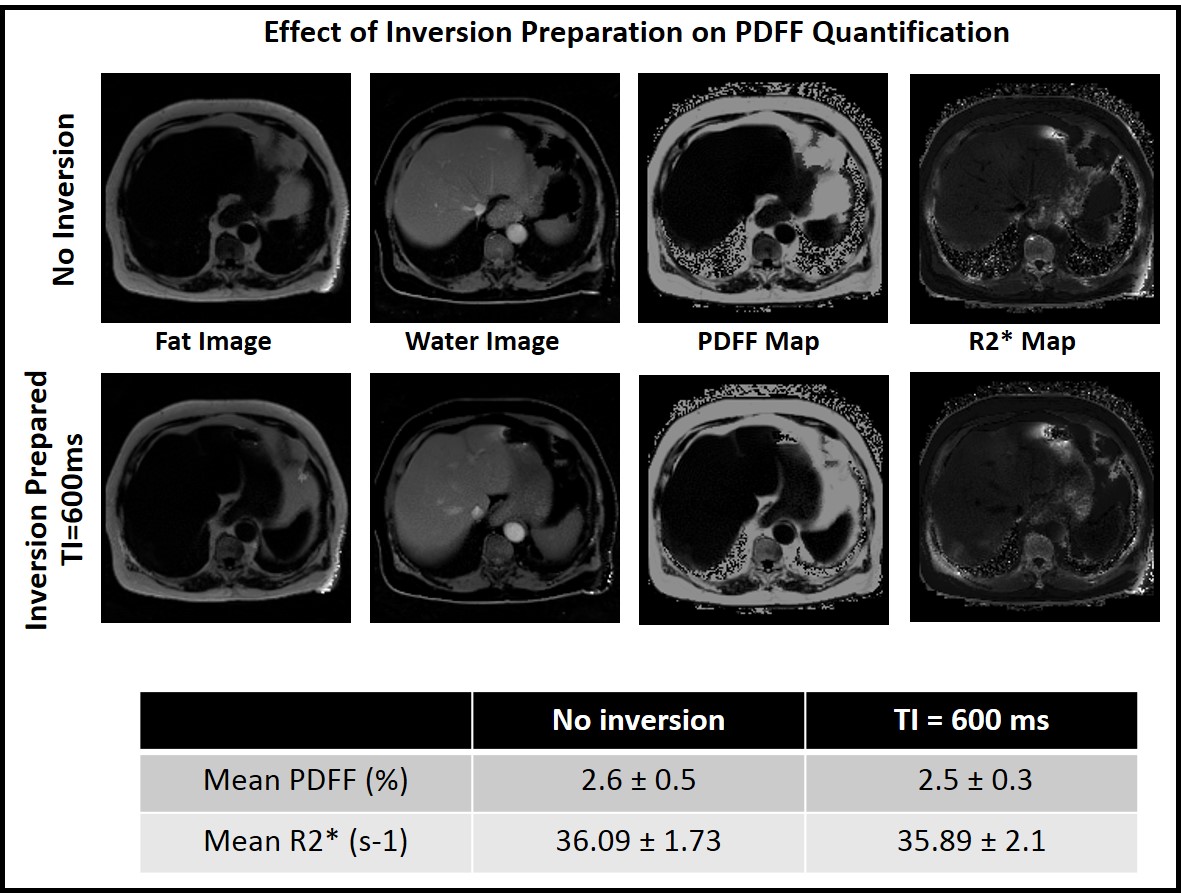
Effect of inversion preparation on PDFF and R2* quantification. PDFF
and R2* maps from a normal volunteer without any inversion preparation and at
TI = 600 ms. The estimated PDFF and R2* values from ROIs in the liver were not
statistically significant for the two cases, indicating no effect of inversion
preparation on fat water quantification accuracy.
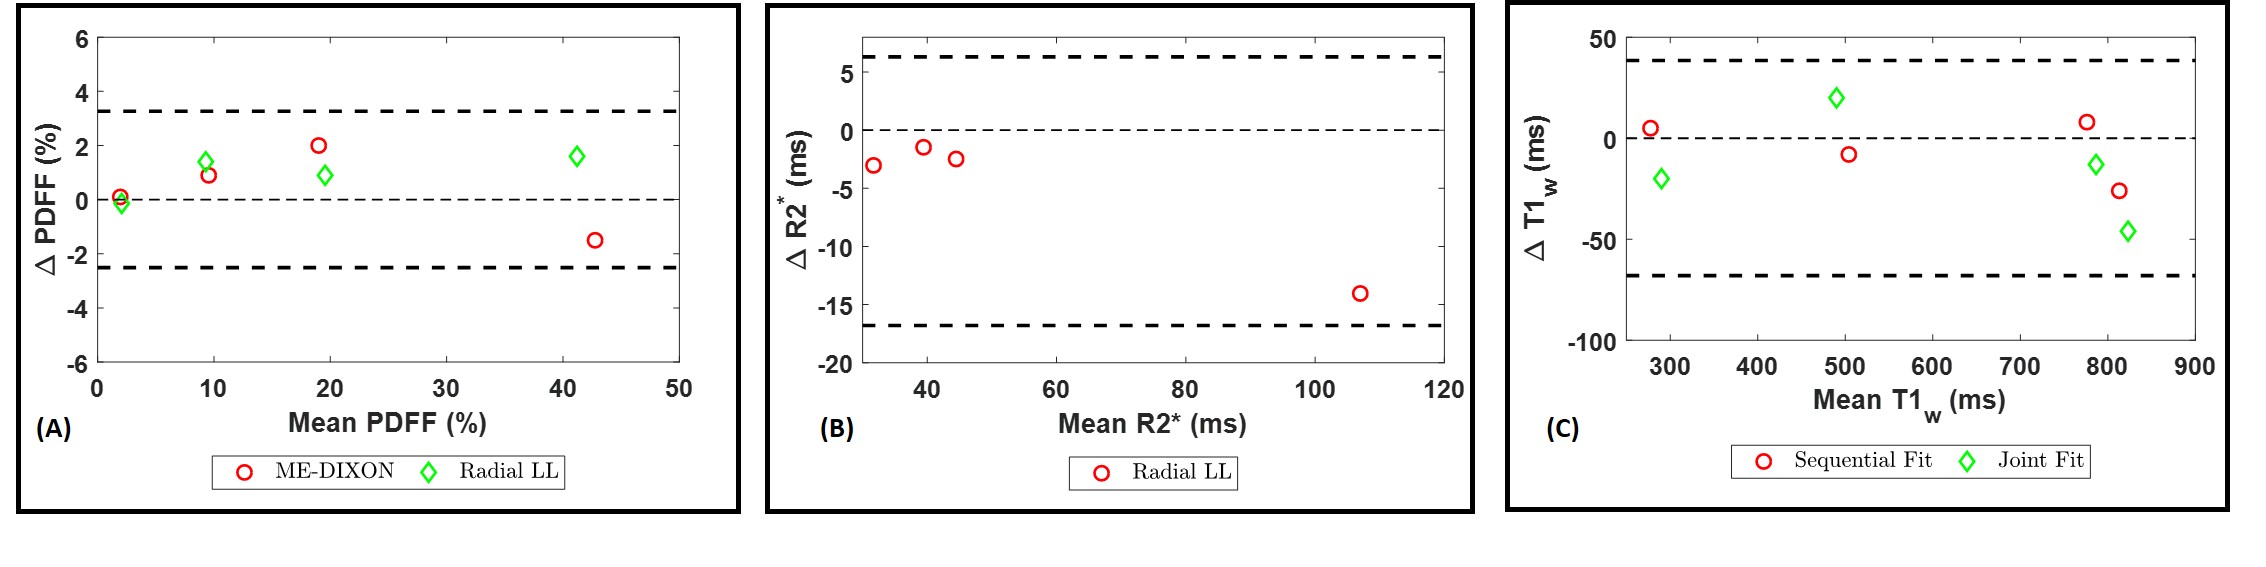
Bland-Altman plots show the mean error in (A) PDFF and (B) R2* estimates from the multi-echo
radial Look-Locker sequence compared to the reference. (C) T1w
estimates from the two fitting techniques compared to the spin echo reference.
We can observe better water-T1 estimates when using the Sequential Fitting
approach.
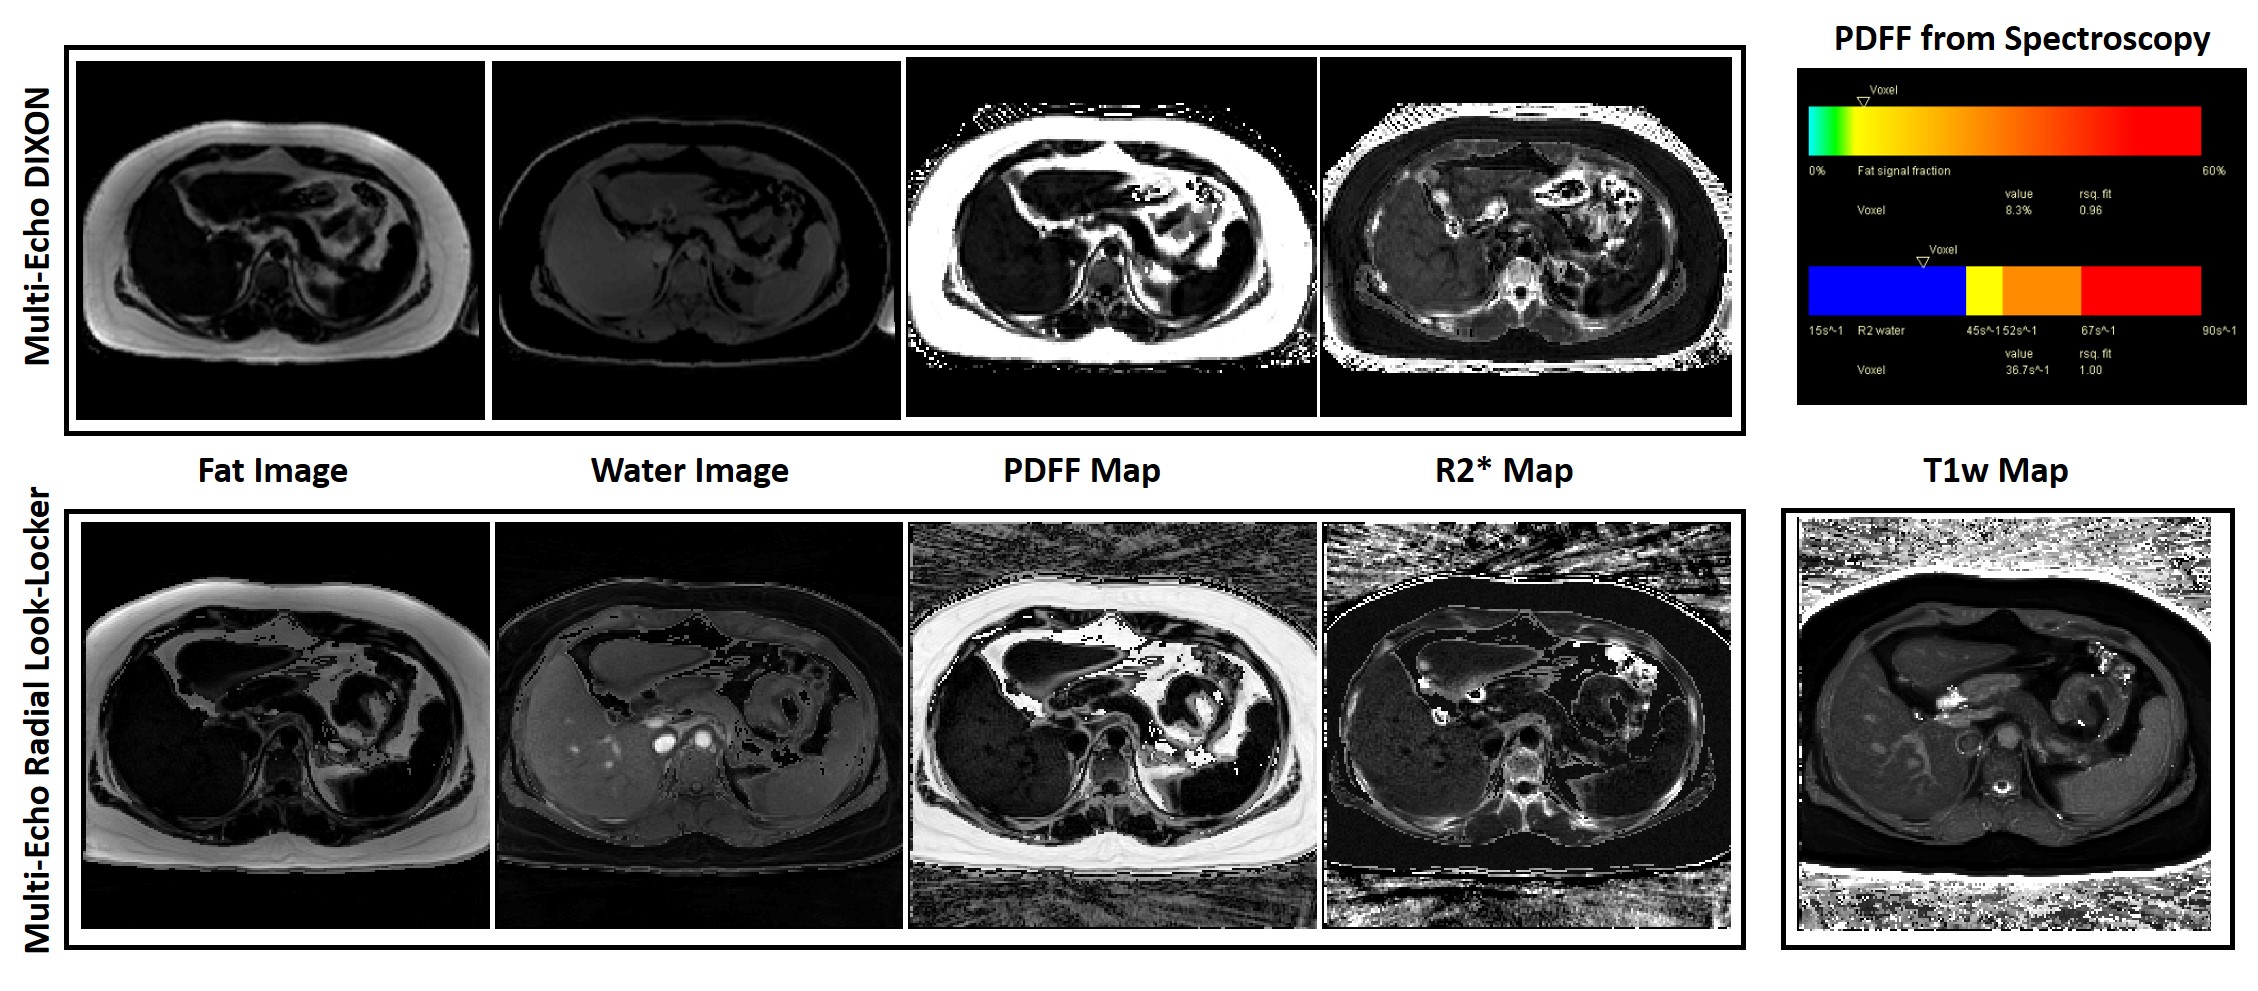
Fat-only, Water-only, PDFF and R2* images from the proposed technique compared to conventional ME-DIXON for a volunteer with 8.3% fat
in the liver. Note that the multi-echo Look-Locker acquisition also generate co-registered T1 maps in addition to the other images. ROI analysis shows comparable estimates from the proposed technique and ME-DIXON.