2475
The value of texture analysis of multiple high b-values DWI in distinguishing different types of hepatic malignant tumors1The First Affiliated Hospital of Dalian Medical University, Dalian, China, 2Philips Healthcare, Beijing, China
Synopsis
In the current study, texture analysis of multiple high b-values DWI was demonstrated to be capable to identify primary hepatic cancer and hepatic metastases, which provided abundant quantitative information that may facilitate clinical management. The results showed that texture features based on b800 and b2000 DWI images was the optimal strategy to identify different types of hepatic malignant tumors (b800: sensitivity 92.0%, specificity 84.2%; b2000: sensitivity 84.0%, specificity 94.7%).
Purpose
To investigate the value of texture features based on multiple high b-values diffusion-weighted imaging (DWI) images in differentiation of primary hepatic cancer (hepatocellular carcinoma (HCC) and intrahepatic cholangiocarcinoma (ICC)) and hepatic metastases.Introduction
Liver is one of the most predilection sites of metastases. Primary liver cancer is one of the most common hepatic malignant tumors, mainly consisted of hepatocellular carcinoma (HCC) and intrahepatic cholangiocarcinoma (ICC). In most cases, it can be differentiated for primary hepatic cancer and hepatic metastases according to clinical history and typical imaging signs. However, there are some overlapping MRI features between the two kinds of tumors, which represent a diagnostic challenge. Multiple high b-values DWI, with the ability to separate pure diffusion movement and perfusion, was found to be more powerful in discriminating different types of hepatic malignant tumors [1]. Texture analysis is a new image analysis method, which has been used for malignant tumor grade or prognosis evaluations [2,3,4]. Multiple high b-values DWI texture analysis, which reflects the subtle microscopic changes of pathology and tumor heterogeneity [5]. We hypothesize that it’s feasible to identify primary hepatic cancer and hepatic metastases by multiple high b-values DWI texture features based strategy.Materials and Methods
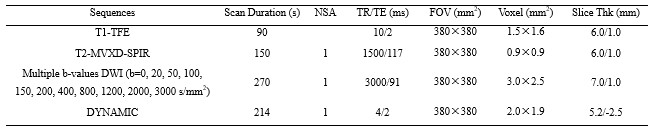
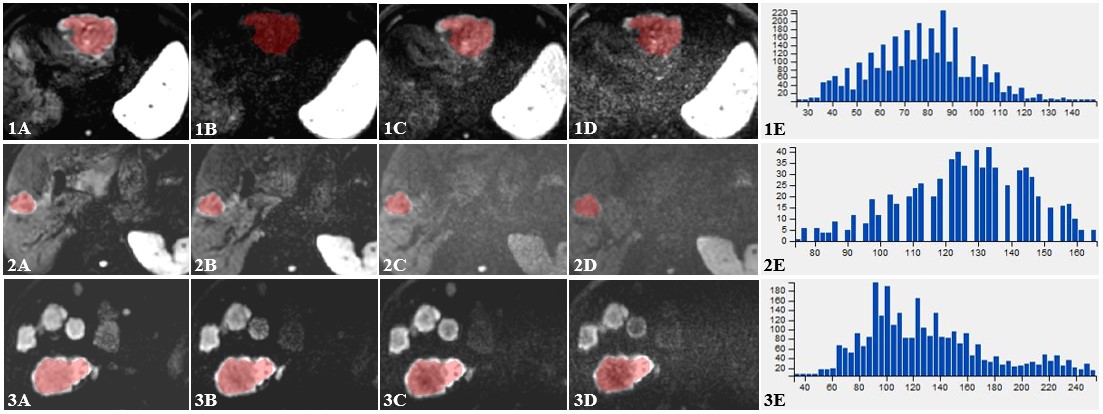
The retrospective study enrolled 31 patients (44 lesions) from April 2019 to October 2019 who were pathologically or follow-up imaging confirmed as HCCs (n=20, 17 male, 3 female, (56.20±9.73) years old), ICCs (n=5, 2 male, 3 female, (65.80±7.36) years old), or HM (n=6, 4 male, 2 female, (59.50±7.82) years old, 19 lesions), respectively. The primary hepatic cancer (PHC) group included HCCs and ICCs, and the other group was hepatic metastases (HM) group. All patients have underwent preoperative MR examinations at 3.0T (Ingenia CX, Philips, Holland), including T1WI, T2WI, dynamic contrast-enhanced MR imaging and additional multiple b-values DWI sequence (b values = 0, 20, 50, 100, 150, 200, 400, 800, 1200, 2000, 3000 (s/mm2)). Detailed MR scanning parameters were shown in Table 1. We exported the multiple high b-values DWI images (b value = 800, 1200, 2000, 3000 (s/mm2), respectively) as DICOM formats from the intelli-space portal (ISP) workstation. Then, we imported the images to Omni-Kinetics software (GE Healthcare) for image analysis and measurement. On the four high b-values DWI images, we reviewed the MR images and manually outlined the region of interests (ROIs) which enclosed the boundary of target lesions on the largest slice of the tumor, respectively (shown in Figure 1). Then, texture features were generated automatically, which consisted of MinIntensity, MaxIntensity, stdDeviation, Variance, MeanDeviation, RelativeDeviation, skewness, kurtosis, uniformity, GreyLevelNonuniformity and RunLengthNonuniformity. Data analyses were performed using SPSS 20.0 statistical software. Independent sample t test or Mann-Whitney U test was used for above texture parameters. Diagnostic performance was evaluated by receiver operating characteristic (ROC) analysis, and combined diagnosis was evaluated by logistic regression. Differences in the ROC curves were compared by using the Delong test.Results
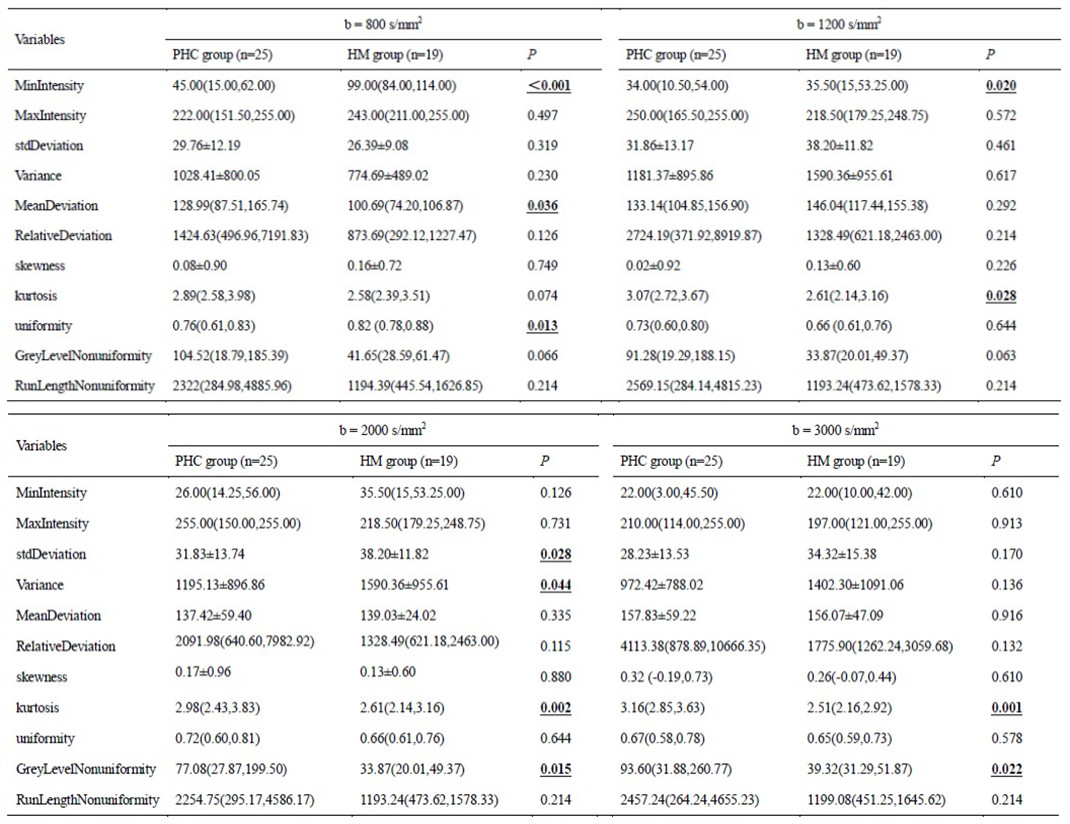
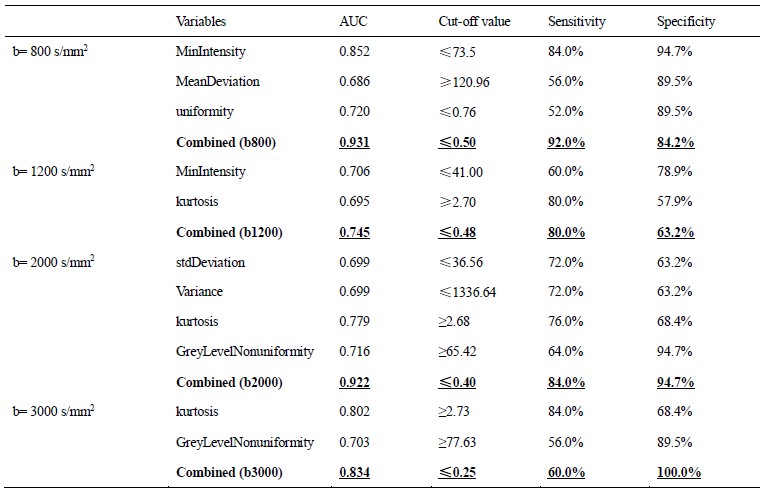
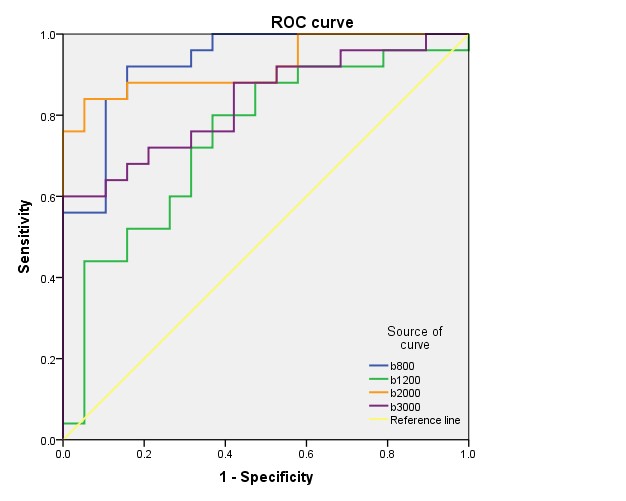
A significant difference was observed in three, two, four, and two texture features of multiple high b-values DWI images (b values = 800, 1200, 2000 and 3000 (s/mm2), respectively) between the PHC and HM groups, the results were shown in Table 2. The remaining features were not statistically different (P>0.05, Table 2). For DWI images which high b-values were 800, 1200, 2000 and 3000 s/mm2, the combined AUC integrating multiple texture features were 0.931, 0.745, 0.922, and 0.834, respectively. Compared with b1200 DWI image, the combined AUC of DWI images (b values = 800 and 2000 (s/mm2), respectively) was higher (P = 0.0252 and 0.0405, respectively). Results indicated that texture features based on b800 and b2000 DWI images was the optimal strategy to identify different types of hepatic malignant tumors (b800: sensitivity 92.0%, specificity 84.2%; b2000: sensitivity 84.0%, specificity 94.7%, were shown in Table 3 and Figure 2).Discussion and Conclusion
When b value was 800 s/mm2, the uniformity of PHC group was lower than that of the HM group. When b value was 1200 s/mm2, the kurtosis in PHC group was higher than that of the HM group. When b values were 2000 and 3000 s/mm2, the Grey Level nonuniformity in PHC group was higher than that of the HM group. These results implied a more heterogeneous nature of the primary tumors, probably due to the necrosis and hemorrhage. We found that based on high b values (b = 800 and 2000 s/mm2) DWI images, the optimal differentiation between the two diseases (b800: combined AUC 0.931, sensitivity 92.0%, specificity 84.2%; b2000: combined AUC 0.922, sensitivity 84.0%, specificity 94.7%) was obtained. In the current study, we proposed a multiple high b-values DWI based texture strategy to preoperatively identify PHC and HM, which will provide a more promising method for tumor differentiation in clinic and facilitate clinical management.Acknowledgements
No acknowledgement found.References
[1] Qin Y, Yu X, Hou J, et al. Predicting chemoradiotherapy response of nasopharyngeal carcinoma using texture features based on intravoxel incoherent motion diffusion-weighted imaging. Medicine (Baltimore). 2018, 97(30): e11676.
[2] Suo ST, Chen XX, Fan Y, et al. Histogram analysis of apparent diffusion coefficient at 3.0 T in urinary bladder lesions: correlation with pathologic findings. Acad Radiol, 2014, 21(8): 1027-1034.
[3] Ma X, Zhao X, Ouyang H, et al. Quantified ADC histogram analysis:a new method for differentiating mass-forming focal pancreatitis from pancreatic cancer. Acta Radiol, 2014, 55(7): 785-792.
[4] Woo S, Cho JY, Kim SY, et al. Histogram analysis of apparent diffusion coefficient map of diffusion-weighted MRI in endometrial cancer: a preliminary correlation study with histological grade. Acta Radiol, 2014, 55(10): 1270-1277.
[5] Li H, Zhang J, Zheng Z, et al. Preoperative histogram analysis of intravoxel incoherent motion (IVIM) for predicting microvascular invasion in patients with single hepatocellular carcinoma. Eur J Radiol. 2018, 105: 65-71.
Figures