2472
Comparison of Mono-, Bi-, and Stretched Exponential Diffusion-weighted MR Imaging in Differentiating Hepatic Hemangiomas and Liver Metastases1Radiology, Gifu University, Gifu, Japan, 2Philips Japan, Tokyo, Japan
Synopsis
Intravoxel incoherent motion, a bi-exponential model of diffusion-weighted imaging with multiple b values, can represent pure molecular diffusion and perfusion, and be used in characterizing focal hepatic lesions. Recently, stretched exponential model has been used in several cancers. In this study, we evaluated the feasibility of stretched exponential model for differentiating hepatic hemangiomas and liver metastases. Our results showed that DDC value from a stretched exponential model was the highest diagnostic potential, so it could be a quantitative imaging biomarker for differentiating hepatic hemangiomas and liver metastases.
Purpose
To compare the diagnostic values of mono-exponential, bi-exponential, and stretched exponential diffusion-weighted imaging (DWI) in differentiating hepatic hemangiomas and liver metastases.Materials and Methods
This prospective study was approved by our institutional review board and written informed consent was obtained. Two hundred forty-seven patients with suspected liver disease underwent magnetic resonance (MR) imaging. Among them, 22 hepatic hemangiomas in 19 patients and 42 liver metastases in 18 patients were identified, respectively. MR imaging was performed using 3-T MR system (Ingenia 3.0T CX, Philips Healthcare). DWI was obtained using free-breathing two-dimensional fat-suppressed single-shot echo-planar sequence (repetition time/echo time, 5,000/57 msec; matrix, 96 × 96; field of view, 40 × 32 cm; parallel imaging factor, 2.0; b factors, 0, 10, 25, 50, 75, 100, 200, 500 and 800 s/mm2; section thickness, 6 mm with 1-mm intersection gap; acquisition time for 30 sections, 4 min 15 s). A radiologist measured the DWI parameters of hepatic lesions greater than 10 mm in maximum diameter using home-built SW (Diffusion analysis software, EXPRESS 2.0, Philips Healthcare, Korea), including the apparent diffusion coefficient (ADC) from a mono-exponential model, the true diffusion coefficient (D), pseudo-diffusion coefficient (D*) and perfusion fraction (f) from a bi-exponential model, and the distributed diffusion coefficient (DDC) and water molecular diffusion heterogeneity index (α) from a stretched exponential model. The Mann-Whitney U test was conducted to compare all DWI parameters between hepatic hemangiomas and liver metastases. Areas under the receiver-operating-characteristic (ROC) curve (AUCs) were compared to assess the diagnostic values in differentiating hepatic hemangiomas and liver metastases. A P value of less than 0.05 was considered to be significant.Results
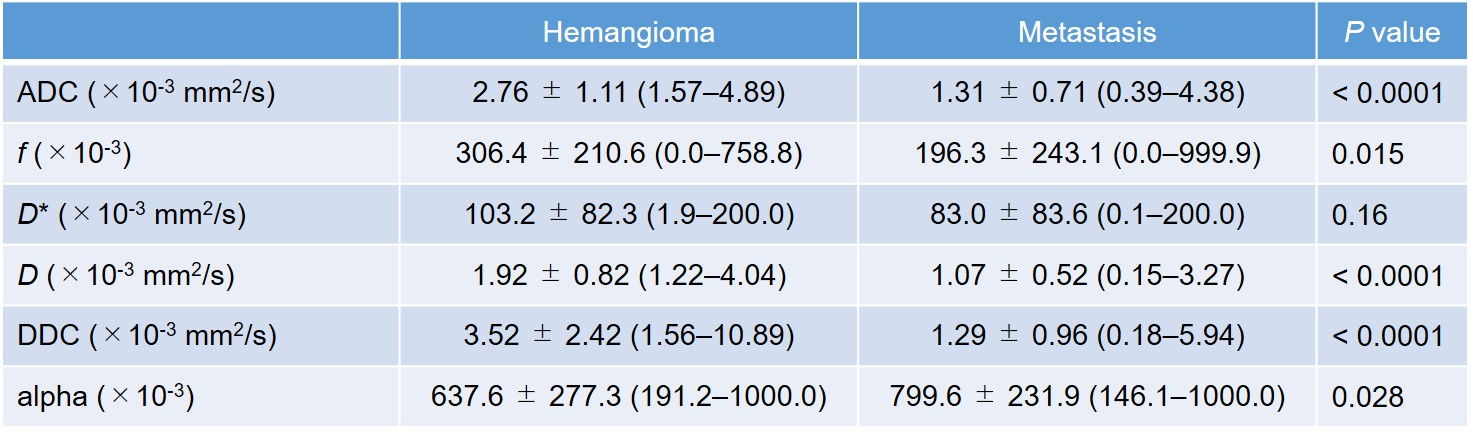
ADC, D, f, and DDC values were significantly lower in liver metastases than in hepatic hemangiomas (P < 0.0001, < 0.0001, 0.015, and < 0.0001, respectively) and α value was significantly higher in liver metastases than in hepatic hemangiomas (P = 0.028) (Table). The AUCs of ADC, D, f, DDC, and α values were 0.952, 0.907, 0.690, 0.952, and 0.668, respectively. The AUCs of ADC and DDC values were significantly greater than that of D (P < 0.0001), f (P = 0.001), and α values (P = 0.001).Discussion
This study demonstrated that the DDC value from a stretched exponential model had the highest diagnostic potential and showed comparable with ADC value for differentiating hepatic hemangiomas and liver metastases. A stretched exponential model characterizes non-Gaussian behavior of molecular diffusion and reflects the degree of intravoxel heterogeneity of biological tissue1. The DDC value reflects a continuous distribution of diffusion coefficients from each diffusion compartment. In our study, DDC value was significantly lower in liver metastases than in hepatic hemangiomas. The reduction of DDC value represents the destruction of a higher density of cells and stroma, resulting in the restriction of the water in the tissue. The ADC value was lower than DDC in normal tissue, on the other hand, higher than DDC in cancer2. Thus, the gap of ADC values between normal and cancer tissue would be smaller than DDC. Actually, in our data, the gap of mean DDC values between hepatic hemangiomas and liver metastases was larger than that of ADC values (2.23 × 10⁻³ mm2/s in DDC vs 1.45 × 10⁻³ mm2/s in ADC). The AUCs for differentiating hepatic hemangiomas and liver metastases were comparable between DDC and ADC values at this time. We could confirm the above phenomenon, however, we believe that DDC value may have more potential to distinguish hepatic hemangiomas and liver metastases than ADC value in larger cases. In conclusion, ADC and DDC values provided by mono-exponential and stretched exponential models could be a quantitative imaging biomarker for differentiating hepatic hemangiomas and liver metastases.Acknowledgements
The authors of this manuscript declare no relationships with any companies whose products or services may be related to the subject matter of the article.References
[1] Bennett KM, Schmainda KM, Bennett RT, Rowe DB, Lu H, Hyde JS. Characterization of continuously distributed cortical water diffusion rates with a stretched-exponential model. Magnetic resonance in medicine : official journal of the Society of Magnetic Resonance in Medicine / Society of Magnetic Resonance in Medicine 2003;50(4):727-34.
[2] Liu X, Zhou L, Peng W, Wang H, Zhang Y. Comparison of stretched-Exponential and monoexponential model diffusion-Weighted imaging in prostate cancer and normal tissues. J Magn Reson Imaging 2015;42(4):1078-85.
Figures