2469
Early Effect of 90Y locoregional therapy on tumor and liver parenchyma stiffness measured with MR elastography: initial experience
Paul Kennedy1,2, Sara Lewis3, Octavia Bane1,2, Stefanie Hectors1,2,4, Edward Kim5, and Bachir Taouli1,2
1BioMedical Engineering and Imaging Institute, Icahn School of Medicine at Mount Sinai, New York, NY, United States, 2Department of Diagnostic, Molecular and Interventional Radiology, Icahn School of Medicine at Mount Sinai, New York, NY, United States, 3Radiology, Icahn School of Medicine at Mount Sinai, NY, NY, United States, 4Department of Radiology, Weill Cornell Medicine, New York, NY, United States, 5Diagnostic, Molecular and Interventional Radiology, Icahn School of Medicine at Mount Sinai, NY, NY, United States
1BioMedical Engineering and Imaging Institute, Icahn School of Medicine at Mount Sinai, New York, NY, United States, 2Department of Diagnostic, Molecular and Interventional Radiology, Icahn School of Medicine at Mount Sinai, New York, NY, United States, 3Radiology, Icahn School of Medicine at Mount Sinai, NY, NY, United States, 4Department of Radiology, Weill Cornell Medicine, New York, NY, United States, 5Diagnostic, Molecular and Interventional Radiology, Icahn School of Medicine at Mount Sinai, NY, NY, United States
Synopsis
In this study we assess early changes following 90Y radioembolization (RE) in hepatocellular carcinoma and liver parenchyma using MR elastography and predict response at 6 weeks/6 months. Tumor stiffness (TS) and liver stiffness (LS) adjacent to the tumor were significantly increased 6w following RE. Baseline TS and LS adjacent to the tumor were significantly lower in patients who achieved complete response. Baseline TS correlated with necrosis at 6w and was a significant predictor of partial response or stable disease based on mRECIST criteria following RE. MR elastography may be a useful tool for predicting necrosis and tumor response to RE.
Introduction
Locoregional therapy such as Yttrium 90 radioembolization (RE) has been used to successfully downstage HCC tumors and act as a bridge to liver transplantation1 in advanced cases unsuitable for resection. Post-treatment effects include perivascular edema, inflammation, extracellular matrix remodeling and hepatic fibrosis2,3. These changes are likely to have an effect on the mechanical microenvironment and may be measurable as a change in tissue stiffness. The aim of the current study was to quantify the change in tumor and liver parenchyma stiffness secondary to RE by imaging before and 6 weeks (6w) following treatment, and determine the value of pretreatment stiffness measurement for assessing tumor response and degree of necrosis at 6w and 6 months (6m).Methods
In this prospective IRB approved study 23 patients with untreated HCC referred for RE (M/F 18/5, mean age 68.3±9.3 y, range 55-93 y) underwent the research protocol at baseline, with 20 of those also imaged at 6w post RE. The mean duration between baseline MR imaging and RE was 37±25 days (range 3-117 days) with follow up imaging occurring 42±2 days (range 39-47 days) after RE. Baseline and follow-up imaging was performed on a 1.5 T MRI system (MAGNETOM Aera, Siemens Healthcare, Erlangen, Germany). 2D MRE data at 60Hz were acquired using a prototype spin-echo echo planar imaging (SE-EPI) sequence. 10 axial slices were acquired centered over the index lesion. Acquired 2D MRE data were reconstructed inline using a commercially available 2D multi-model direct inversion (MMDI) algorithm4. An MR physicist with 4 years’ experience drew ROIs around the index lesion, the liver parenchyma immediately adjacent to the lesion site (a 2 cm circular region around the lesion where possible avoiding vessels and staying 1cm away from the liver capsule) and in liver parenchyma remote to the treated liver segment/lobe on the MRE magnitude images using ImageJ software. Stiffness change and percentage stiffness change with respect to the baseline were determined for tumor (TS), and liver parenchyma (LS) near tumor and remote liver parenchyma. Treatment response was assessed from 6w and 6m clinical follow-up following RE by an abdominal radiologist with 8 years’ experience. Degree of tumor necrosis was determined from subtracted post-contrast 3D T1-weighted images. Treatment response was also based on modified response evaluation criteria in solid tumors (mRECIST). Differences in TS and LS (near tumor and remote LS) pre and post RE were tested for significance using Wilcoxon signed rank tests. Spearman correlation analysis was used to determine significant relationships between MRE parameters, tumor size, degree of necrosis at follow-up and mRECIST classification. ROC analysis was used to determine the accuracy of MRE in predicting response.Results
Mean tumor size at baseline was 3.6±1.7 cm (range 1.5 - 6.3 cm). At 6w follow-up, 17/23 tumors exhibited PR (n=6) or CR (n=11) with 6 classified as SD based on mRECIST criteria. 6m clinical follow-up imaging was available in 13 patients who did not undergo interval retreatment. All tumors exhibited CR (n=10) or PR (n=3) at 6m. MRE failed pre and post RE in 3 cases with full datasets not available in 6 further cases.Example pre and post RE images are shown in Figure 1. At baseline, mean LS remote to the tumor and LS adjacent to tumor were not significantly different from TS (5.42±2.06 vs 4.52±1.33 vs. 5.41±2.58 kPa, p=0.562). TS pre RE was found to significantly correlate with tumor diameter (r=0.746, p=0.001; Figure 2).
Mean TS (5.41±2.58 kPa vs 7.06±3.85 kPa, p=0.016) and LS adjacent to the tumor (4.52±1.33 vs 5.70±2.07 kPa, p=0.039) were significantly increased following RE while LS remote to the tumor was unchanged (Table 1, Figure 3). Baseline LS adjacent to tumor (p=0.021) and TS (p=0.023) were found to be significantly lower in patients that achieved CR at 6w post RE (Figure 4). TS at baseline was found to significantly correlate with percentage of tumor necrosis at 6w (r=-0.580, p=0.015, Figure 2). TS and LS adjacent to the tumor were not predictors of CR, however they were good predictors of PR or SD (AUC=0.841, p=0.023 and AUC=0.857, p=0.021 respectively). At 6m clinical follow-up baseline TS and LS adjacent to tumor were still strong predictors of non CR outcomes although these results did not reach statistical significance (AUC=0.905, p=0.053 and AUC=0.857, p=0.087 respectively).
Discussion
These results suggest TS and LS adjacent to the tumor are significantly elevated following RE and are predictors of non CR outcomes at 6w. Our results are discordant to previous animal5,6 and human studies7 which report decreased tumor stiffness following locoregional therapy. Our study differs from the human study in that it is prospective with pre and post RE measures and has a shorter interval between RE and imaging (42 vs 84 days). The animal studies were imaged 1-4 days post therapy and used different cancer types and treatments than our study.Conclusion
The results indicate mechanical properties of tumor tissue and surrounding liver parenchyma change significantly early after RE therapy. Baseline TS and LS may be useful markers for prediction of response and necrosis at 6w.Acknowledgements
This research was supported by NCI grant U01 CA172320. Many thanks to Bradley D. Bolster Jr, Stephan Kannengiesser and Michael Bush from Siemens Healthcare for providing the prototype sequence for use at our institution and their technical support.References
- Kulik LM, Atassi B, van Holsbeeck L, et al. Yttrium-90 microspheres (TheraSphere) treatment of unresectable hepatocellular carcinoma: downstaging to resection, RFA and bridge to transplantation. J Surg Oncol 2006;94(7):572-586.
- Barker HE, Paget JT, Khan AA, Harrington KJ. The tumour microenvironment after radiotherapy: mechanisms of resistance and recurrence. Nat Rev Cancer 2015;15(7):409-425.
- Ibrahim SM, Nikolaidis P, Miller FH, et al. Radiologic findings following Y90 radioembolization for primary liver malignancies. Abdom Imaging 2009;34(5):566-581.
- Silva AM, Grimm RC, Glaser KJ, et al. Magnetic resonance elastography: evaluation of new inversion algorithm and quantitative analysis method. Abdom Imaging 2015;40(4):810-817.
- Pepin KM, Chen J, Glaser KJ, et al. MR elastography derived shear stiffness—a new imaging biomarker for the assessment of early tumor response to chemotherapy. Magnetic Resonance in Medicine 2014;71(5):1834-1840.
- Li J, Jamin Y, Boult JKR, et al. Tumour biomechanical response to the vascular disrupting agent ZD6126 in vivo assessed by magnetic resonance elastography. Br J Cancer 2014;110(7):1727-1732.
- Gordic S, Ayache JB, Kennedy P, et al. Value of tumor stiffness measured with MR elastography for assessment of response of hepatocellular carcinoma to locoregional therapy. Abdom Radiol 2017:1-10.
Figures

Figure 1: 76y female patient with cryptogenic liver
disease pre (top) and 6w post RE (bottom). ROIs for tumor (white), adjacent
liver tissue (black) and remote liver (red) are shown. Top: T1w imaging highlights
untreated HCC (arrows). TS=4.06±0.78 kPa. Bottom: T1w imaging 6w post RE shows 100%
necrotic lesion and perfusion changes during HBP (arrow). TS=7.99±1.25 kPa. LS adjacent to tumor increased 2.25±0.63 kPa to 6.73±1.37 kPa while LS away from tumor was unchanged.
Note spleen stiffness appears increased post RE as spleen MRE was acquired
simultaneously unlike the baseline scan.
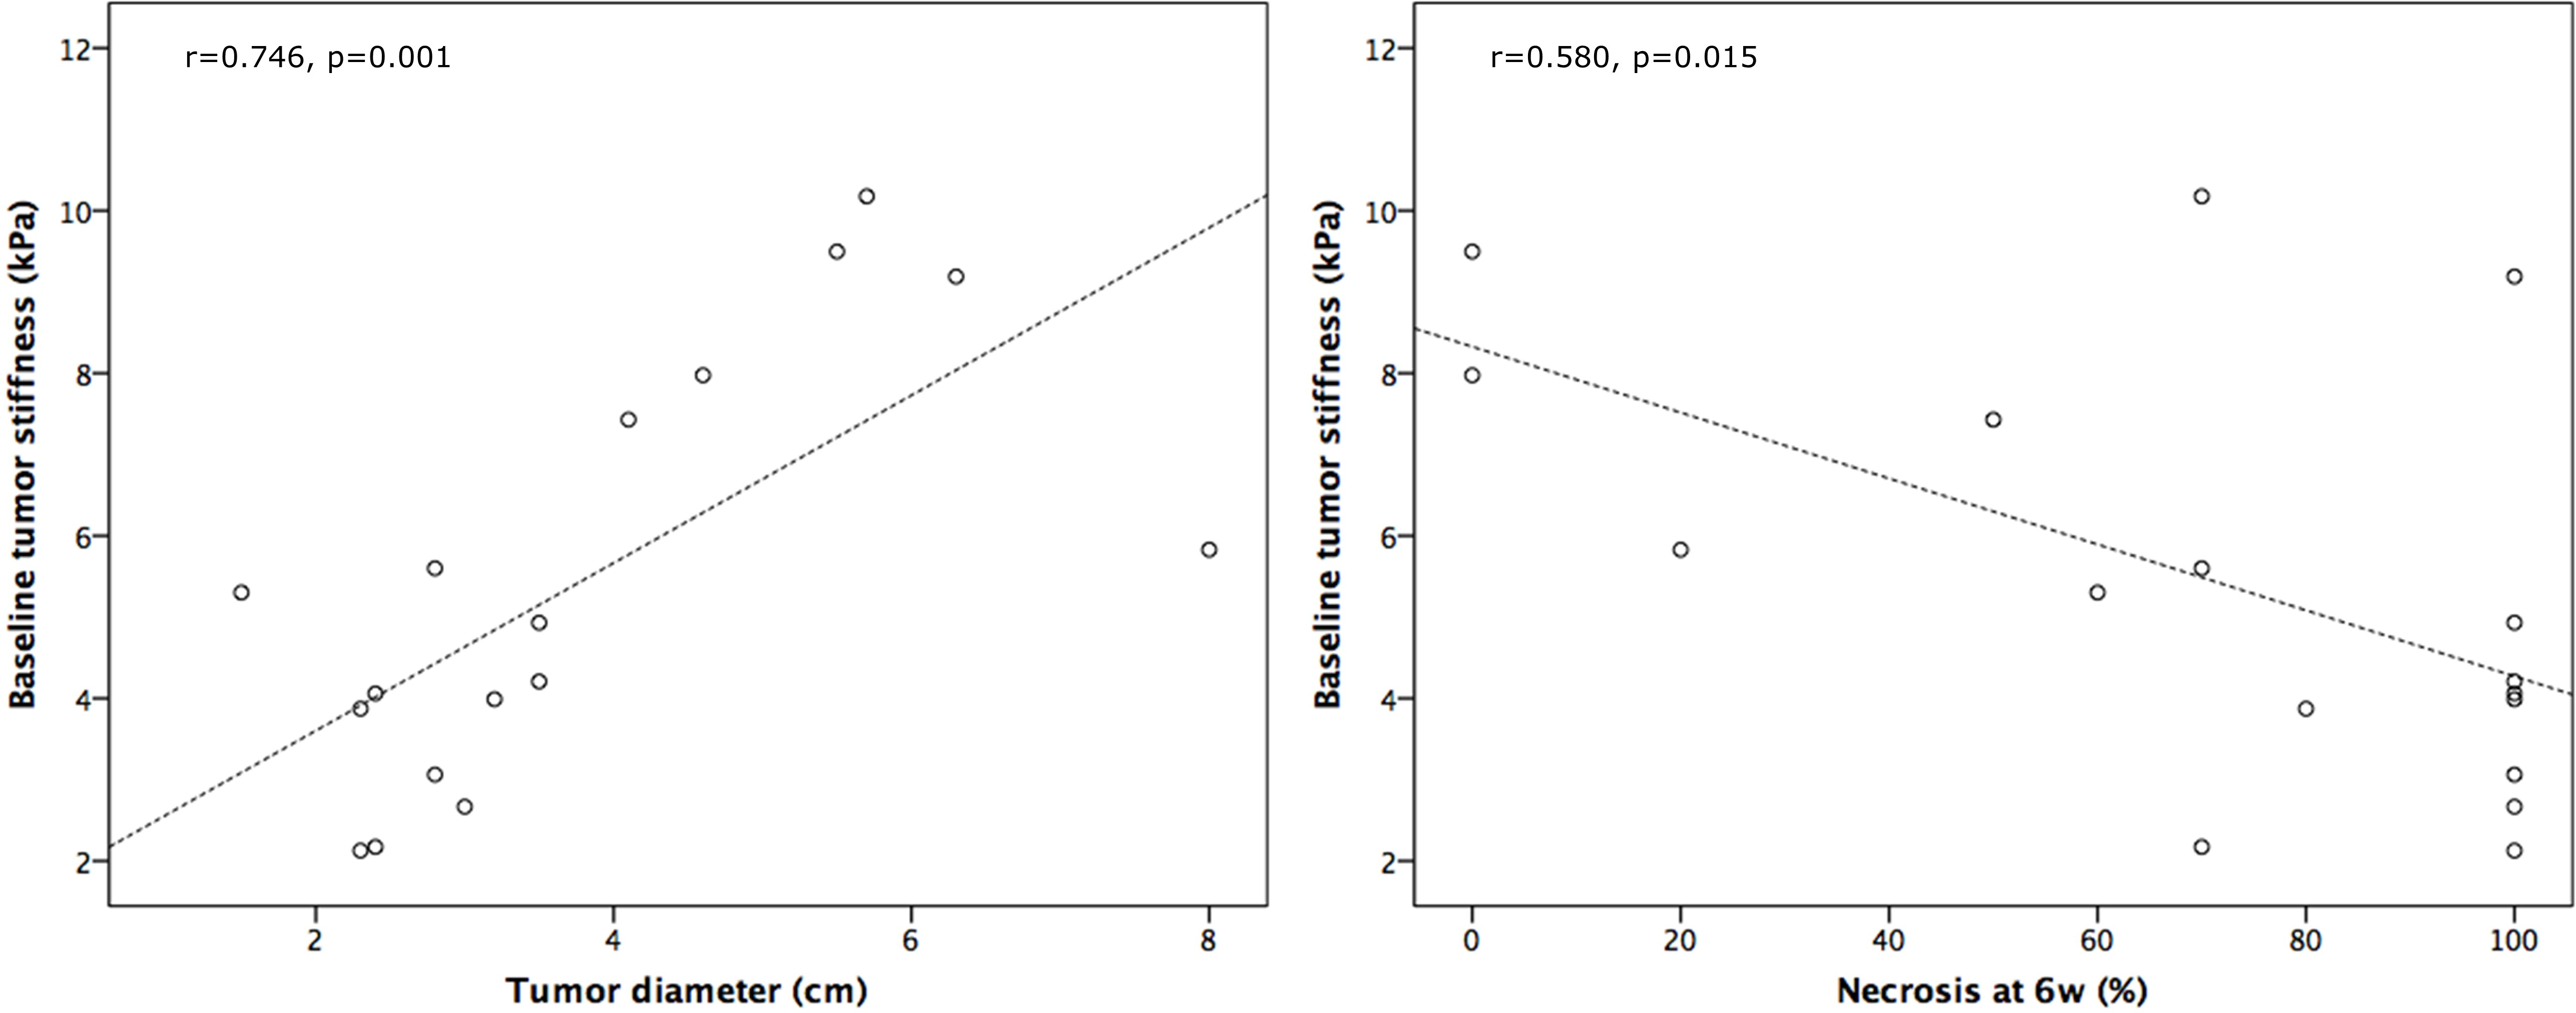
Figure 2: Scatter
plots illustrating the significant correlation between baseline tumor
stiffness and tumor diameter (left) and degree of necrosis at 6w (right).
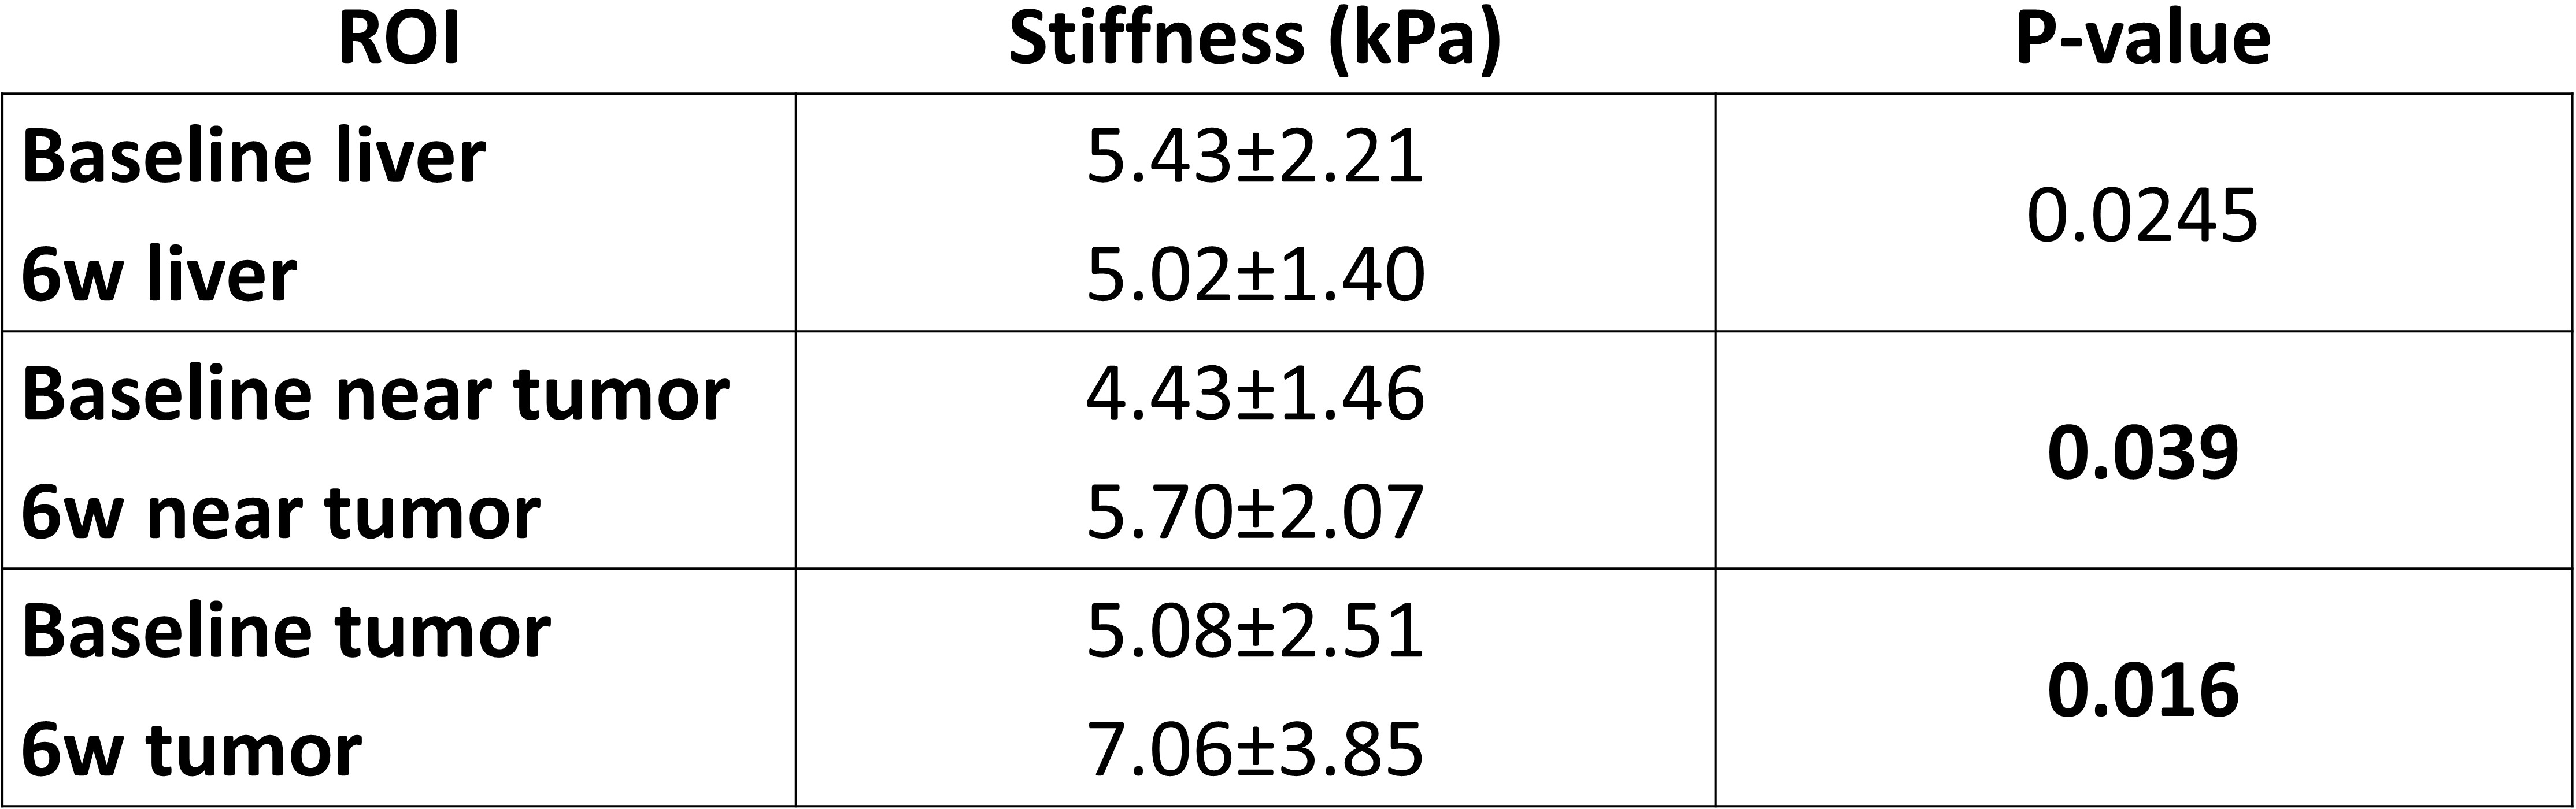
Table 1: MRE values of LS remote to the tumor, LS adjacent to the tumor and TS pre and post RE. P-values from Wilcoxon signed rank tests are also shown illustrating significant changes post RE in LS adjacent to the tumor and TS.

Figure 3: Linked
plots showing changes in stiffness of liver parenchyma (left), liver parenchyma
adjacent to tumor (middle) and tumor (right) following RE. Patients with tumors
classified as SD at 6w are highlighted in orange.

Figure 4: Boxplots illustrating
significantly lower baseline TS and LS adjacent to the tumor in patients who
achieved CR at 6w compared to those classified as PR or SD.