2464
Is renal blood supply a predictor of protein synthesis in the kidney? A preliminary study in the healthy population
Lihua Chen1, Ailian Liu1, Jiangzheng Wang2, Zhiwei Shen2, Qingwei Song1, Renwang Pu1, and Nan Wang1
1The First Affiliated Hospital of Dalian Medical University, Dalian, China, 2Philips Healthcare, Beijing, China
1The First Affiliated Hospital of Dalian Medical University, Dalian, China, 2Philips Healthcare, Beijing, China
Synopsis
3D amide proton transfer weighted (APTw) MR imaging is a novelcontrast-agent-free MRI technique for detection of amide protons in mobile cellular proteins and peptides 1-3.On the other hand, 3D pseudo-continuous arterial spin labeling (3D-pCASL)is amethod to measure renal blood supply and hence potentially a metric for renal function. This study reveals a close association between the vascularity and concentration of mobile cellular proteins in kidney.
Introduction
There remains a demand of on-invasive, practical, and robust methods to measure renal functions in clinical scenarios. 3D amide proton transfer weighted (APTw) MR imaging is a novel contrast-agent-free MRI technique for detecting amide protons in mobile cellular proteins and peptides 1-3. Recently, APTw imaging has been intensively investigated in varying abdominal applications4-5. However, there has been no research on the connection between APTw imaging and3D pseudo-continuous arterial spin labeling (3D-pCASL) in the kidney, while the latter is another functional imaging technique that provides clues on kidney vascularization and hence potentially renal metabolism [6].The purpose of this study is to explore the correlation betweenAPTw and 3D pCASL in kidney function evaluation.Methods
Thirteen healthy volunteers (mean age 28.92±4.84 (24-41) years; 6 males, 7 females) were recruited, written inform consent obtained, and underwent 3D APT and 3D-pCASLimaging of kidney on a 3.0T MR scanner (IngeniaCX; Philips Healthcare, the Netherlands). An extra T2w sequence was scanned to confirm the absence of any visible lesions. The scanning parameters were detailed in Table 1. With reference to the fusion of T2w images and APTw images and the fusion ofT2w images and pCASL imagesonIntelli Space Portal (Ingenia CX, Philips Healthcare, the Netherlands), circle ROIs were manually drawn by two radiologists (independently)on the renalcortex and medulla in three slices of APTw images (the slice covering the largest dimension of kidney and its adjacent (6mm apart) upper and lower slices) on the right kidney(Figure 1). ROI sizes for cortex and medulla are 10 mm2 and 30 mm2, respectively. The average APTw values [5] and cerebral blood flow (CBF) of pCASL were calculated to minimize measurement bias. The consistencies of renal cortex and medulla measurement between the two observers were tested using intra-class correlation coefficients (ICC) in SPSS 22.0 (IBM). The average value of measurement data was selected for follow-up statistical analysis. The value between right renal cortex and medulla was compared by t test.Results
Measurements by the two observers were in good agreement (Table 2, cortex APT: ICC = 0.847, medullarenis APT:ICC = 0.880, cortex CBF:ICC = 0.884, medullarenis CBF:ICC = 0.879).APTw values of renal cortex was significant higher than that of medullarenis (1.82±0.83%, 1.28±0.91%, P<0.01), and CBF values of renal cortex was significant higher than that of medullarenis (195.87±88.44, 99.00±69.68, P<0.01).There was no connection between APTw and CBF values in both renal cortex and medullarenis (P>0.05).Discussion and Conclusion
APTw and pCASL imaging were proven to yield reproducible quantitative measurements on healthy kidneys in different regions, with excellent agreements between independent observers. In addition, both APT and CBF values were different between renal cortex and medullarenis. There was no connection between the perfusion and amide protons in mobile cellular proteins and peptides in kidney, implying that the slight variation of renal blood supply among healthy population may have no significant effects in protein synthesis in the kidney. This finding may not hold for kidney malfunction patients, considering a larger variation in kidney blood supply in different regions, which needs to be verified in a further study with relatively large sample size.Acknowledgements
No acknowledgement found.References
[1]. Zhou J, Heo HY, Knutsson L, et al. APT-weighted MRI: Techniques, current neuro applications, and challenging issues.J MagnReson Imaging. 2019; 50(2):347-364.
[2] Li B, Sun H, Zhang S, et al. Amide proton transfer imaging to evaluate the grading of squamous cell carcinoma of the cervix: A comparative study using 18F FDG PET. Magn Reson Imaging: 2019, 50(1): 261-268.
[3] Takayama Y, Nishie A, Sugimoto M, et al. Amide proton transfer (APT) magnetic resonance imaging of prostate cancer: comparison with Gleason scores. MAGMA. 2016, 29(4): 671-679.
[4] Lawu BKH, King AD, Ai QY, et al. Head and Neck Tumors: Amide Proton Transfer MRI. Radiology. 2018, 288(3): 782-790.
[5] He YL, Li Y, Lin CY, et al. Three-dimensional turbo-spin-echo amide proton transfer-weighted MRI for cervical cancer: A preliminary study. Magn Reson Imaging. 2019, 50(4):1318-1325.
[6] Nery F, Gordon I, Thomas DL. Non-Invasive Renal Perfusion Imaging Using Arterial Spin Labeling MRI: Challenges and Opportunities. Diagnostics (Basel). 2018, 5,8(1).
Figures
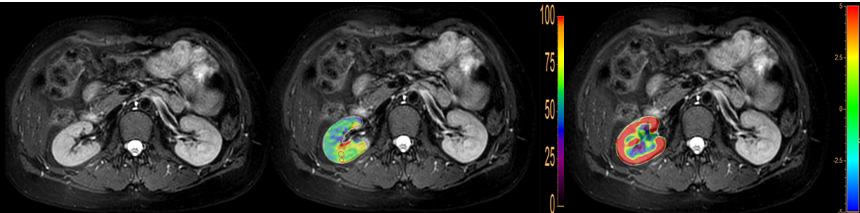
29-year-old femalevolunteer, T2w image (A) confirmed
the absence of any visible lesions, ROI on renal cortex (B) and medulla (C) of
the right kidney. The APTw valuewas2.0 % and 1.45% in renal cortex and medulla,
theCBF value was129.6 and 71.7 in renal cortex and medulla.
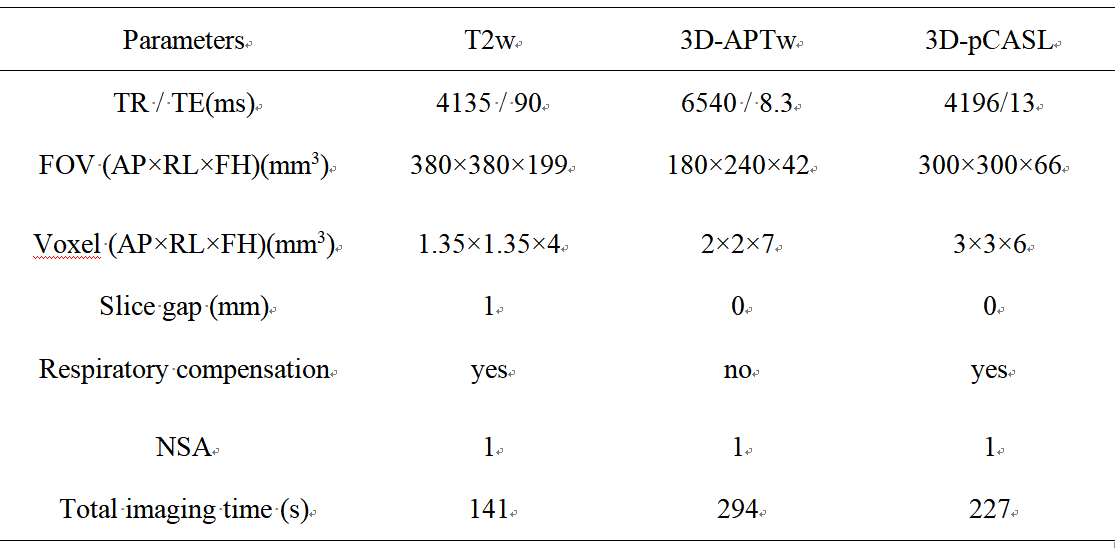
Scan parameters
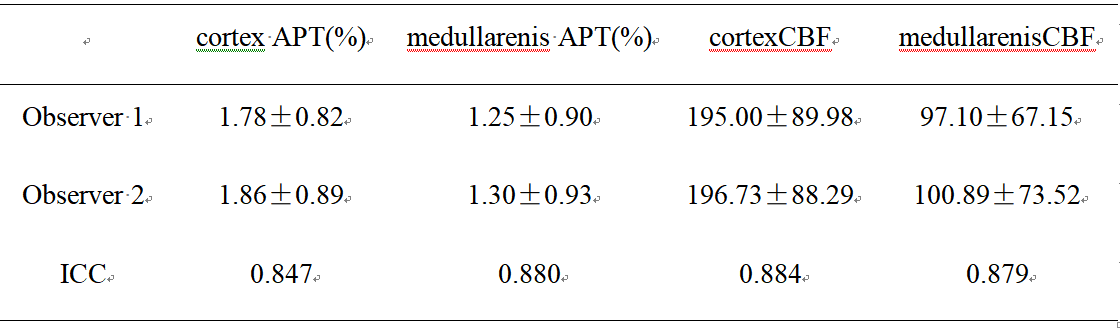
Intra-class Correlation Coefficient analysis of APTw
and CBF between two observers. The mean values of each parameter were also
presented