2463
Monitoring the microenvironment changes of kidney in patients with hyperuricemia using dual-modal functional MRI1Medical Imaging Center, First Affiliated Hospital, Jinan University., Guangzhou, China, 2Medical Imaging Center, First People's Hospital of Kashgar, Xinjiang, china., Xinjiang, China, 3MR Research, GE Healthcare., Beijing, China
Synopsis
The aim of this study was to investigate the feasibility of diffusion tensor imaging (DTI) and blood oxygenation level dependent imaging (BOLD) in assessing early renal function changes in hyperuricemia.
Synopsis
The aim of this study was to investigate the feasibility of diffusion tensor imaging (DTI) and blood oxygenation level dependent imaging (BOLD) in assessing early renal function changes in hyperuricemia.Introduction
Accompanied by the continuous improvement in the standard of living of people and the changing structure of diets, the prevalence of hyperuricemia has extensively increased in recent decades. Studies have shown that hyperuricemia is a risk factor for the development of kidney disease. Hence, the early detection of renal functional changes as well as timely and effective intervention is very important for delaying the progression of kidney disease. Evidences have indicated that both diffusion tensor imaging (DTI) and blood oxygenation level dependent imaging (BOLD) have been widely used in the evaluation of kidney disease, including diabetic nephropathy1, renal tissue fibrosis2 and chronic kidney disease3. However, whether the functional changes of hyperuricemia associated renal injury could be detected using DTI and BOLD MRI are still unclear. For answering those questions, a total of 71 male participants, including asymptomatic hyperuricemia (AH, 22 cases), gout patients (GA, 26 cases) and 23 age- and sex-matched healthy controls (HC), were enrolled in this study.Methods
All subjects underwent DTI and BOLD sequence with a 3.0T MRI scanner. Mean cortical and medullary DTI parameters (ADC and FA values) and BOLD parameter (R2*) were calculated by setting multiple regions of interest. The differences of the ADC, FA and R2* maps among the three groups were assessed. Moreover, the correlations between those parameters and serum uric acid (SUA) as well as estimated glomerular filtration rate (eGFR) were performed. In addition, the correlation between two clinical indexes SUA and eGFR were also analyzed.Results and Discussion
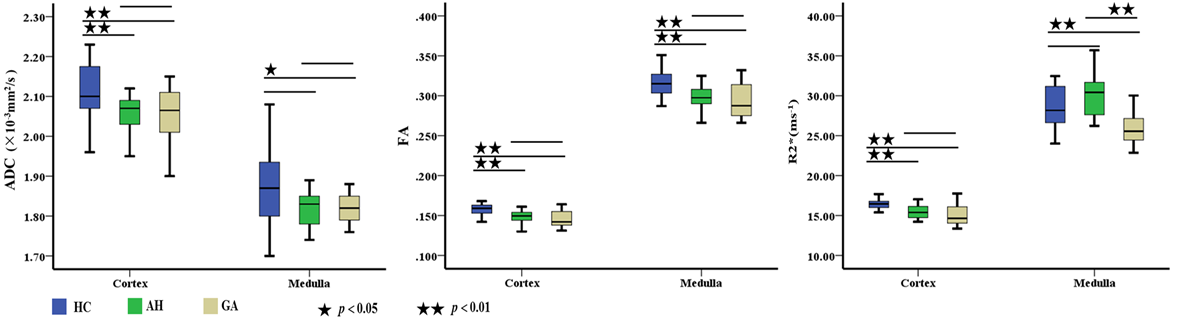
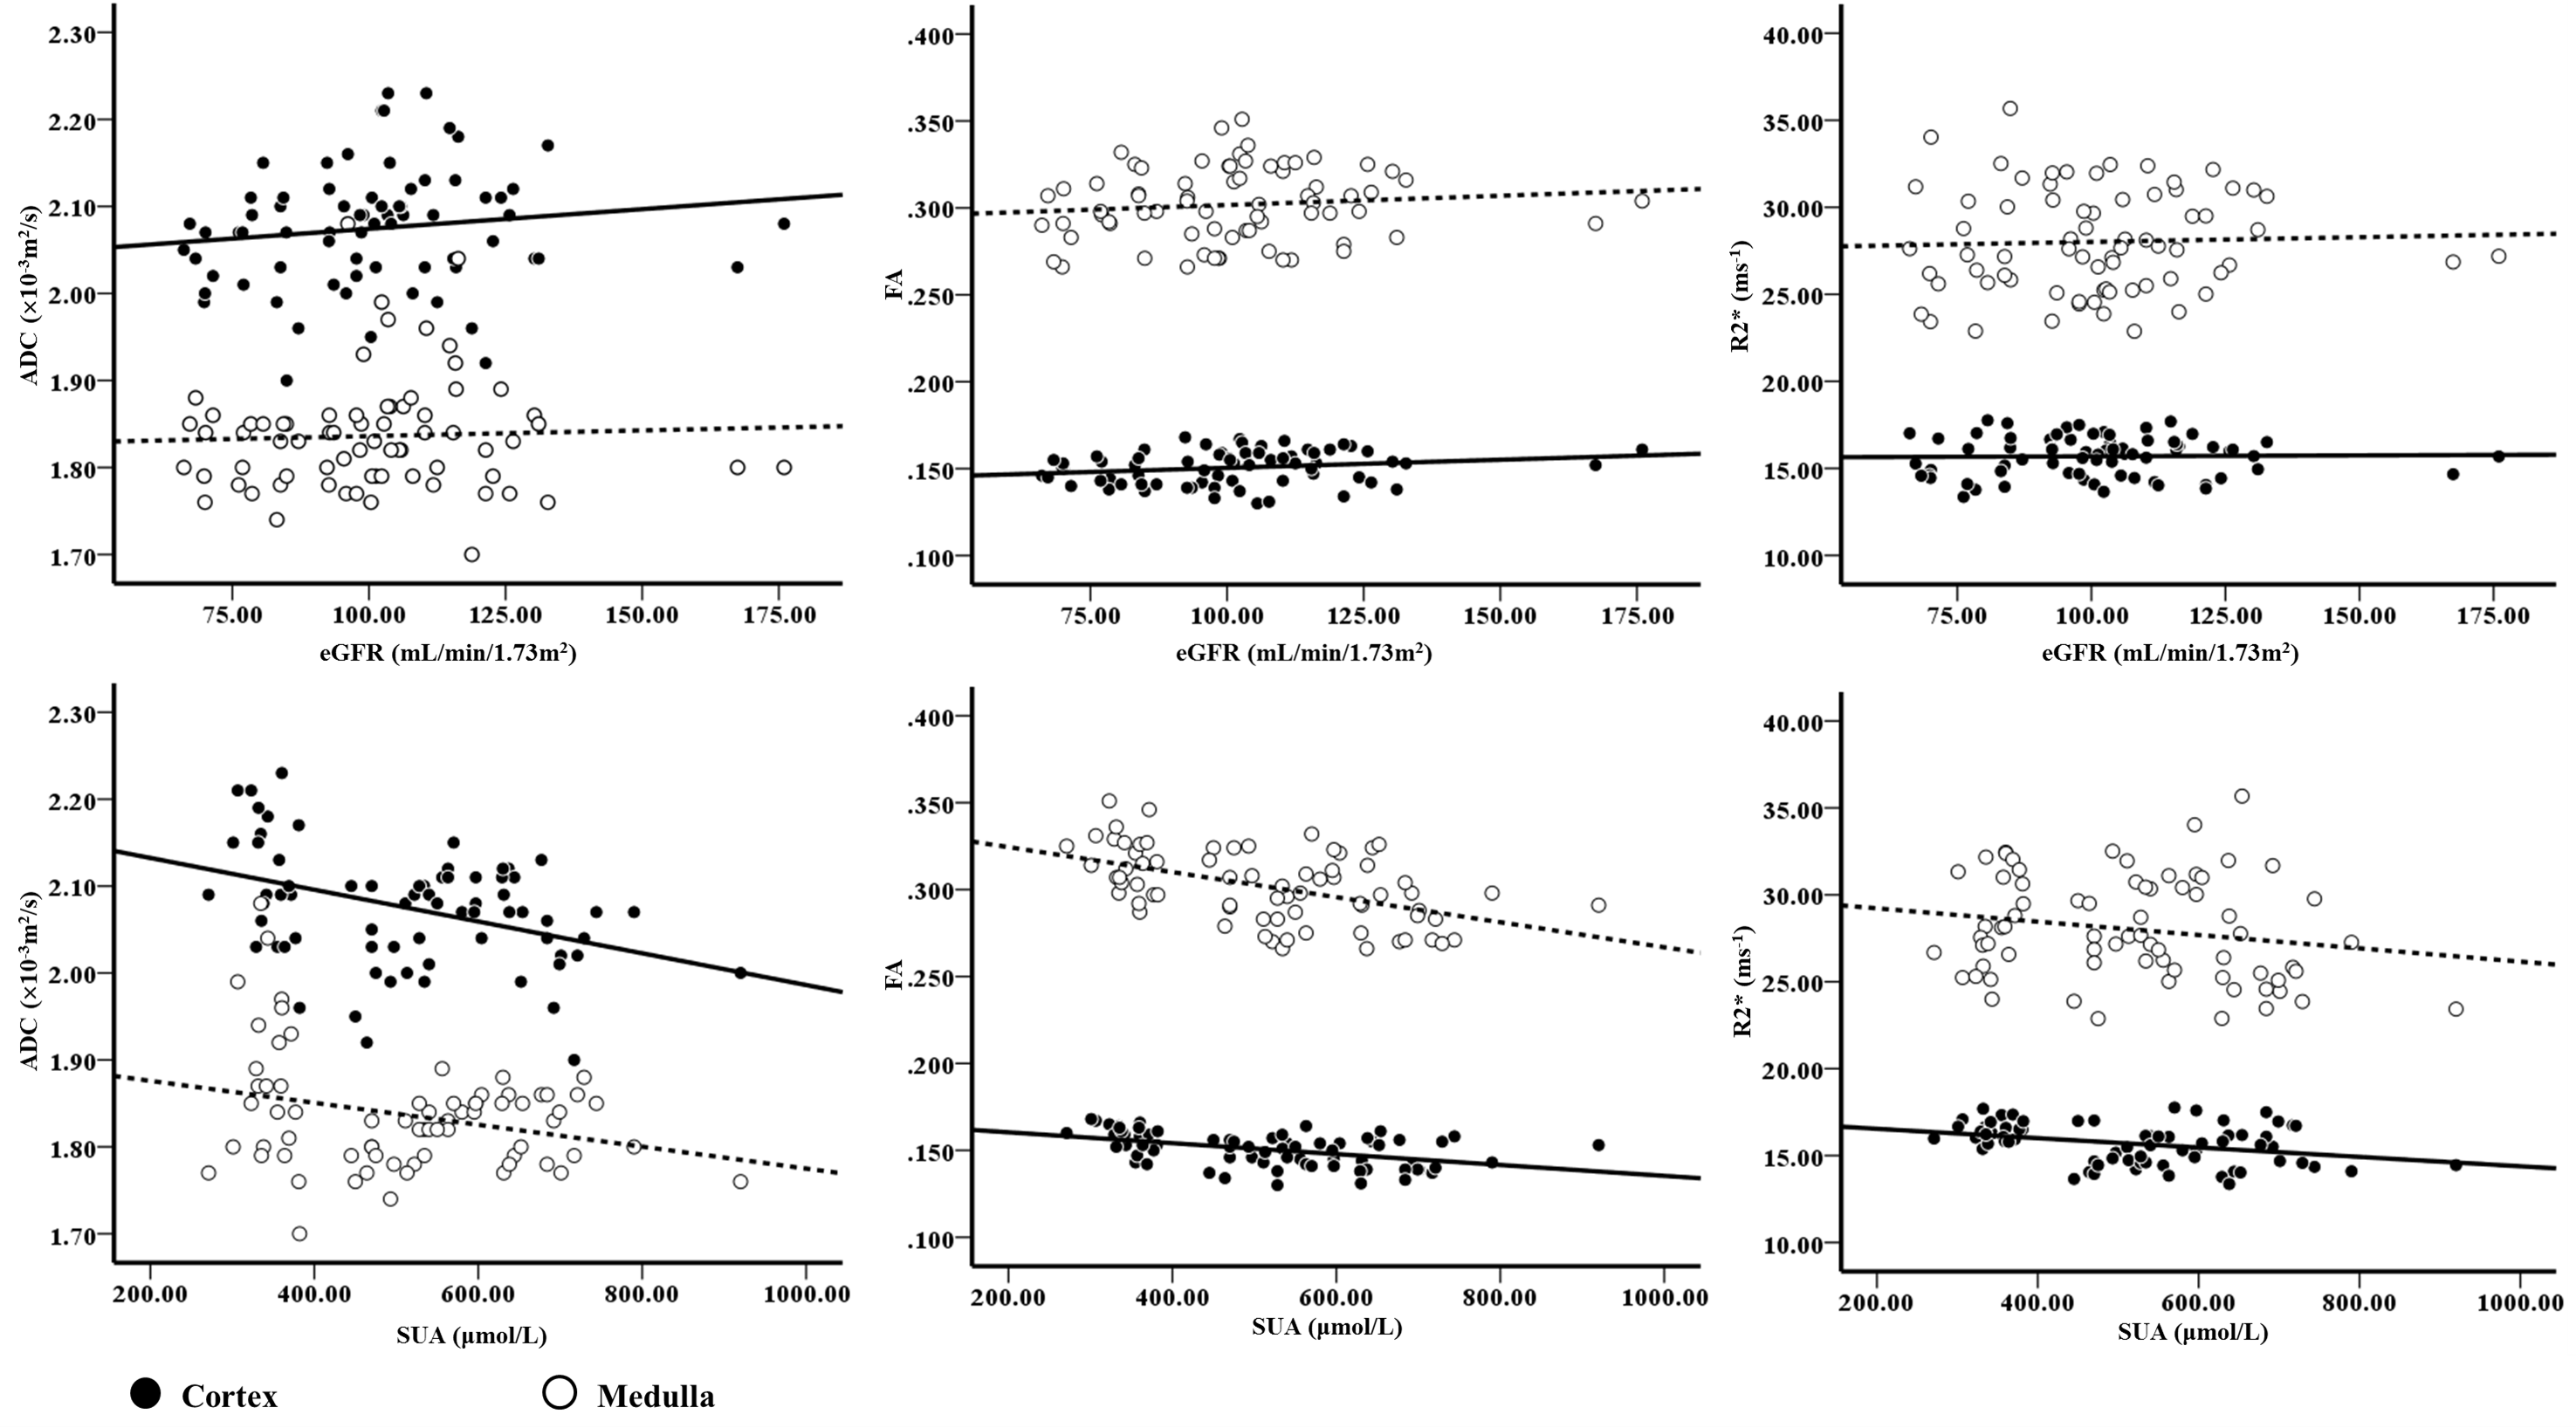
The comparisons of cortical and medullary ADC/FA/R2* among three groups were showed in Figure 1. The FA values of renal cortex and medulla and R2* values of renal cortex significantly decreased in both AH and GA groups compared to the control group (P < 0.05). The cortical ADC values in AH and GA groups as well as medullary ADC value in the GA group were significantly lower than that of control group (P < 0.05). The R2* values of medulla in HC and AH group were significantly higher than that of GA group. The results of the correlation between ADC/FA/R2* and SUA/eGFR were demonstrated in Figure 2. The ADC, FA and R2* values of renal cortex or medulla were negatively correlated with SUA (P < 0.05), except for the R2* value of medulla. No significant correlations were found between those values and eGFR (P > 0.05). In addition, there was a significantly negative correlation between the eGFR and SUA (r = -0.462, P < 0.05). Our results showed that the FA values of the cortex or medulla in AH and GA group were significantly lower than those of HC group. It may associate with urate crystal deposition, inflammatory reaction4, 5 and smooth muscle cell proliferation6, etc. The ADC values of the renal cortex in both AH and GA group and of the medulla in GA group were significantly lower than those of the HC group. The ADC value is a quantitative parameter for the diffusion of water molecules in tissue. As mentioned above, those changes4-6 will result in limited diffusion of water molecules and decreased ADC. In addition, the decreased blood volume and blood flow7-8 in patients with kidney injury may account for the declines in ADC values. The results of the significant negative correlation between the both the ADC and FA values of renal cortex or medulla and SUA indicated that the degree of impaired renal function is positively correlated with SUA. In addition, the normal or mildly decresed eGFRs in both AH and GA groups may relate with eGFR insensitivity to early renal injury induce by hyperuricemia.Conclusion
In current study, our results demonstrated that both DTI and BOLD MRI were worthwhile for detecting the early changes of renal function in patients with hyperuricemia.Acknowledgements
noReferences
1. Wang Y, Yan X, Pu H, et al. In vivo evaluation of early renal damage in type 2 diabetic patients on 3.0 T MR diffusion tensor imaging. World J Radiol, 2018, 10(8):83-90.
2. Kaimori JY, Isaka Y, Hatanaka M, et al. Diffusion Tensor Imaging MRI with Spin-Echo Sequence and Long-Duration Measurement for Evaluation of Renal Fibrosis in a Rat Fibrosis Model. Transplant Proc. 2017, 49(1):145-152.
3. Gaudiano C, Clementi V, Busato F, et al. Diffusion tensor imaging and tractography of the kidneys: assessment of;chronic parenchymal diseases. Eur Radio, 2013, 23(6):1678-1685.
4. Preitner F, Laverriere-Loss A, Metref S, et al. Urate-induced acute renal failure and chronic inflammation in liver-specific Glut9 knockout mice. Am J Physiol Renal Physiol, 2013, 305(5):F786-F795. 5. Cheung J S, Fan S J, Gao D S, et al. Diffusion tensor imaging of liver fibrosis in an experimental model. Journal of Magnetic Resonance Imaging, 2010, 32:1141-1148.
6. Mazzali M, Kanellis J, Han L, et al. Hyperuricemia induces a primary renal arteriolopathy in rats by a blood pressure-independent mechanism. Am J Physiol Renal Physiol, 2002, 282:991-997.
7. Heusch P, Wittsack HJ, Kröpil P, et al. Impact of blood flow on diffusion coefficients of the human kidney: a time-resolved ECG-triggered diffusion-tensor imaging (DTI) study at 3T. J Magn Reson Imaging, 2013, 37:233-236.
8. Hueper K, Hartung D, Gutberlet M, et al. Magnetic resonance diffusion tensor imaging for evaluation of histopathological changes in a rat model of diabetic nephropathy. Invest Radiol, 2012, 47:430-437.
Figures