2462
Non-invasive assessment of progressive changes in aristolochic acid (AA) induced AKI with T2 mapping1Guangdong Provincial Key Laboratory of Medical Image Processing, Southern Medical University, Guang Zhou, China, 2Philips Healthcare, Guang Zhou, China, 3Department of Medical Imaging Center, Nanfang Hospital, Southern Medical University, Guangzhou, China, 4School of Biomedical Engineering, Southern Medical University, Guang Zhou, China
Synopsis
Cases of Aristolochic acid nephropathy (AAN) have been reported worldwide, yet no serum or urinary biomarkers have been shown to have clinical utility in detection of AAN. In this study, we aim to detect renal changes in the early phase of AAN with T2 mapping. The results suggest that T2 mapping may be a valuable tool in experimental studies and clinical practice of acute phase of AAN.
Purpose
Aristolochic acid nephropathy (AAN) has been recognized as toxic interstitial nephropathy caused by ingestion of plants containing aristolochic acids (AA) since 1990s1. Cases of AAN have been reported worldwide and plants containing AA are still available via the market or internet. Thus far no serum or urinary biomarkers have been shown to have clinical utility in detection of AAN2. Non-invasive and reliable biomarker is still desirable. T2 value can reflect free water content in tissue, therefore often considered as a marker for quantification of tissue edema3. In this study, we aim to detect renal changes in the early phase of AAN with T2 mapping.Method
Twenty-four rats were divided into aristolochic acid I (AAI) group (n=18) and control group (n=6). Six rats from AAI group and six rats from control group underwent MRI scan before and at 2, 4 and 6 days after AAI or PEG400 administration. Three rats were randomly chosen from the rest of AAI group for histological analysis at each time point. MRI scan was performed on a 7 Tesla animal scanner (Pharma Scan, Bruker). Images of T2 mapping sequence were acquired in oblique coronal orientation parallel to both kidneys using a respiratory triggered, 2D-FSE scheme with the main parameters as: TR/ΔTE/first TE = 1000/10/10 ms, number of echoes = 8; FOV = 40×55 mm2; matrix = 133×183; slice thickness = 1 mm; number of slices = 8; number of average = 2; scan duration = 6 minutes. T2 maps were calculated using a mono-exponential fitting algorithm based on auto-regression on linear operation of data4. ROIs of cortex, outer stripe of outer medulla (OSOM), inner stripe of outer medulla (ISOM) and inner medulla (IM) were manually drawn on the right kidney and the mean T2 values were extracted for four compartments respectively.Results
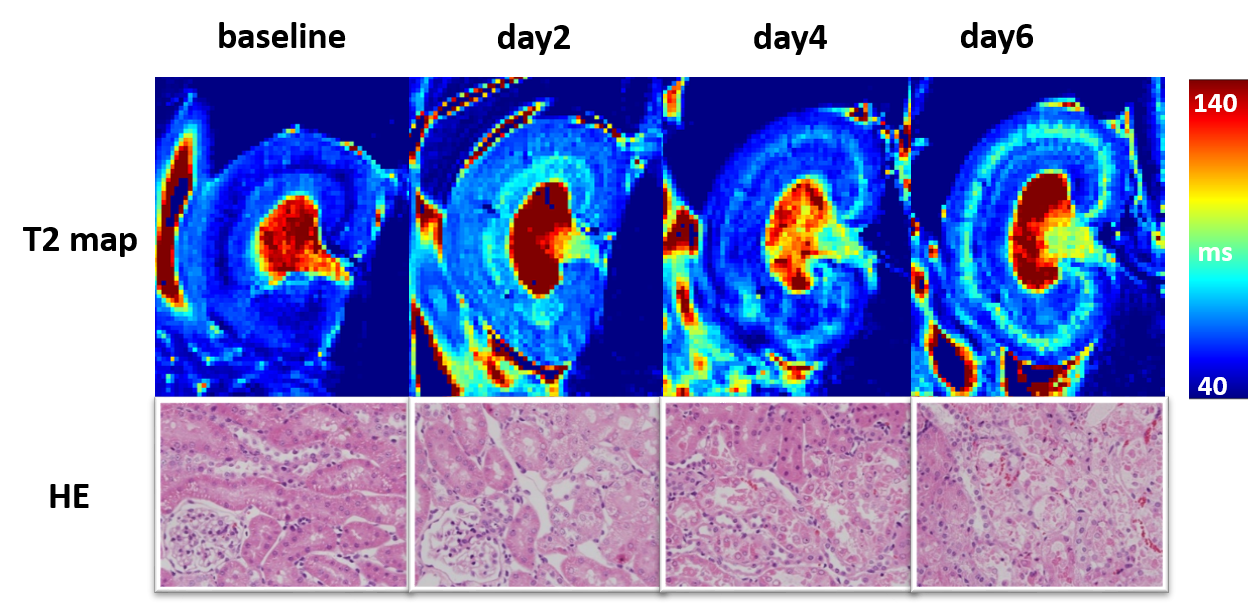
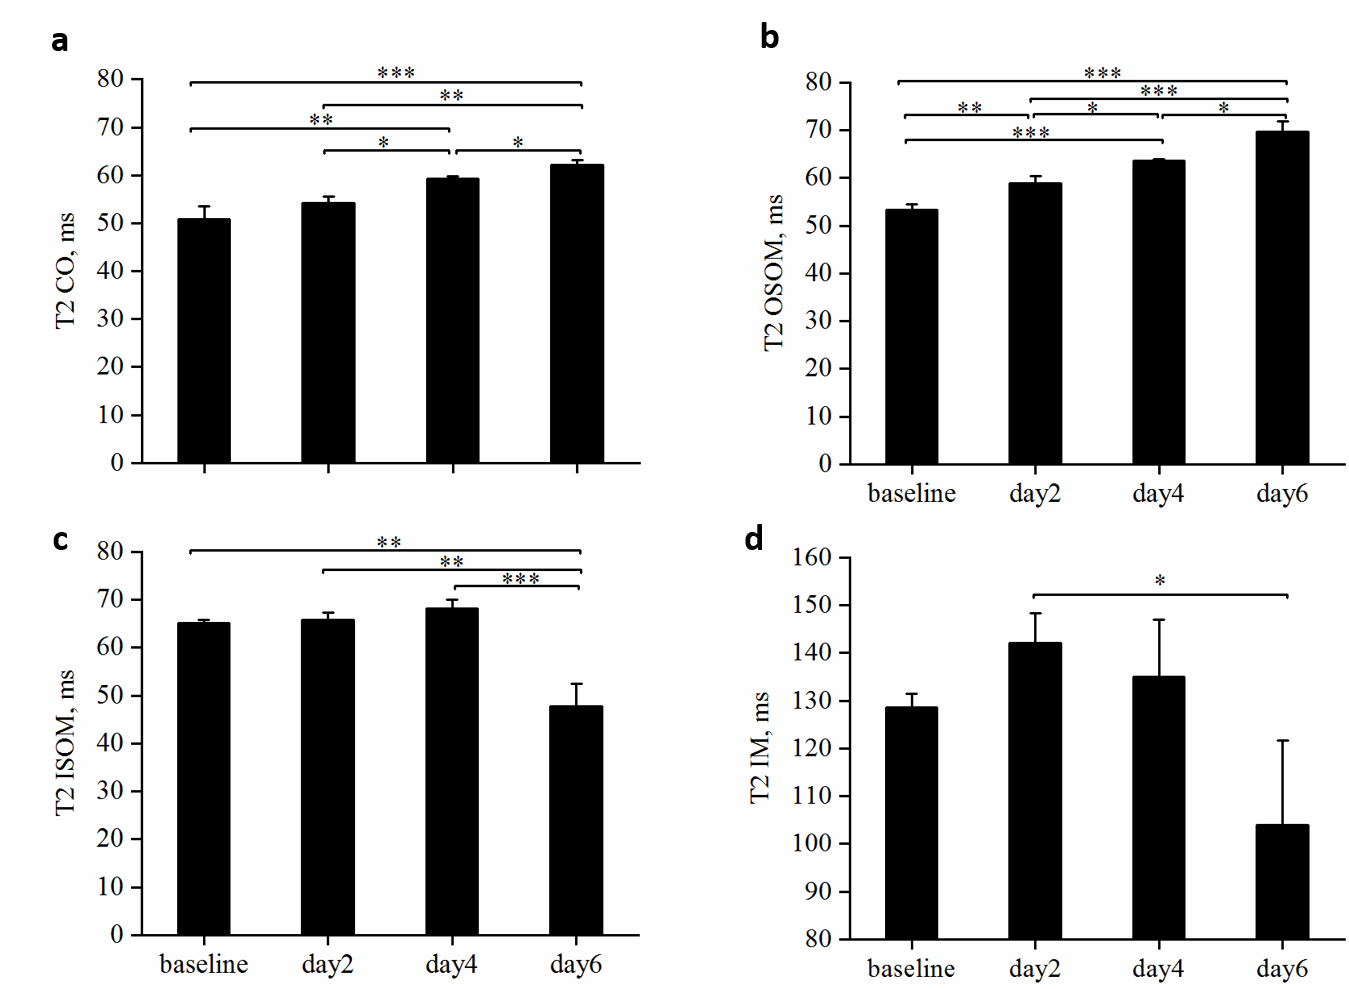
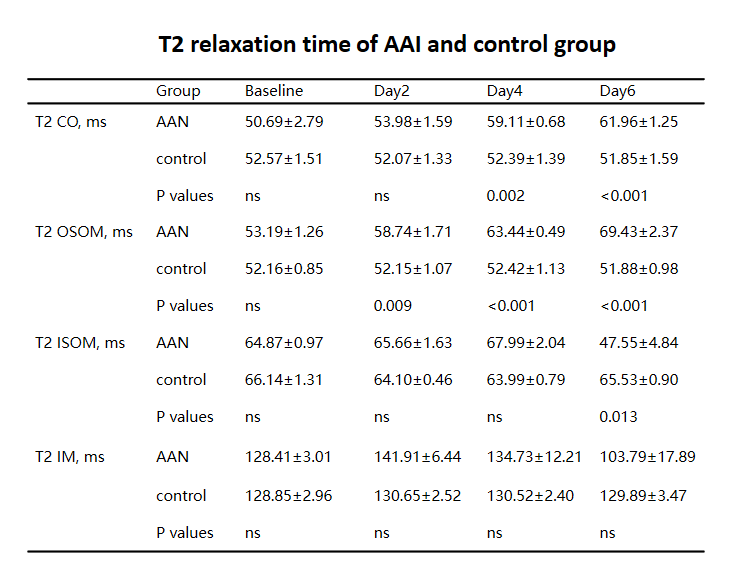
Representative T2 maps of AAI-treated kidneys at different time points are shown in the upper row of Figure 1 and statistical analysis of T2 values of four compartments of AAI-treated kidneys are shown in Figure 2. T2 values of cortex gradually increased from baseline to day 6, as shown in Figure. 2a. Significant differences were detected between T2 values of different time points except that between baseline and day 2. T2 values of OSOM (Figure. 2b) showed a similar trend as cortex, presenting the most pronounced change among four compartments. Significant differences were detected between T2 values of any two different time points. T2 values of ISOM (Figure. 2c) and IM (Figure. 2d) both increased at first then followed by a sudden decline and ended with much smaller values at day 6 than baseline. For ISOM, T2 values increased from baseline to day 4 and dropped at day6. T2 values of IM increased at day 2 then decreased afterwards. Yet significant differences of T2 values of IM between different time points were hardly detected except between day 2 and day 6. Renal tissue injuries of AAI-treated rats at different time points were revealed by hematoxylin-eosin staining in the lower row of Figure 1. In AAI group, the histological lesions were primarily presented in proximal tubules which mainly lie in OSOM. Comparison of T2 values between AAI group and control group is shown in Table 1. Comparing with control group, T2 values of cortex in AAI group were significantly higher at day 4 and day 6 (p=0.002 and p<0.001 respectively); T2 values of OSOM were significantly higher at day 2, day 4 and day 6 (p=0.009, p<0.001 and p<0.001 respectively); for ISOM, only T2 values of day 6 were significantly lower (p=0.013). No significant difference of T2 values of IM was detected between AAI group and control group.Conclusions
In this study, changes of T2 values at early phase of AAN could be detected and T2 values of OSOM were significantly different at all time points and correlated well with histology analysis, suggesting that T2 mapping may be a valuable tool in experimental studies and clinical practice of acute phase of AAN.Acknowledgements
No acknowledgement found.References
1. Debelle FD, Vanherweghem JL, Nortier JL. Aristolochic acid nephropathy: a worldwide problem. Kidney Int. 2008 Jul;74(2):158-69.
2. Gökmen MR, Cosyns JP, Arlt VM, Stiborová M, Phillips DH, Schmeiser HH, Simmonds MS, Cook HT, Vanherweghem JL, Nortier JL, Lord GM. The epidemiology, diagnosis, and management of aristolochic acid nephropathy: a narrative review. Ann Intern Med. 2013 Mar 19;158(6):469-77.
3. Dekkers IA, Lamb HJ. Clinical application and technical considerations of T(1) & T(2)(*) mapping in cardiac, liver, and renal imaging. Br J Radiol. 2018 Dec;91(1092):20170825..
4. Pei M, Nguyen TD, et al. Algorithm for fast monoexponential fitting based on Auto-Regression on Linear Operations (ARLO) of data. Magn Reson Med. 2015 Feb;73(2):843-50.
Figures