2461
Towards non-invasive measurement of renal tubule size by diffusion MRI1Radiology, Washington University in St. Louis, School of Medicine, Saint Louis, MO, United States, 2Pediatrics, University of Virginia Children's Hospital, Charlottesville, VA, United States
Synopsis
Tubular hypertrophy is an early feature of many renal pathologies. A direct, non-invasive measure of kidney morphology is lacking. Current diagnostics are primarily based on biopsy after suspected renal disease, which is prone to sampling error and is invasive. A robust non-invasive imaging tool to study tubular changes in vivo is greatly needed and would provide early tissue biomarker for initiation and progression of kidney injury. In this work, we used a single diffusion encoding MRI approach to study distribution of restricting tissue compartment sizes in kidney cortex as a potential noninvasive marker of tubule size in the intact kidney.
Introduction
Nephrons are the structural units responsible for kidney function, critical in maintaining blood osmolality, blood pressure, electrolyte homeostasis, and waste removal 1. Kidneys provide compensatory hyperfiltration to maintain total glomerular filtration when up to half of the nephrons are damaged due to injury or disease. Thus, traditional serum markers for glomerular filtration are insensitive to early disease. Biopsies are invasive and prone to sample bias. Non-invasive imaging tools could detect early nephron damage to open up new targets for therapy, improve transplant matching and monitoring, or track patients at risk for chronic kidney disease (CKD) 2. Tubular hypertrophy is an early feature of many pathologies, such as polycystic kidney disease (PKD), acute kidney injury (AKI) and CKD, and diabetes 3-6. Here we used single diffusion encoding (SDE) diffusion MRI to provide a non-invasive measure of tissue compartment size distribution in the kidney. To measure the intravoxel distribution of restricted water diffusion distances, the diffusion signal attenuation curve was modeled using the multiple correlation function (MCF) method 7, 8. We simulated the MCF sensitivity to restricted diffusion at the scale of the kidney tubules. We then applied the MCF to excised, fixed mouse, rat and human kidneys and compared the MR-measured sizes to histology.Methods
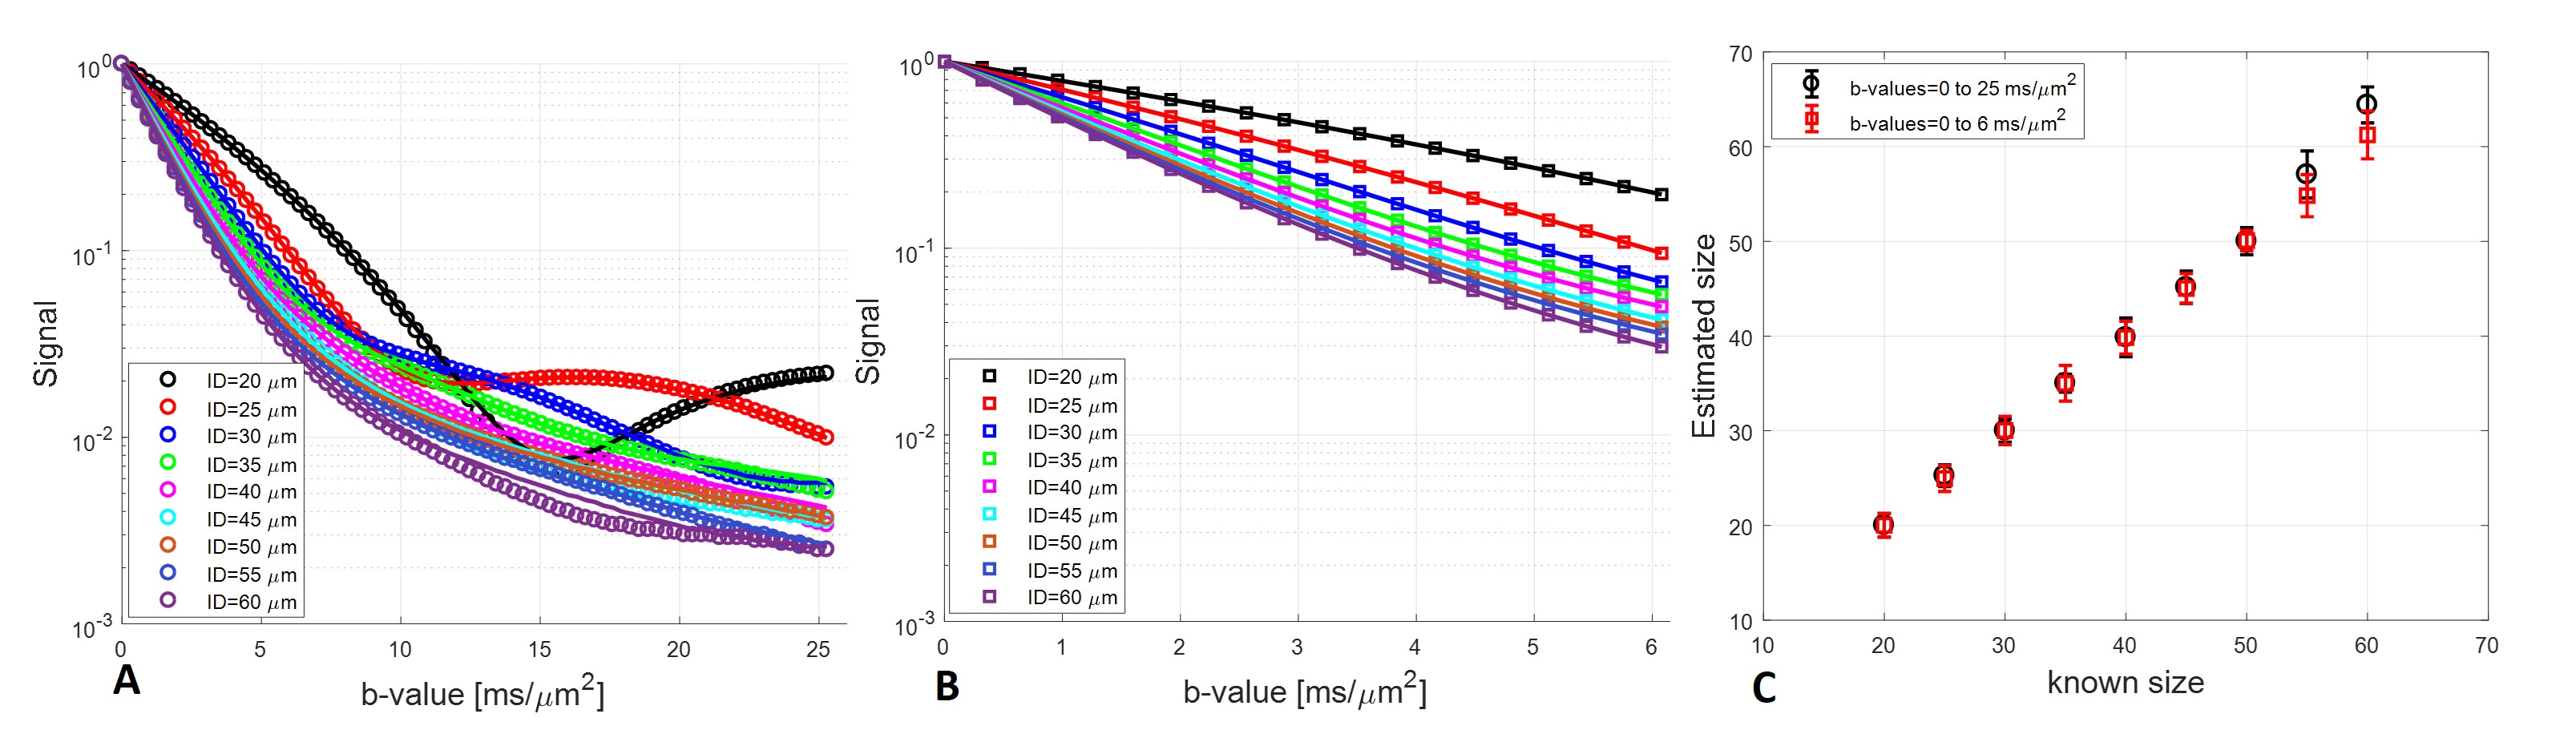
Simulations: Monte Carlo simulations of particle random-walk were performed on 106 random “water” particles with random starting positions inside infinitely long cylinders of sizes 20-60 μm, D0=1.0 μm2/msec (x10-3 mm2/sec) and Δ/δ=100/3 ms (step size was 0.001 ms), max b-value of 25 ms/µm2 (x103 s/mm2).Kidneys: All animal experiments were approved by IACUC. Animals were perfused and kidneys removed and fixed in Formalin. Human kidney unsuitable for transplantation was obtained from IIAM. Diffusion experiments were conducted at 11.7T MRI (Agilent). Mouse, rat, and human kidneys were washed in PBS for ~24 hours or one week, prior to MRI scan. To remove the vascular component of the signal, one rat was perfused with Flourinert instead of PBS. Pulsed-field-gradients stimulated echo (PGSTE) pulse sequence at T=20°C was applied in three orthogonal directions (x, y, and z) using: TR/TE=1000/20 ms, max b-value=25 ms/µm2 (32 equal steps), Δ/δ=100/3 ms, NA=6, voxel size of 150x150 µm2 (mice/rat) or 190x190 µm2 (human), slice thickness=1 mm. Finally we applied this approach to study the differences in compartment size distributions in renal cortex in healthy mice (N= 3) injected with bicarbonate solution vs. mice with a folic acid model of acute kidney injury (AKI, N = 5) 9.
Histology: Excised kidneys were dehydrated in 70% Ethanol, embedded in paraffin, sectioned at 5 μm, mounted on cationic glass slides, stained with Mason’s trichrome, and imaged using Hamamatsu NanoZoomer. Images were analyzed using MIPAR.
Results and Discussion
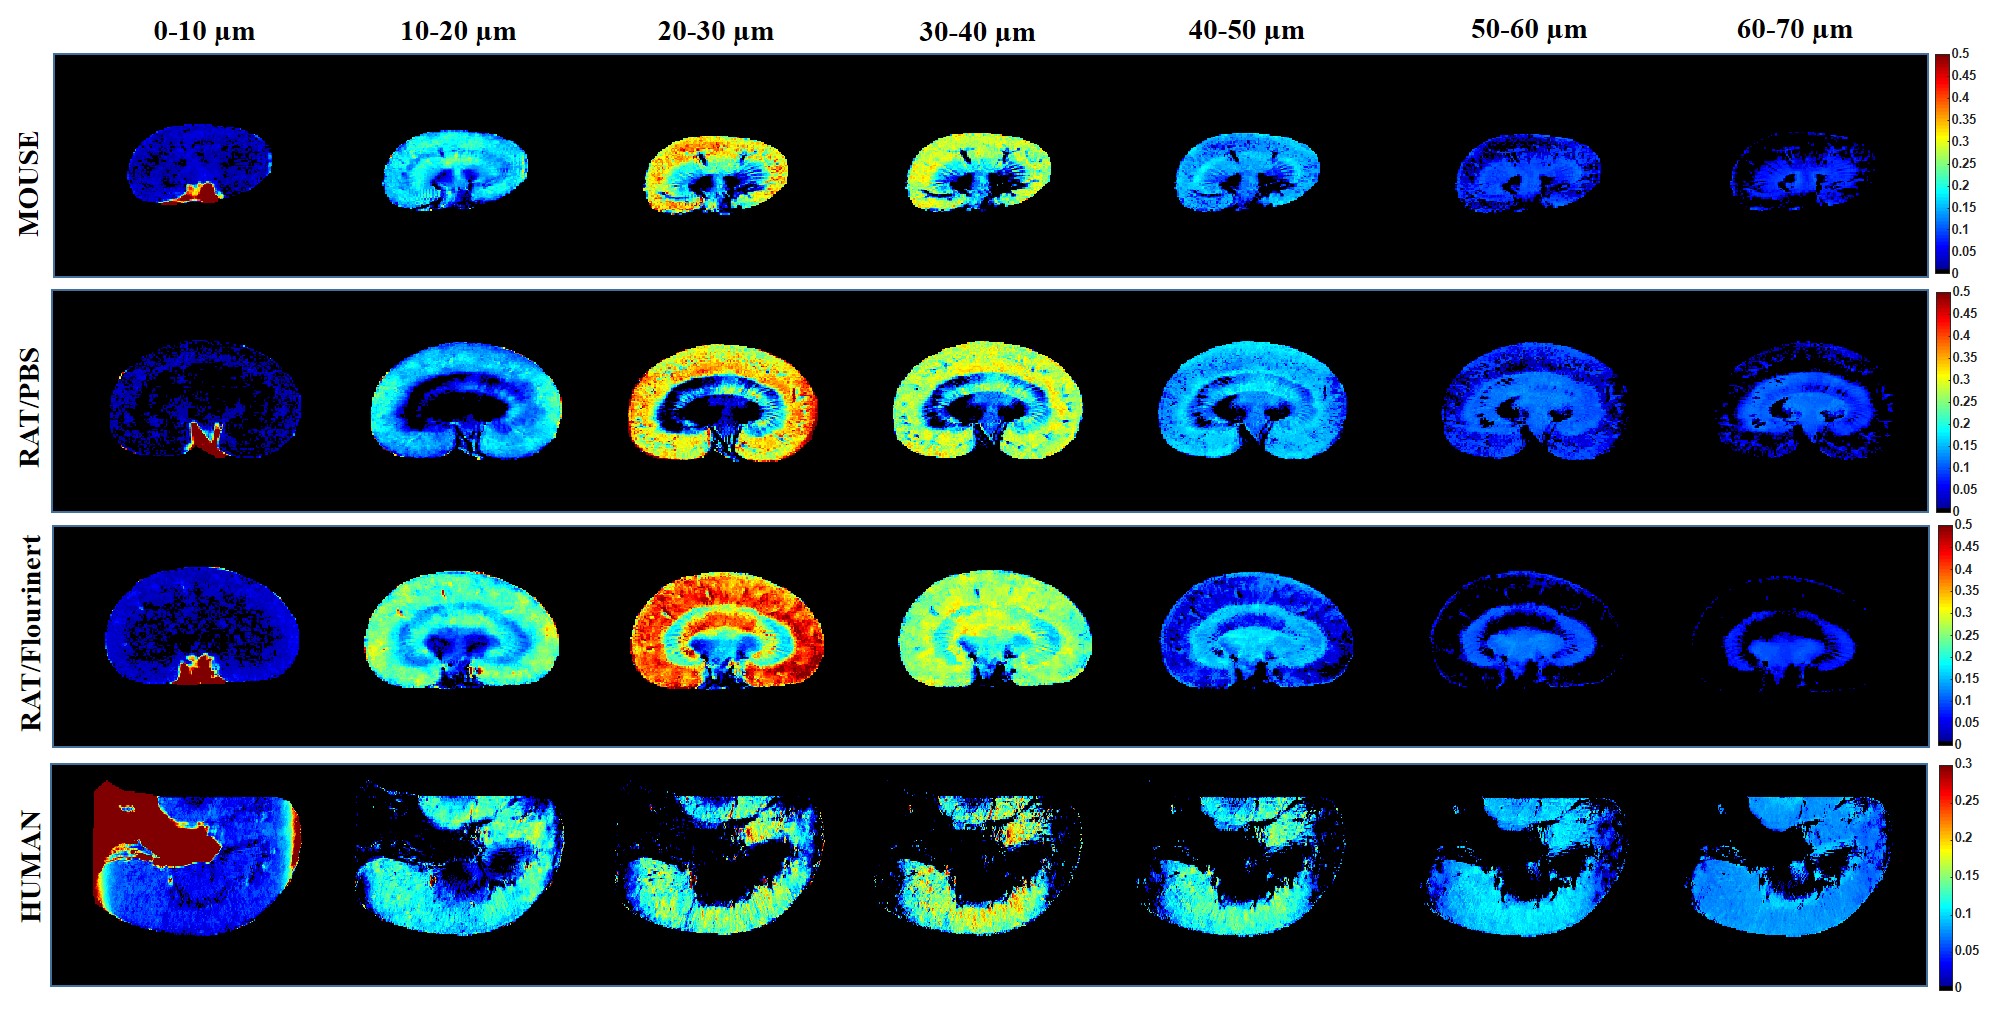
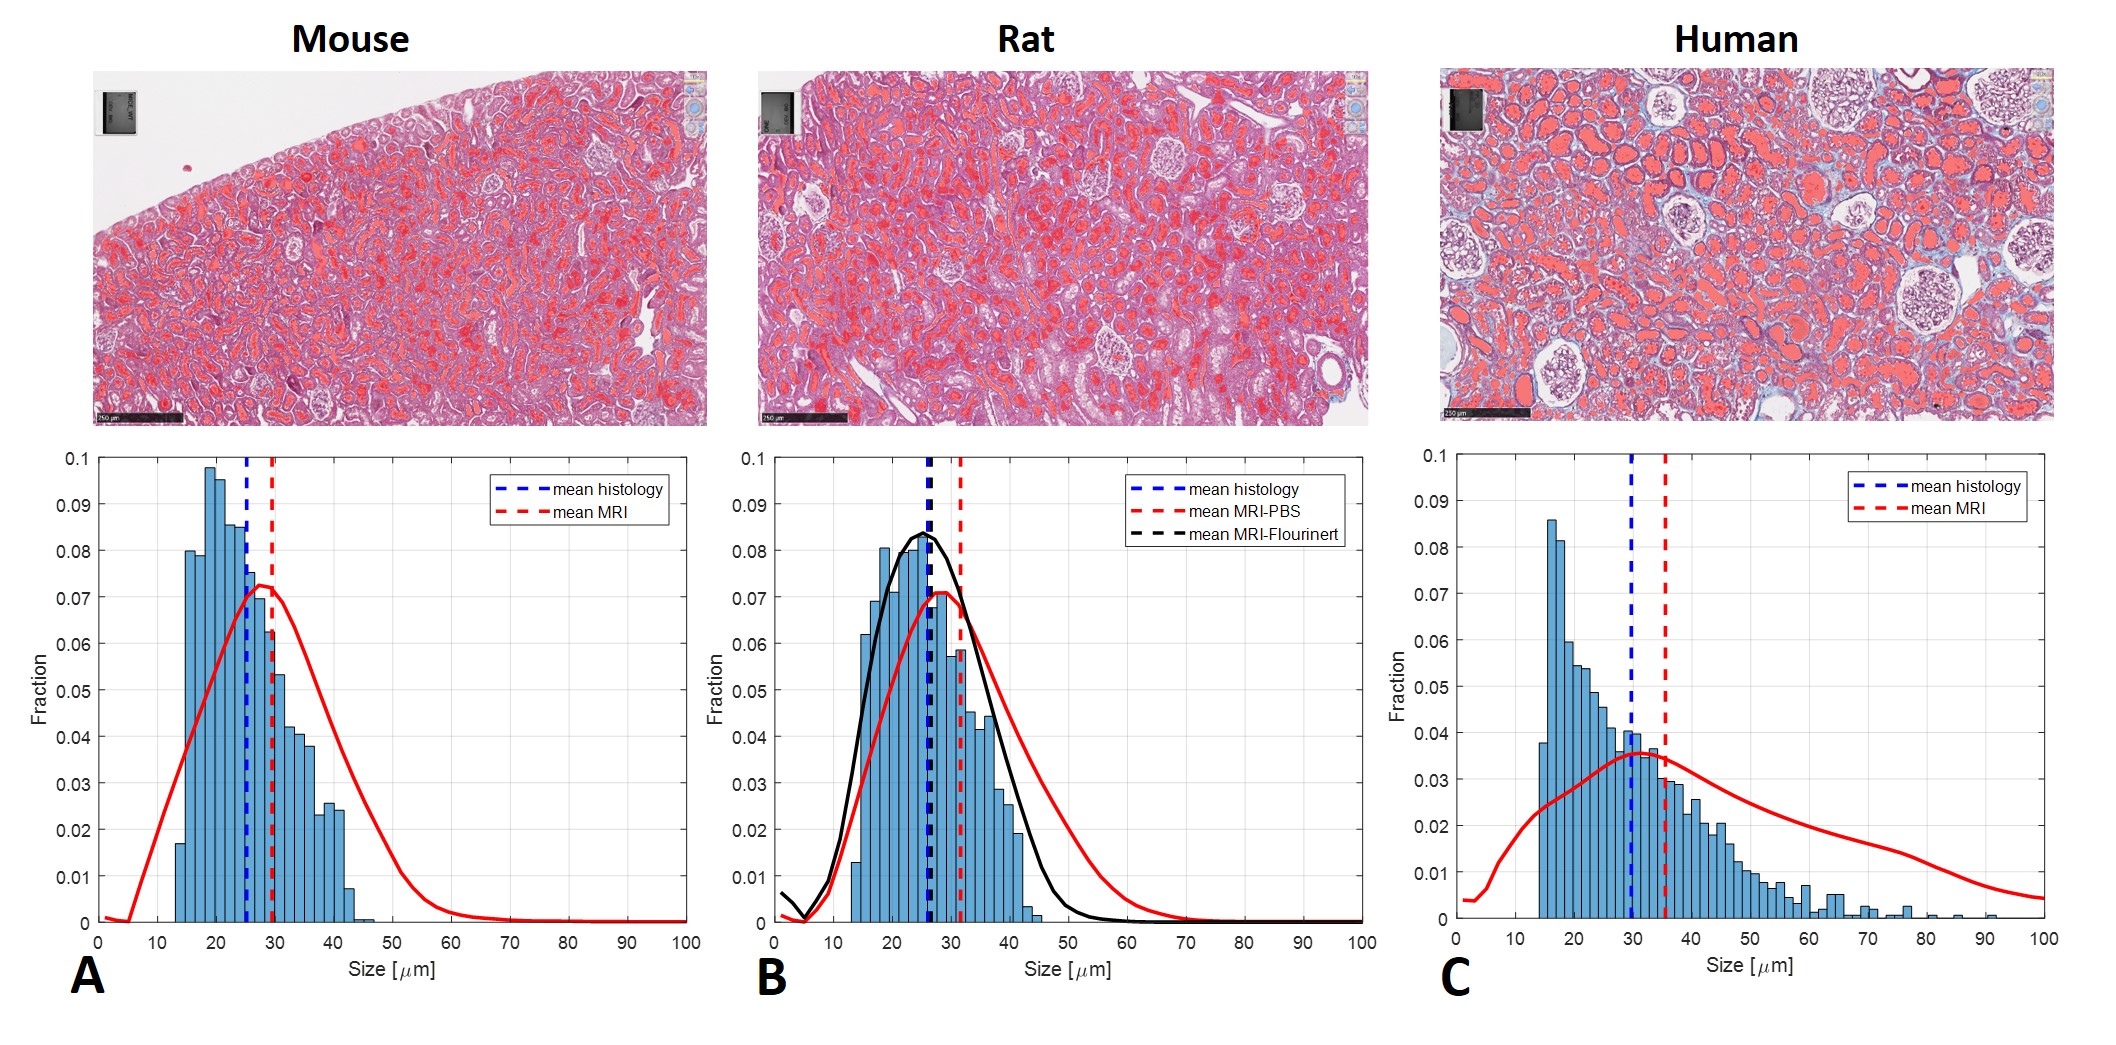
Monte-Carlo simulation results are shown in Figure 1, analyzed using the model in 8 with two b-value ranges from 0 to 25 ms/µm2 and 0 to 6 ms/µm2. The signal was modeled as a superposition of a Gaussian diffusing component and a series of restricted components. No assumptions were made a priori regarding the number of restricted compartments or the type of diffusion. We assumed that each pixel has non-smooth distribution of sizes. The method accurately computed the mean sizes, where the fraction of restricted spin population is between 30-50% (Figure 1C). We performed SDE on excised normal mice, rat and human kidneys. Figure 2 shows the size distributions fraction maps of mouse, rat and human kidney with the diffusion-sensitizing gradient applied in x-direction (the estimation of size distributions fraction maps in y- and z- directions is ongoing). Here, fitting was done using maximum b-value of 25 ms/µm2. Similar results were obtained with b-values from 0 to 6 ms/µm2 (not shown). Using smaller b-values makes the method clinically promising.For mouse and rat kidneys, the biggest fraction of sizes was obtained between 20-30 µm in cortex (Figure 2). Human kidneys exhibited a broader size distribution. Figure 3 compares size distributions obtained from histology and MRI. Relatively similar size distributions were obtained from histology in mouse (25.1±7.1 µm) and rat (26.0±7.1 µm) kidneys (blue line, Figures 3A-B). The mean size obtained from human histology was 29.7±12.6 µm. The mean sizes obtained from MR measurements were 29.5±11.5 µm, 31.6±12.1 µm and 35.5±20.0 µm for mouse, rat PBS-washed and human kidneys, respectively (red line, Figures 3A-C). Interestingly, the MR-obtained size distribution from the Flourinert-washed kidney was narrower, with mean size of 26.6±9.3µm (black line, Figures 3B) similar to tubule diameter measured by histology (<3% difference), indicating that significant fraction of larger sizes, likely indicating blood vessels between 50-60 µm, had been removed by Fluorinert (Figure 3B).
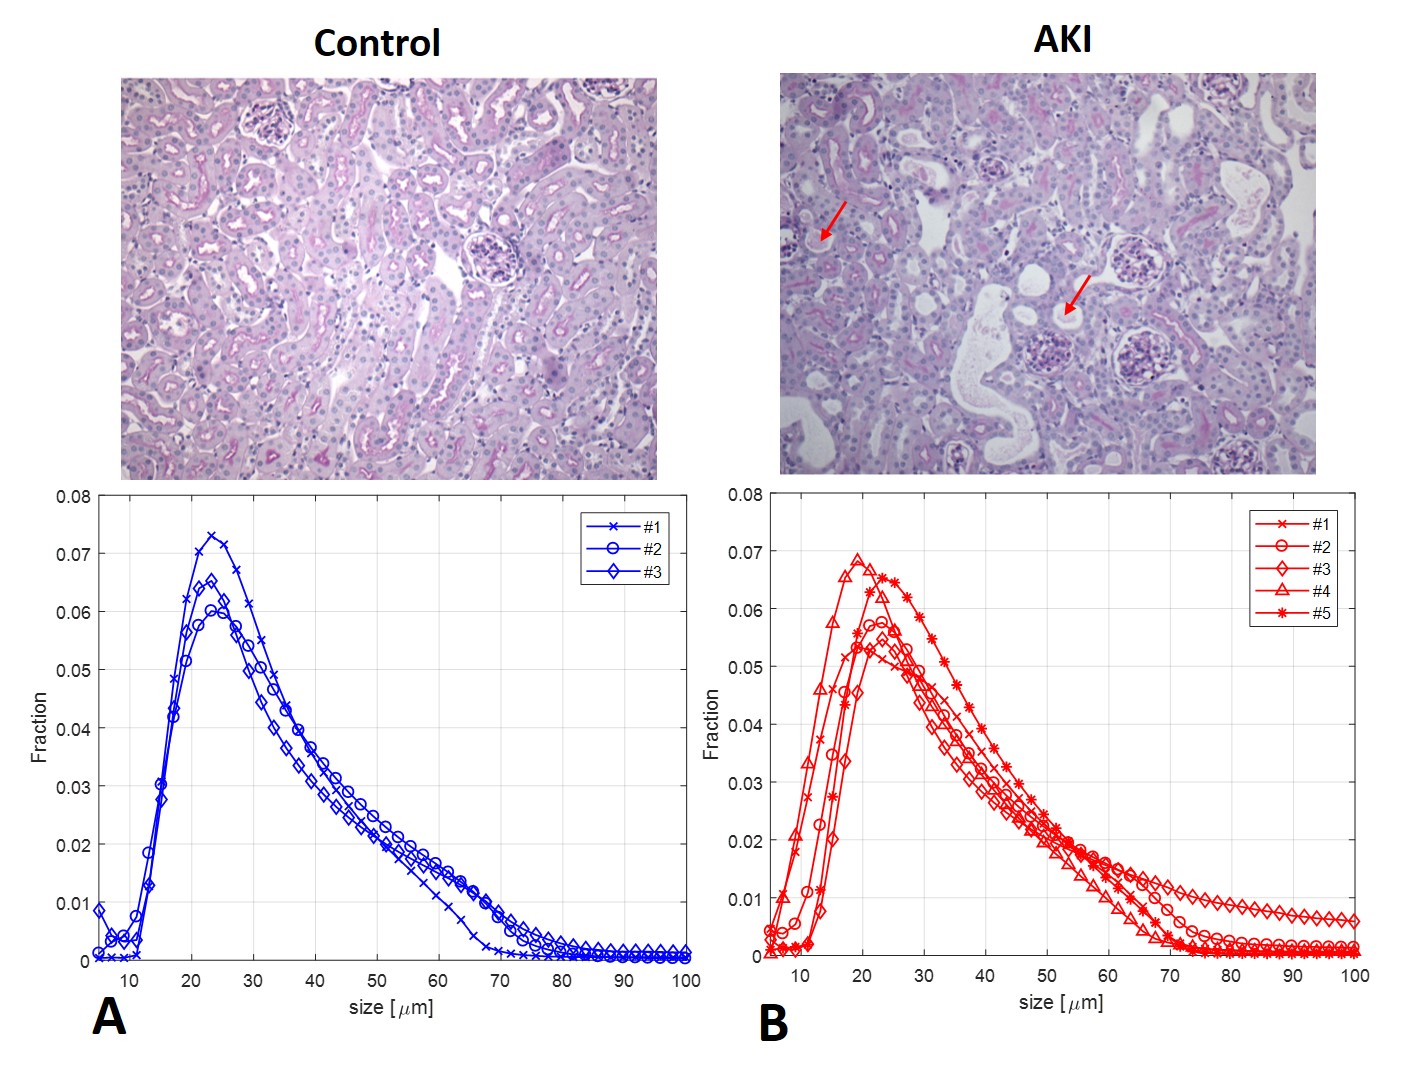
Figure 4 shows tissue and DWI size distributions for mice with AKI and controls. The AKI group had higher variability characteristic of the pathology and heterogeneity of AKI development. Interrogation of difference between two groups is the subject of ongoing investigation.
Conclusion
Tubules comprise the largest fraction of structures in kidney cortex, and changes in tubule diameter observed in histology were consistent with restricting compartment sizes measured by DWI. DWI may thus accurately measure size distribution in the kidney cortex, suggesting further exploration. This is a first step toward development of a robust, non-invasive method to quantify tubular size by MRI.Acknowledgements
No acknowledgement found.References
1. Schafer V. Renal function: mechanisms preserving fluid and solute balance in health. Boston : Little, Brown, and Co.1995.
2. Xie L, Bennett KM, Liu C, Johnson GA, Zhang JL, Lee VS. MRI tools for assessment of microstructure and nephron function of the kidney. Am J Physiol Renal Physiol 2016;311(6):1109-1124.
3. Anders H-J, Huber TB, Isermann B, Schiffer M, CKD in diabetes: diabetic kidney disease versus nondiabetic kidney disease. Nature Reviews Nephrology 2018;14(6):361-377.
4. Paul BM, Vanden Heuvel GB, Kidney: polycystic kidney disease. Wiley Interdiscip Rev Dev Biol 2014;3(6):465-87.
5. Schnaper HW. The Tubulointerstitial pathophysiology of progressive kidney disease. Adv Chronic Kidney Dis 2017;24(2):107-116.
6. Chevalier RL. The proximal tubule is the primary target of injury and progression of kidney disease: role of the glomerulotubular junction. Am J Physiol Renal Physiol 2016;311(1):145-161.
7. Morozov D, Bar L, Sochen N, Cohen Y, Modeling of the diffusion MR signal in calibrated model systems and nerves. NMR Biomed 2013;26(12):1787-95.
8. Anaby D, Morozov D, Seroussi I, Hametner S, Sochen N, Cohen Y. Single- and double-Diffusion encoding MRI for studying ex vivo apparent axon diameter distribution in spinal cord white matter. NMR in Biomedicine 2019;e4170.
9. Bao Y-W, Yuan Y, Chen J-H, Lin W-Q. Kidney disease models: tools to identify mechanisms and potential therapeutic targets. Zool Res 2018;39(2):72-86.
Figures