2460
Spin-lock MRI Reveals Tubular Dilation and Fibrosis after Unilateral Ureter Obstruction1Vanderbilt University Institute of Imaging Science, Vanderbilt University Medical Center, Nashville, TN, United States, 2Department of Radiology and Radiological Sciences, Vanderbilt University Medical Center, Nashville, TN, United States, 3Division of Nephrology and Hypertension, Vanderbilt University Medical Center, Nashville, TN, United States, 4Department of Biomedical Engineering, Vanderbilt University, Nashville, TN, United States
Synopsis
Assessing the severity and progression of tubular dilation and fibrosis in kidneys are important clinical challenges. Here we evaluate spin-lock MR imaging with different locking fields for detecting tubular dilation and fibrosis in a mouse model of unilateral ureter obstruction. We fit the dispersion of spin-lock relaxation rates R1ρ at different locking fields (frequencies) to a model of exchanging water pools and assessed the sensitivity of the derived quantities for detecting tubular dilation and fibrosis in kidney. Histological scores for tubular dilation and fibrosis, based on luminal space and positive picrosirius red area in sections, were obtained for comparison.
Purpose
Tubular dilation and fibrosis are critical contributors to chronic kidney disease. Tubular dilation is a common event in early-stage kidney disease, while fibrosis is a hallmark of disease progression leading to end-stage renal disease. At high magnetic fields, the spin-lock relaxation rate in the rotating frame, R1ρ, varies with the locking field amplitude (frequency), and analysis of this dispersion provides quantitative information related to exchange processes between water pools in tissues, such as between free water and labile side groups on macromolecules. In this study, we evaluated the ability of parameters derived from spin-lock relaxation dispersion imaging for detecting tubular dilation and fibrosis in a murine model of unilateral ureter obstruction (UUO).1Methods
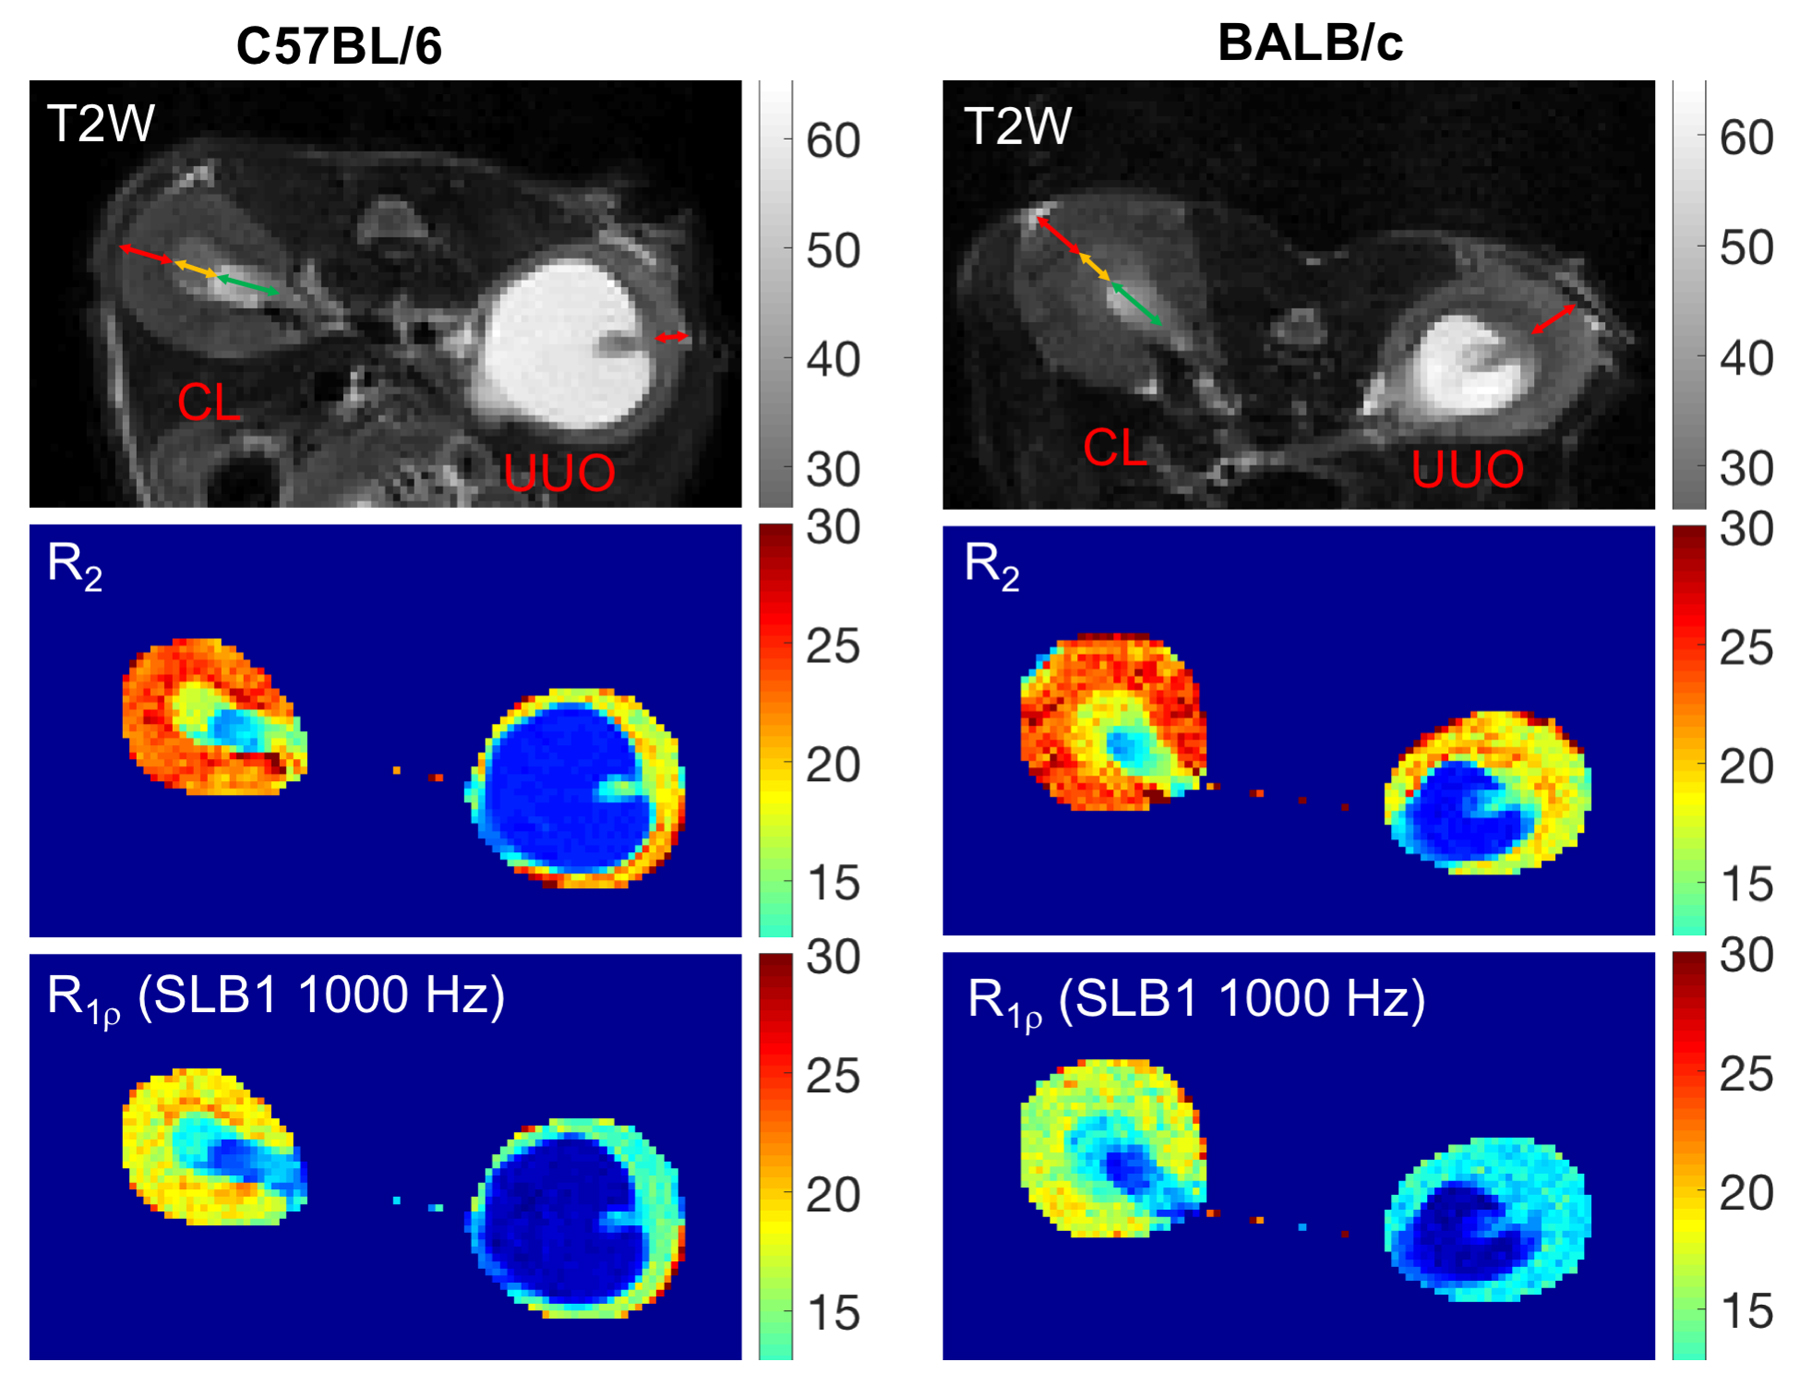
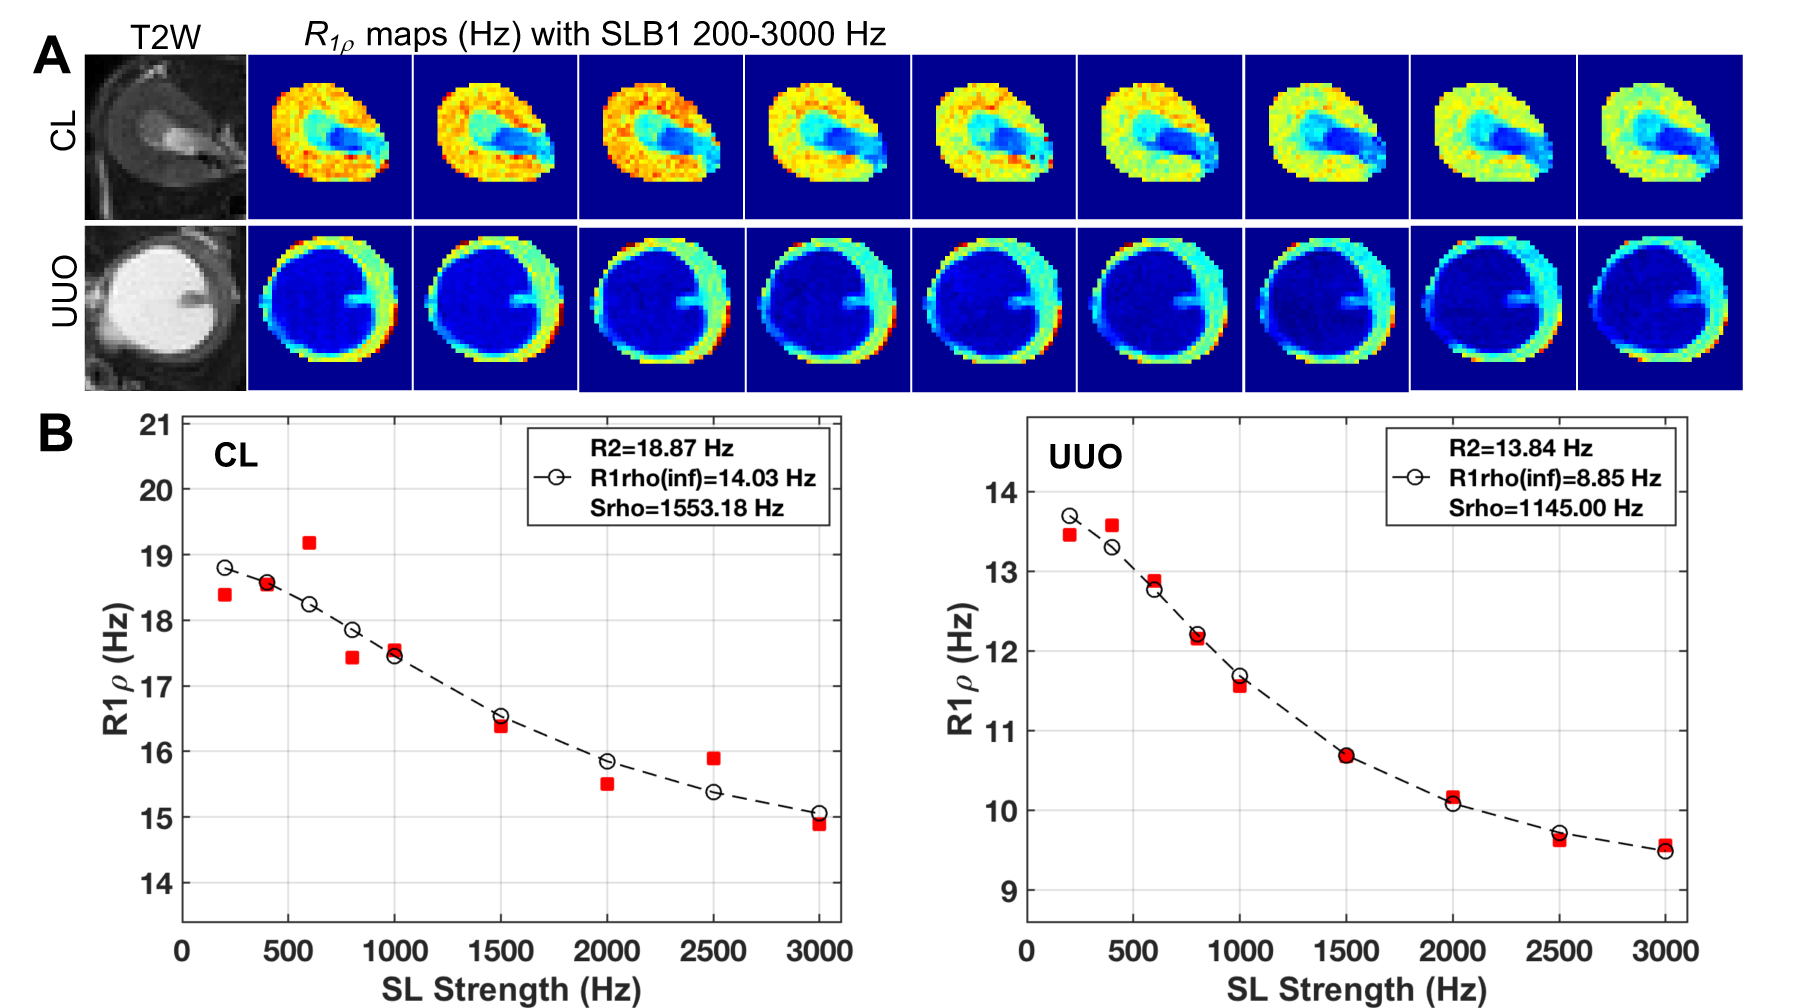
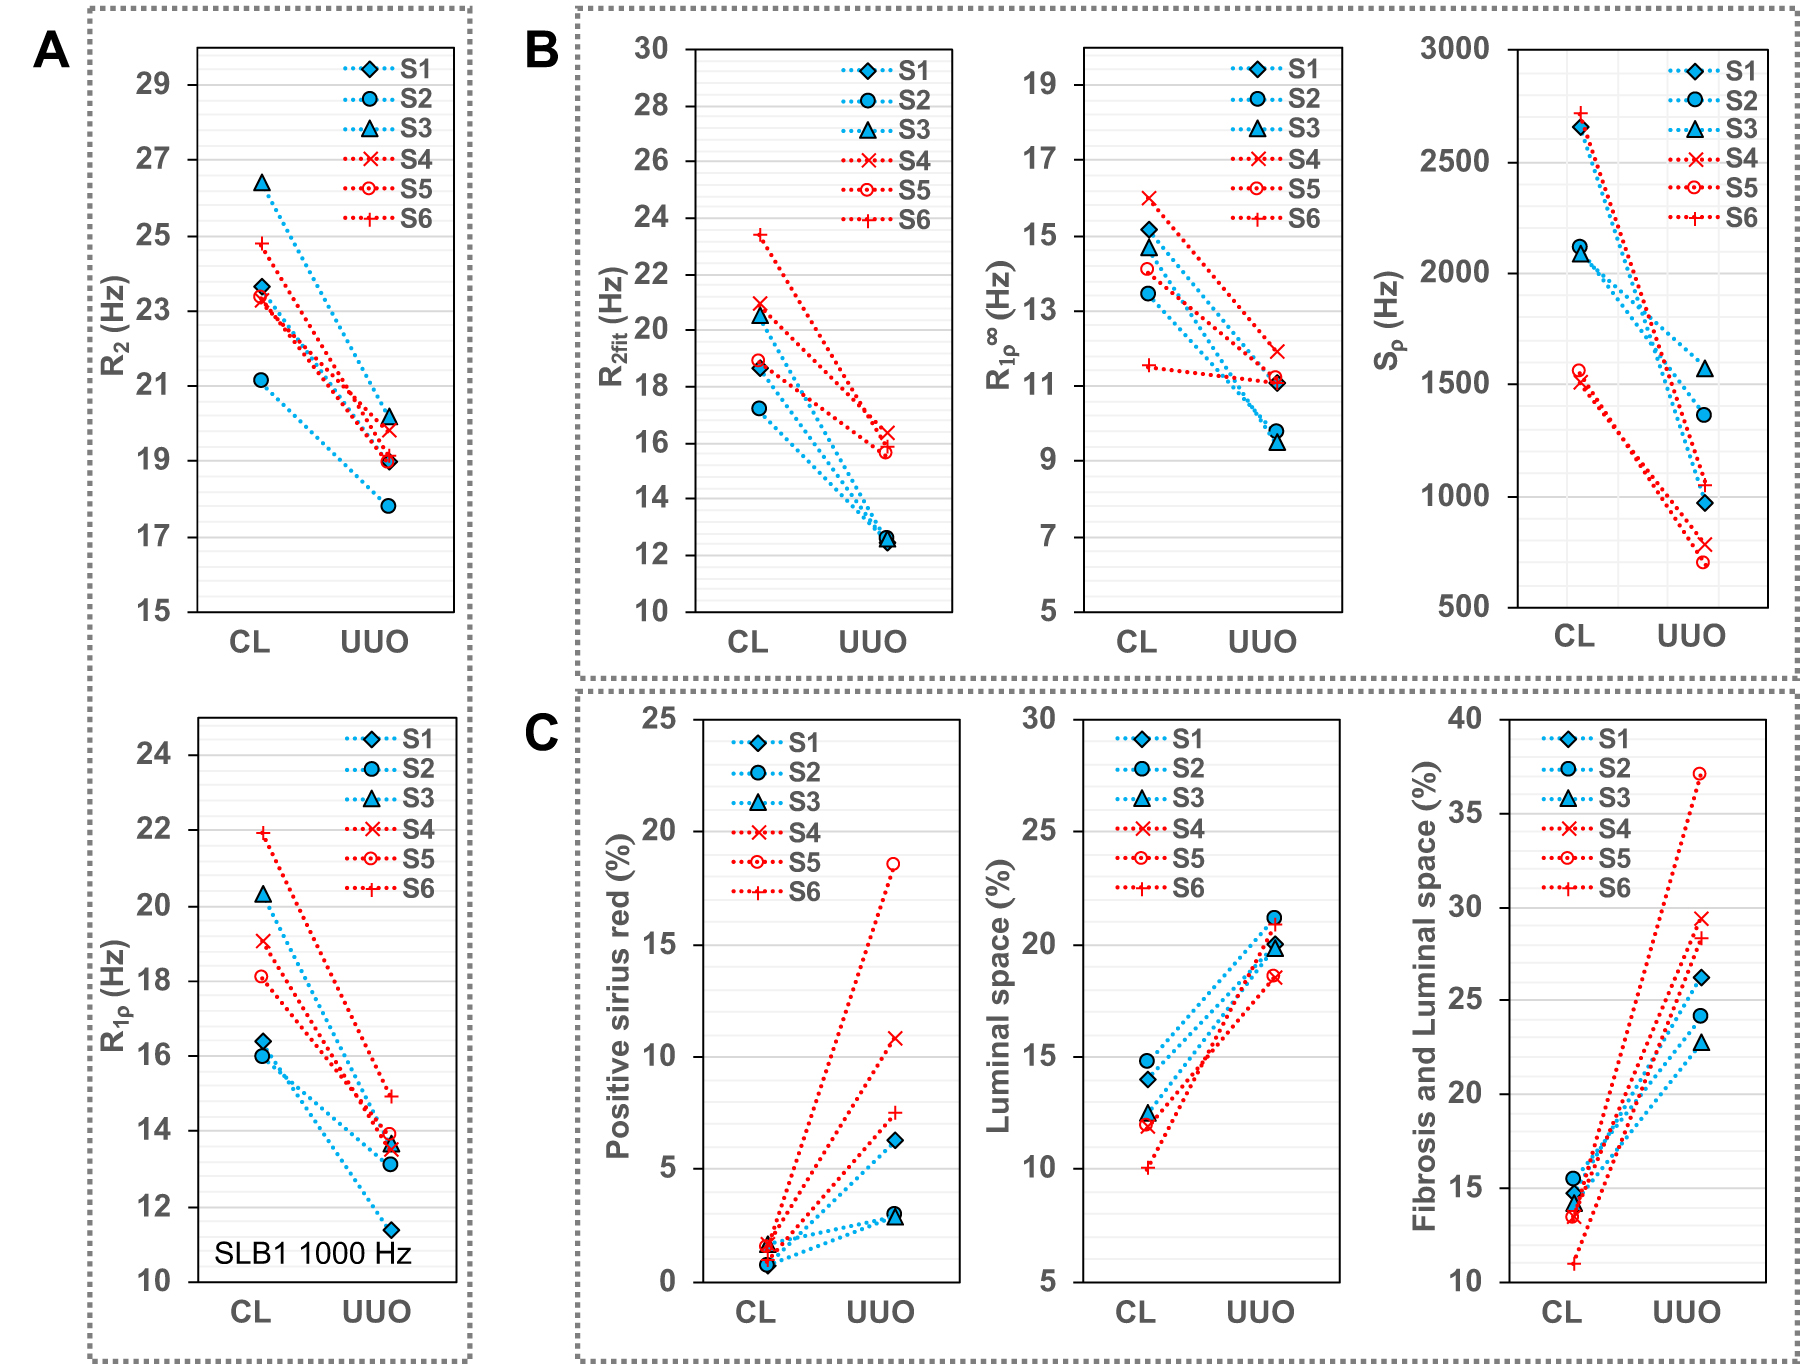
All procedures were approved by the Institutional Animal Care and Use Committee of Vanderbilt University. C57BL/6N and BALB/c mice that exhibit different levels of renal fibrosis in UUO kidneys were subjected to MR imaging. 12-week-old C57BL/6N and BALB/c mice, were anesthetized with 2% isoflurane and their left kidneys were exposed through the site of a left flank incision. Their ureters were obstructed completely near the renal pelvis using a 4-0 silk tie suture at two points. UUO mice were imaged at 7T ten days after surgery. Spin-lock images were acquired in a transverse plane using a fast spin echo acquisition preceded by a preparatory spin-lock cluster. Imaging parameters were TR/TE = 3000/24 msec, RARE factor = 8, resolution = 0.25 x 0.25 x 1 mm3. Sets of images were acquired with different spin-lock amplitudes ω1 (200, 400, 600, 800, 1000, 1500, 2000, 2500 and 3000 Hz). Spin-lock times were varied as 1, 5, 15, 25, 35, 55, 75 msec (Fig. 1). R1ρ values were obtained for each locking field by fitting signals to a single exponential decay with locking time. The dispersion of R1ρ with ω1 was fit to a model proposed by Chopra et al.2 as in our previous studies.3 The fits provided pixel-wise values of transverse relaxation rate R2, R1ρ at infinite spin-lock frequency R1ρ(inf), and an exchange rate-weighted parameter Sρ. In realistic cases, Sρ2≈ksw2+Δωs2, where ksw is the chemical exchange rate of protons with resonance frequency offset from water Δωs. The significances of differences in derived parameters between groups were evaluated using Student’s t-tests. Paraffin tissue sections were stained with picrosirius red using standard procedures for histological confirmation. Histological indices of luminal space and fibrosis area were calculated for comparison. Pearson correlations between parameters derived from MRI and histology were calculated.Results
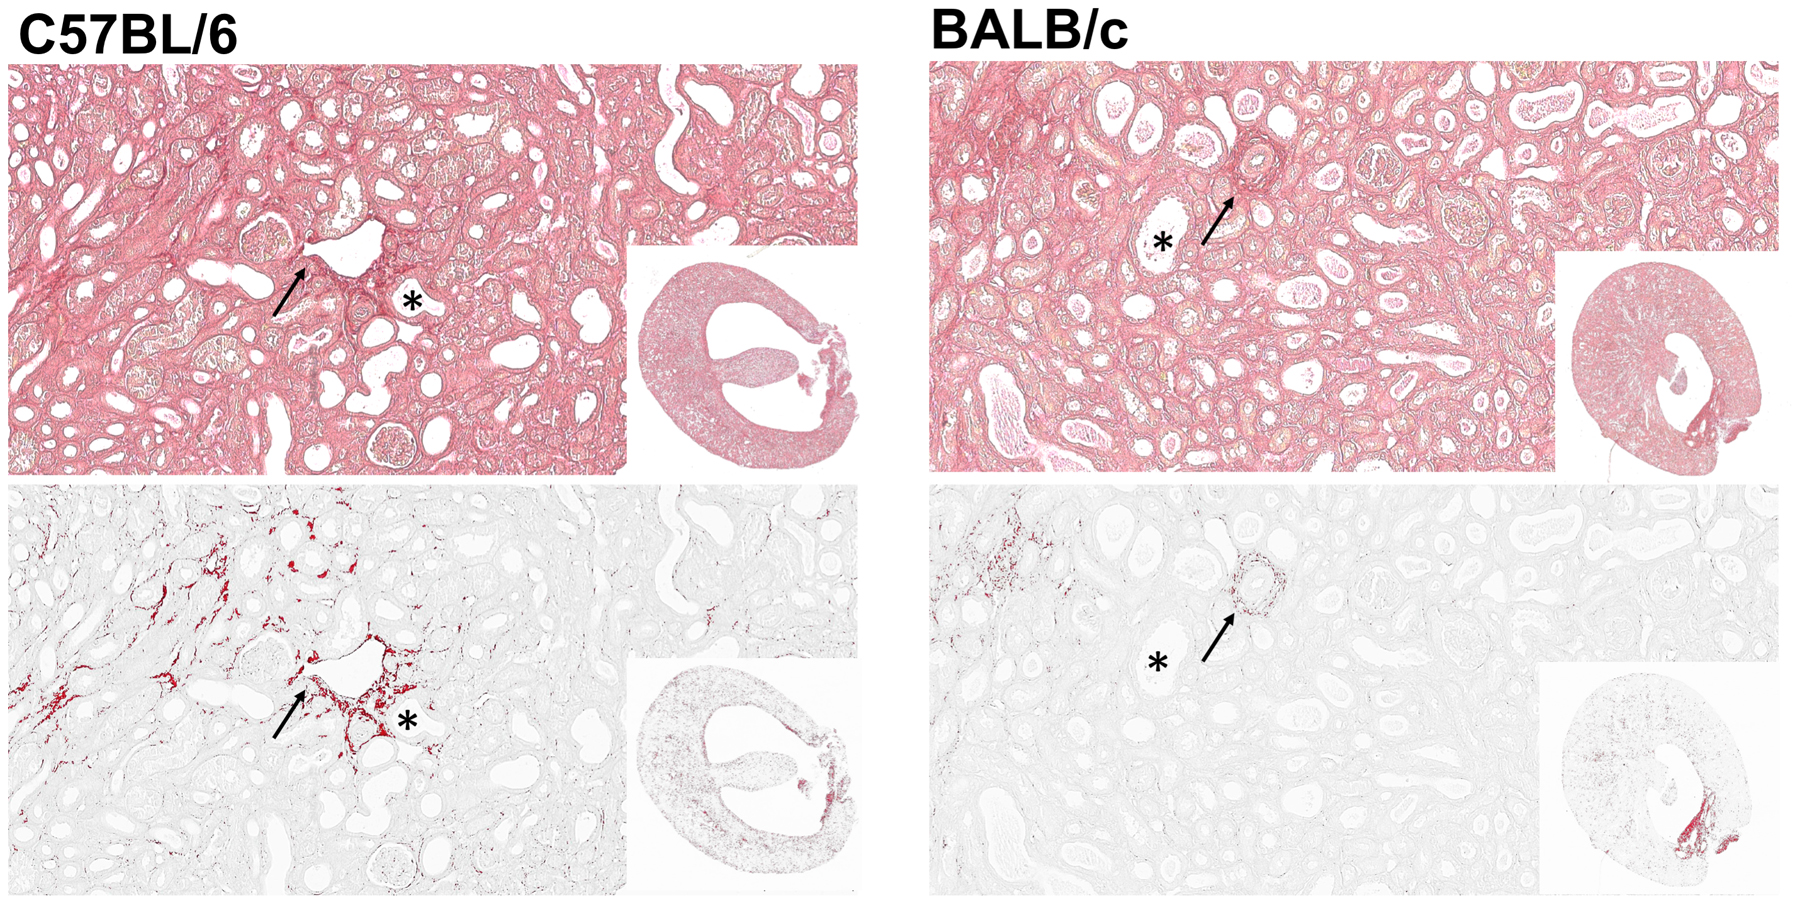
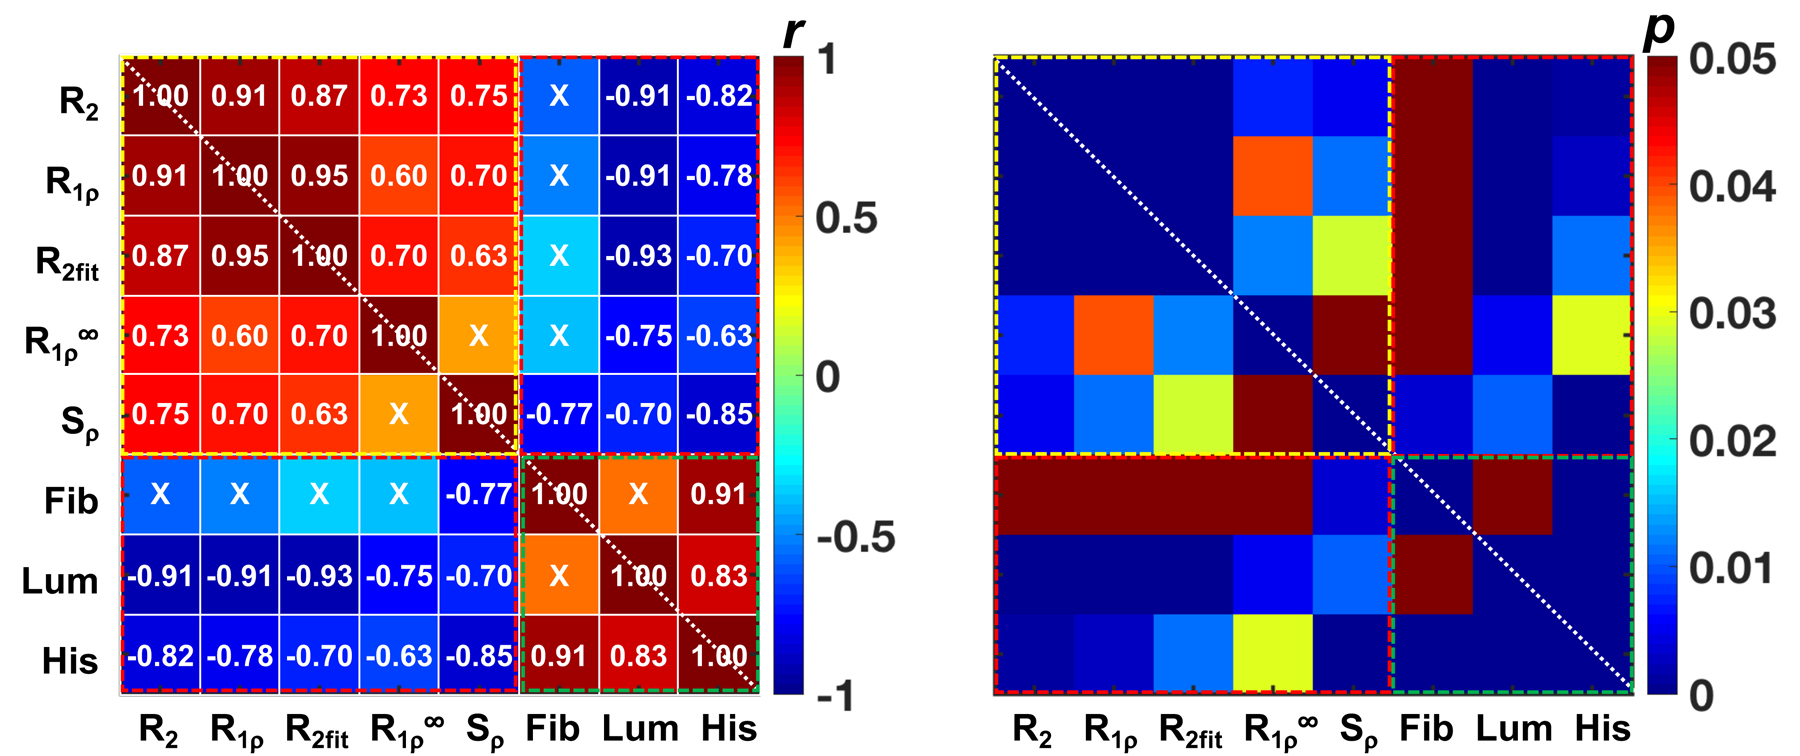
Histology detected extensive tubular dilation and mild fibrosis in the cortex and outer stripe of outer medulla (OSOM) of UUO kidneys ten days after surgery (Fig. 1), with tubular dilation shown in white color and fibrosis shown in red. C57BL/6N mouse exhibited more severe fibrosis in UUO kidney than BALB/c mouse (Fig.1). The luminal space and positive picrosirius red areas in cortex and OSOM were quantified and used as histological indices for assessing tubular dilation and fibrosis respectively. T2-weighted images differentiated cortex and OSOM from Inner stripe of outer medulla (ISOM), inner medulla (IM) and papilla (P) in contralateral (CL) kidneys with good contrast, while cortex and OSOM can be identified in UUO kidneys (Fig. 2). Evident decreases in R2 and R1ρ were observed in UUO compared to CL kidneys. We integrated values over ROIs corresponding to the cortex and OSOM to fit the data to the Chopra model. All kidneys showed considerable dispersion in R1ρ with locking field, decreasing about 25% over the range 400 – 3000 Hz (Fig. 3). Figure 4 shows pairwise comparisons of the derived parameters between CL and UUO kidneys. R2 values, which depend on the pool size ratio and exchange rate, clearly dropped significantly as tubular dilation and fibrosis occurred. There was less but evident variation in the asymptotic value of R1ρ(inf), which also depends on the pool size ratio, between the groups. These significant changes suggest that R1 and R2 relaxation rates are changed during tubular dilation and fibrosis as total protein and water content are changed. However, the exchange parameter Sρ changed by the largest factor among the parameters obtained from fitting. To good approximation, Sρ depends primarily on the exchange rates between water and other chemically shifted resonances such as hydroxyls and amides.2 This average exchange rate is sensitive to changes in pH and other physico-chemical aspects of the tissue microenvironment such as increases in fractions of proteins with slower exchanging or smaller chemically shifted protons (e.g. collagen). The histological fibrosis indices did not show evident correlation with luminal spaces. Among all the MRI measures, only Sρ showed significant correlation with the histological fibrosis index (Fig. 5). In contrast, most MRI measures showed very high and significant correlations with luminal space measurements, especially R2, R1ρ, and R2fit (Fig. 5).Conclusion
Renal tubular dilation and fibrosis can be assessed by spin-locking MRI and measures from R1ρ dispersion. While R2 and R1ρ at a single locking field reflect changes in water content, the additional insights provided by quantifying exchange parameters are likely complementary and more specific as novel imaging biomarkers to assess fibrosis in chronic renal diseases.Acknowledgements
We thank Mr. Fuxue Xin, Mr. Ken Wilkens, Mr. Jarrod True, and Dr. Mark D. Does in the Center for Small Animal Imaging at Vanderbilt University Institute of Imaging Science. This work was supported by National Institutes of Health grants EB024525 and DK114809. This work was also supported by grant 1S10OD019993-01 for the Advance III HD Console, housed in the Vanderbilt Center for Small Animal Imaging.References
1. Wang F, Takahashi K, Li H, Zu Z, Li K, Xu J, Harris RC, Takahashi T, Gore JC. Assessment of unilateral ureter obstruction with multi-parametric MRI. Magn Reson Med 2018;79(4):2216-2227.
2. Chopra S, Mcclung RED, Jordan RB. Rotating-frame relaxation rates of solvent molecules in solutions of paramagnetic-ions undergoing solvent exchange. J Magn Reson 1984;59(3):361-372.
3. Spear JT, Gore JC. Effects of diffusion in magnetically inhomogeneous media on rotating frame spin-lattice relaxation. J Magn Reson 2014;249:80-87.
Figures